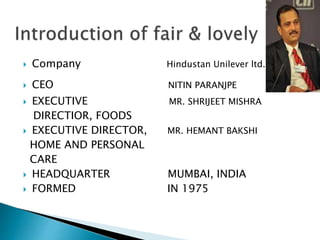
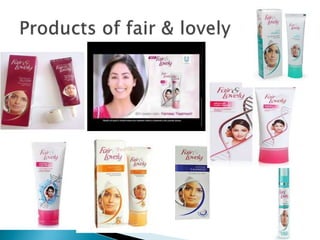
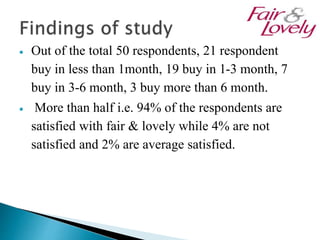
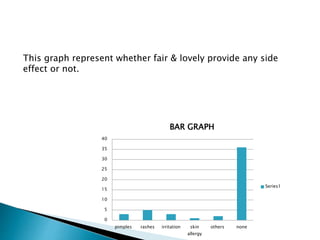
Project guide Made by- Aghna shamsi
Dheeraj Gandhi sir BBA V th
Sec-A
 Company Hindustan Unilever ltd.
 CEO NITIN PARANJPE
 EXECUTIVE MR. SHRIJEET MISHRA
DIRECTIOR, FOODS
 EXECUTIVE DIRECTOR, MR. HEMANT BAKSHI
HOME AND PERSONAL
CARE
 HEADQUARTER MUMBAI, INDIA
 FORMED IN 1975
• To study on the purchase pattern and level of
satisfaction.
• To find out the brand preference for fairness
cream among female.
• To study on the side effect of using fairness
cream.
 A detailed study of a subject, especially in
order to discover (new) information or reach a
(new) understanding.
 Sampling unit: The study was restricted to
NAGINA (U.P).
 Sampling size: The sample size taken for the
purpose of study was around 50 respondent
from the Nagina region.
 Sampling procedure: I tried to contact
customer almost from all the places of
Nagina region.
 Sampling method: convenience sampling
method.
 Out of the total 50 respondents, 21 respondent
buy in less than 1month, 19 buy in 1-3 month, 7
buy in 3-6 month, 3 buy more than 6 month.
 More than half i.e. 94% of the respondents are
satisfied with fair & lovely while 4% are not
satisfied and 2% are average satisfied.
 More than half i.e. 74% of the respondents considered
“fairness” provided as the prime factor in making a
choice of fairness cream. The second rated is
“sunscreen” with 16% respondents laying importance
to it. The least rank is fragrance i.e. 10%.
 Fair & lovely wins by clear majority of 72% i.e. 36
out of 50 respondents feel that fair & lovely does not
have any side effect.
This graph represents “How often do the respondent buy fair&
lovely” ?
0
5
10
15
20
25
less than 1
month
1-3 month 3-6 month more than 6
month
BAR GRAPH
Series1
This graph represent whether they are satisfied with this cream
or not
0
5
10
15
20
25
30
35
40
45
50
yes no average satisfied
Series1
This graph represent which factor influenced them in buying fair n lovely
37
8
5
00
5
10
15
20
25
30
35
40
fairness sunscreen fragrance none
Series1
This graph represent whether fair & lovely provide any side
effect or not.
0
5
10
15
20
25
30
35
40
pimples rashes irritation skin
allergy
others none
BAR GRAPH
Series1
 Packaging should be improved.
 Price of fair & lovely should be decreased.
 Fragrance of fair & lovely is low and it should
be increased.
 It should introduce fair & lovely body lotion.
 As per the respondent fair & lovely cream is
dry so changes should be made accordingly
to remove the dryness of the cream.
 Quality should be improved.
THANKYOU

fair n lovely

  • 1.
    Project guide Madeby- Aghna shamsi Dheeraj Gandhi sir BBA V th Sec-A
  • 2.
     Company HindustanUnilever ltd.  CEO NITIN PARANJPE  EXECUTIVE MR. SHRIJEET MISHRA DIRECTIOR, FOODS  EXECUTIVE DIRECTOR, MR. HEMANT BAKSHI HOME AND PERSONAL CARE  HEADQUARTER MUMBAI, INDIA  FORMED IN 1975
  • 4.
    • To studyon the purchase pattern and level of satisfaction. • To find out the brand preference for fairness cream among female. • To study on the side effect of using fairness cream.
  • 5.
     A detailedstudy of a subject, especially in order to discover (new) information or reach a (new) understanding.  Sampling unit: The study was restricted to NAGINA (U.P).  Sampling size: The sample size taken for the purpose of study was around 50 respondent from the Nagina region.
  • 6.
     Sampling procedure:I tried to contact customer almost from all the places of Nagina region.  Sampling method: convenience sampling method.
  • 7.
     Out ofthe total 50 respondents, 21 respondent buy in less than 1month, 19 buy in 1-3 month, 7 buy in 3-6 month, 3 buy more than 6 month.  More than half i.e. 94% of the respondents are satisfied with fair & lovely while 4% are not satisfied and 2% are average satisfied.
  • 8.
     More thanhalf i.e. 74% of the respondents considered “fairness” provided as the prime factor in making a choice of fairness cream. The second rated is “sunscreen” with 16% respondents laying importance to it. The least rank is fragrance i.e. 10%.  Fair & lovely wins by clear majority of 72% i.e. 36 out of 50 respondents feel that fair & lovely does not have any side effect.
  • 9.
    This graph represents“How often do the respondent buy fair& lovely” ? 0 5 10 15 20 25 less than 1 month 1-3 month 3-6 month more than 6 month BAR GRAPH Series1
  • 10.
    This graph representwhether they are satisfied with this cream or not 0 5 10 15 20 25 30 35 40 45 50 yes no average satisfied Series1
  • 11.
    This graph representwhich factor influenced them in buying fair n lovely 37 8 5 00 5 10 15 20 25 30 35 40 fairness sunscreen fragrance none Series1
  • 12.
    This graph representwhether fair & lovely provide any side effect or not. 0 5 10 15 20 25 30 35 40 pimples rashes irritation skin allergy others none BAR GRAPH Series1
  • 13.
     Packaging shouldbe improved.  Price of fair & lovely should be decreased.  Fragrance of fair & lovely is low and it should be increased.  It should introduce fair & lovely body lotion.  As per the respondent fair & lovely cream is dry so changes should be made accordingly to remove the dryness of the cream.  Quality should be improved.
  • 14.