More Related Content
Similar to Factsheet Fondo 3 HO
Similar to Factsheet Fondo 3 HO (20)
Factsheet Fondo 3 HO
- 1. AFP Horizonte
Inception
Assets under Management Datos al:
Fondo Tipo 3 - HO3
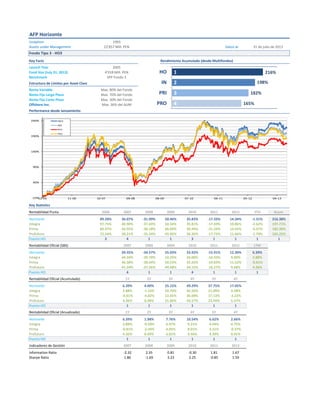
Key Facts Rendimiento Acumulado (desde Multifondos)
Launch Year
Fund Size (July 31, 2013)
Benchmark
Estructura de Límites por Asset Class
Renta Variable
Renta Fija Largo Plazo
Renta Fija Corto Plazo
Offshore Inv.
Performance desde lanzamiento
Key Statistics
Rentabilidad Punta 2006 2007 2008 2009 2010 2011 2012 YTD Acum.
Horizonte 89.28% 36.07% -31.99% 50.46% 35.83% -17.33% 14.34% -1.31% 216.38%
Integra 97.75% 40.90% -37.69% 50.34% 35.81% -17.59% 10.86% -2.62% 197.71%
1993
22'857 Mill. PEN 31 de julio de 2013
Max. 36% del AUM
2005
4'018 Mill. PEN
SPP Fondo 3
Max. 80% del Fondo
Max. 70% del Fondo
Max. 30% del Fondo
165%
182%
198%
216%
4
3
2
1
PRO
PRI
IN
HO
-10%
40%
90%
140%
190%
240%
12-05 11-06 10-07 09-08 08-09 07-10 06-11 05-12 04-13
HO3
IN3
PF3
PR3
Integra 97.75% 40.90% -37.69% 50.34% 35.81% -17.59% 10.86% -2.62% 197.71%
Prima 83.97% 42.95% -36.18% 46.69% 36.94% -21.23% 13.65% -6.47% 182.30%
Profuturo 72.54% 38.21% -35.24% 45.95% 36.35% -17.73% 11.66% -1.70% 165.25%
Puesto HO 2 4 1 1 3 1 1 1 1
Rentabilidad Oficial (SBS) 2007 2008 2009 2010 2011 2012 LTM
Horizonte 39.35% -34.57% 55.03% 33.92% -15.91% 12.30% 6.39%
Integra 44.24% -39.70% 54.25% 34.00% -16.33% 9.00% 2.88%
Prima 46.38% -38.44% 50.53% 35.65% -19.83% 11.52% -0.81%
Profuturo 41.54% -37.26% 49.68% 34.15% -16.27% 9.68% 4.36%
Puesto HO 4 1 1 4 1 1 1
Rentabilidad Oficial (Acumulado) 1Y 2Y 3Y 4Y 5Y 6Y
Horizonte 6.39% 4.00% 25.15% 49.29% 37.75% 17.05%
Integra 2.88% -1.16% 20.70% 42.26% 21.89% 4.58%
Prima -0.81% -4.82% 12.65% 36.08% 17.13% -2.22%
Profuturo 4.36% 0.98% 21.86% 43.57% 23.94% 5.57%
Puesto HO 1 1 1 1 1 1
Rentabilidad Oficial (Anualizado) 1Y 2Y 3Y 4Y 5Y 6Y
Horizonte 6.39% 1.98% 7.76% 10.54% 6.62% 2.66%
Integra 2.88% -0.58% 6.47% 9.21% 4.04% 0.75%
Prima -0.81% -2.44% 4.05% 8.01% 3.21% -0.37%
Profuturo 4.36% 0.49% 6.81% 9.46% 4.39% 0.91%
Puesto HO 1 1 1 1 1 1
Indicadores de Gestión 2007 2008 2009 2010 2011 2012
Information Ratio -2.32 2.35 0.81 -0.30 1.81 1.67
Sharpe Ratio 1.86 -1.69 3.23 2.25 -0.85 1.59
-10%
40%
90%
140%
190%
240%
12-05 11-06 10-07 09-08 08-09 07-10 06-11 05-12 04-13
HO3
IN3
PF3
PR3