Evolução dos valores programados - meio tv - Governo Federal
•
0 likes•1,870 views

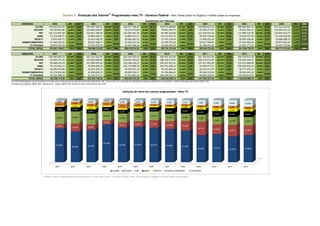
Investimentos em publicidade do Governo Federal - 2000/2015 - por emissora de TV

Recommended
More Related Content
Similar to Evolução dos valores programados - meio tv - Governo Federal
Similar to Evolução dos valores programados - meio tv - Governo Federal (20)
Recently uploaded
Recently uploaded (16)
Evolução dos valores programados - meio tv - Governo Federal
- 1. EMISSORA 2000 INV AUD (2) 2001 INV AUD 2002 INV AUD 2003 INV AUD 2004 INV AUD 2005 INV AUD 2006 INV AUD GLOBO 370.429.555,35 54,96% 53,8% 397.487.502,13 49,90% 51,2% 346.977.768,29 52,53% 54,1% 359.075.080,85 61,10% 55,2% 449.880.670,15 55,96% 56,6% 480.085.881,33 57,05% 53,3% 527.314.325,02 56,05% 53,6% RECORD 46.338.601,88 6,87% 9,4% 103.062.620,67 12,94% 9,2% 56.127.473,89 8,50% 8,1% 39.831.207,57 6,78% 7,8% 65.509.377,67 8,15% 7,9% 76.633.595,12 9,11% 9,7% 110.626.915,10 11,76% 11,4% SBT 135.113.097,69 20,05% 19,6% 154.021.188,49 19,34% 21,0% 116.285.561,54 17,60% 19,0% 85.482.226,80 14,55% 16,7% 116.729.554,42 14,52% 16,6% 121.986.732,96 14,50% 17,3% 133.645.610,77 14,21% 14,0% BAND 51.114.658,75 7,58% 4,6% 52.893.509,27 6,64% 4,7% 43.885.447,57 6,64% 4,9% 40.137.454,72 6,83% 5,7% 49.550.756,26 6,16% 4,6% 53.424.707,92 6,35% 4,7% 63.130.662,82 6,71% 4,7% REDETV 9.910.433,71 1,47% 2,4% 33.423.548,53 4,20% 3,0% 30.083.282,51 4,55% 2,9% 13.741.218,29 2,34% 3,2% 17.446.252,34 2,17% 2,4% 20.959.338,36 2,49% 2,5% 19.868.588,53 2,11% 2,3% DEMAIS EMISSORAS 41.240.593,25 6,12% 38.457.188,57 4,83% 34.282.012,30 5,19% 32.769.781,68 5,58% 63.027.760,85 7,84% 47.433.306,49 5,64% 29.877.834,46 3,18% TV FECHADA 19.874.167,58 2,95% 17.244.752,54 2,16% 32.937.668,33 4,99% 16.664.043,49 2,84% 41.798.351,81 5,20% 41.007.177,52 4,87% 56.253.742,86 5,98% TOTAL GERAL 674.021.108,21 100% 100% 796.590.310,20 100% 100% 660.579.214,43 100% 100% 587.701.013,40 100% 100% 803.942.723,50 100% 100% 841.530.739,70 100% 100% 940.717.679,56 100% 100% EMISSORA 2007 INV AUD 2008 INV AUD 2009 INV AUD 2010 INV AUD 2011 INV AUD 2012 INV AUD GLOBO 428.340.695,14 53,99% 49,6% 447.151.252,93 51,26% 46,6% 563.164.795,19 43,96% 46,9% 546.555.351,00 45,47% 44,5% 451.755.072,36 41,91% 43,8% 495.270.915,28 43,98% 43,7% RECORD 96.594.572,28 12,18% 14,6% 135.062.640,95 15,48% 16,3% 278.052.465,65 21,71% 16,1% 188.729.176,01 15,70% 16,6% 200.115.912,85 18,57% 15,7% 174.382.548,15 15,49% 14,3% SBT 95.048.243,24 11,98% 12,7% 101.899.039,56 11,68% 12,7% 143.248.536,27 11,18% 11,7% 149.367.032,41 12,43% 11,8% 137.251.905,96 12,73% 12,3% 153.552.688,48 13,64% 12,2% BAND 73.115.942,12 9,22% 5,1% 78.594.069,10 9,01% 5,4% 103.716.980,79 8,10% 5,6% 109.716.168,19 9,13% 5,4% 93.949.477,53 8,72% 4,9% 100.549.938,34 8,93% 5,4% REDETV 16.005.973,80 2,02% 2,4% 25.301.339,14 2,90% 2,6% 45.534.071,22 3,55% 2,5% 49.253.962,95 4,10% 2,5% 50.531.917,07 4,69% 2,3% 39.777.101,16 3,53% 1,7% DEMAIS EMISSORAS 32.178.492,68 4,06% 32.834.849,14 3,76% 49.895.762,11 3,90% 55.186.066,43 4,59% 49.338.139,06 4,58% 49.563.103,30 4,40% TV FECHADA 52.052.200,22 6,56% 51.514.577,71 5,91% 97.351.843,16 7,60% 103.194.811,17 8,59% 94.865.249,59 8,80% 112.953.614,07 10,03% TOTAL GERAL 793.336.119,48 100% 100% 872.357.768,53 100% 100% 1.280.964.454,39 100% 100% 1.202.002.568,16 100% 100% 1.077.807.674,42 100% 100% 1.126.049.908,78 100% 100% (1) Informação gerada a partir de dados fornecidos pelo Instituto para Acompanhamento da Publicidade - IAP, e de acordo com a previsão de utilização de espaços publicitários nos períodos - Valores indexados pelo índice IGPM - FGV (2) Dados de audiência: IBOPE PNT - Média Anual - Target: ABCDE 18+, Ambos os sexos, faixa horária: 6h às 24h Gráfico: Valores Programados por emissoras de TV, anos 2000 a 2012 - Governo Federal - Adm. Direta (todos os Órgãos) e Indireta (todas as empresas) 22,8% Quadro 2 - Evolução dos Valores(1) Programados meio TV - Governo Federal - Adm. Direta (todos os Órgãos) e Indireta (todas as empresas) Investimento em Televisão 10,2% 10,9% 11,0% 11,4% 11,9% 12,5% 14,0% 15,6% 16,4% 17,2% 19,2% 20,9% 2000 2001 2002 2003 2004 2005 2006 2007 2008 2009 2010 2011 2012 54,96% 49,90% 52,53% 61,10% 55,96% 57,05% 56,05% 53,99% 51,26% 43,96% 45,47% 41,91% 43,98% 6,87% 12,94% 8,50% 6,78% 8,15% 9,11% 11,76% 12,18% 15,48% 21,71% 15,70% 18,57% 15,49% 20,05% 19,34% 17,60% 14,55% 14,52% 14,50% 14,21% 11,98% 11,68% 11,18% 12,43% 12,73% 13,64% 7,58% 6,64% 6,64% 6,83% 6,16% 6,35% 6,71% 9,22% 9,01% 8,10% 9,13% 8,72% 8,93% 4,20% 4,55% 2,90% 3,55% 4,10% 4,69% 3,53% 6,12% 4,83% 5,19% 5,58% 7,84% 5,64% 3,18% 4,06% 3,76% 3,90% 4,59% 4,58% 4,40% 2,95% 2,16% 4,99% 2,84% 5,20% 4,87% 5,98% 6,56% 5,91% 7,60% 8,59% 8,80% 10,03% Evolução do share dos valores programados - Meio TV GLOBO RECORD SBT BAND REDETV DEMAIS EMISSORAS TV FECHADA