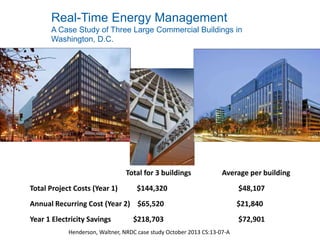
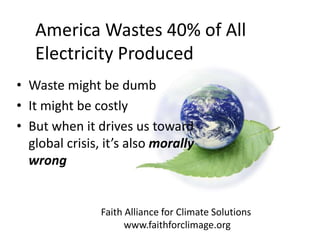
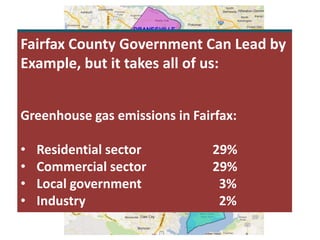
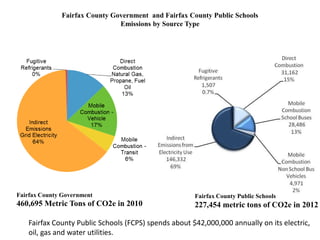
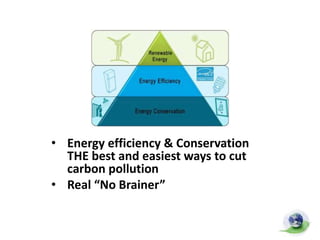
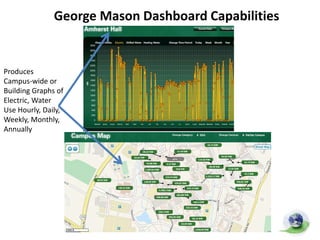
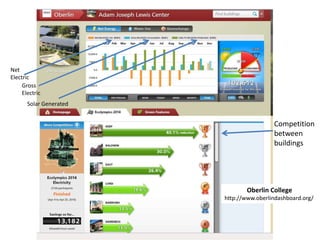
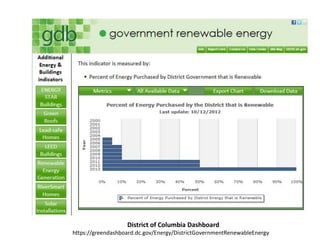
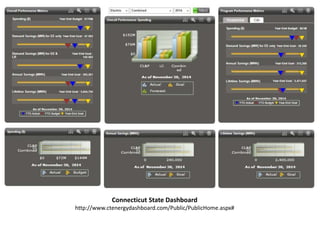
This document discusses energy efficiency and climate change from a faith perspective. It advocates for the implementation of energy dashboards to monitor energy use in Fairfax County government buildings. Energy dashboards have been shown to reduce energy usage by 3-12% by allowing for data-driven decisions and public accountability. The document argues that reducing wasted energy and emissions is a moral issue and that Fairfax County should lead by implementing an energy dashboard system to cut costs and pollution.


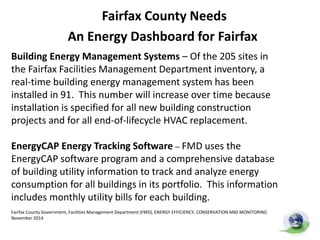
![Median Energy Information System costs:
up-front, ongoing, 5-yr costs and savings
Type of Costs Median
[$] [$/pt] [$/building] [$/sf]
Up-front (N=18) 23,000 230 1,400 0.01
Ongoing/yr (N=17) 16,000 200 400 0.01
5 yr cost (N=14) 150,000 1,800 3,600 0.06
Granderson, J, Lin, G, Piette, MA. Energy information systems (EIS): Technology costs, benefits, and best practice uses. Lawrence Berkeley
National Laboratory, November 2013. LBNL-6476E.
Energy information systems were cited as a critical component in achieving
17 percent median site savings, and 8 percent median portfolio savings](https://image.slidesharecdn.com/facsslideshow1-21-15-150130164813-conversion-gate01/85/Facs-slide-show-1-21-15-14-320.jpg)