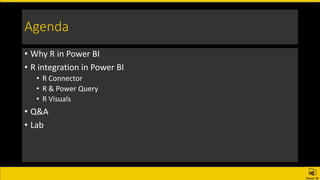
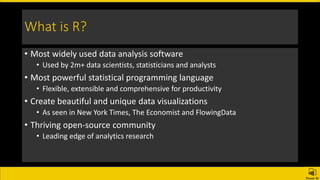
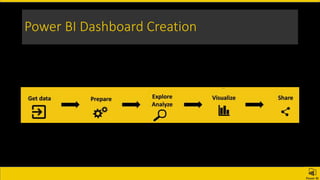
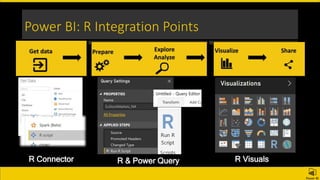
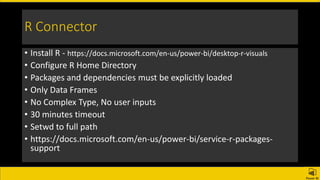
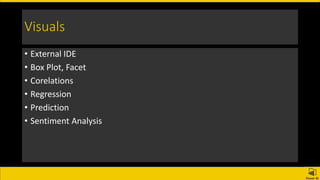
Power BI with R
Guruprasad Vijayarao
3/21/2018
Agenda
• Why R in Power BI
• R integration in Power BI
• R Connector
• R & Power Query
• R Visuals
• Q&A
• Lab
What is R?
• Used by 2m+ data scientists, statisticians and analysts
• Flexible, extensible and comprehensive for productivity
• As seen in New York Times, The Economist and FlowingData
CRAN: 7000+ add-on packages for R
Power BI Dashboard Creation
Power BI: R Integration Points
R Connector R & Power Query R Visuals
R Connector
• Install R - https://docs.microsoft.com/en-us/power-bi/desktop-r-visuals
• Configure R Home Directory
• Packages and dependencies must be explicitly loaded
• Only Data Frames
• No Complex Type, No user inputs
• 30 minutes timeout
• Setwd to full path
• https://docs.microsoft.com/en-us/power-bi/service-r-packages-
support
Data
• Web Data Scrub - rvest, httr, rcurl, and others
• Complicated Data Transformation: dplyr, tidyr, lubrdiate, stringr…
• XML or JSON data: XML, jsonlite, and others
• RegEx to Scrub the data
• mice package to impute missing values
• tidytext package to assign sentiment scores to text inputs
• Export Data
Visuals
• External IDE
• Box Plot, Facet
• Corelations
• Regression
• Prediction
• Sentiment Analysis
R Visual Gallery
Data Refresh
• Privacy levels
• Personal Gateway
Limitations
• Data size limitations: 150,000 rows
• Calculation time limitation 5 minutes.
• Relationships.
• R visuals responses for cross-filtering but it cannot filter.
• R visuals respond to highlighting other visuals, but you cannot click on
elements in the R visual in order to cross filter other elements.
Resources
• Documentation:
• https://powerbi.microsoft.com/en-us/documentation/Powerbi-Service-R-Packages-Support
• https://powerbi.microsoft.com/en-us/documentation/powerbi-desktop-r-scripts
• R Visuals Gallery:
https://app.powerbi.com/visuals/R-powered
• R Script Showcase:
https://community.powerbi.com/t5/R-Script-Showcase/bd-p/RVisuals
Related Conent
• https://www.youtube.com/watch?v=SMaJf6UBKeI&t=591s
• https://www.blue-granite.com/tutorials/power-bi-and-r
Lab
• Sample
https://www.linkedin.com/pulse/embedded-hr-analytics-using-r-power-bi-andy-lowrey
• Source Code
https://github.com/lowreya/workforce-analytics-demo
Demo Script – Cheet Sheet
• Check the Notes below for scripts

Using R in power BI

Editor's Notes

  • #7 https://powerbi.microsoft.com/en-us/documentation/powerbi-desktop-r-scripts/ https://powerbi.microsoft.com/en-us/documentation/powerbi-desktop-r-in-query-editor/ https://powerbi.microsoft.com/en-us/documentation/powerbi-desktop-r-visuals/
  • #8 https://powerbi.microsoft.com/en-us/documentation/powerbi-desktop-r-in-query-editor/
  • #9 Write.table (dataset, file = “[PATH OF FILE]”, sep = “[SEPARATOR]”, row.names = FALSE)
  • #10 https://community.powerbi.com/t5/R-Script-Showcase/bd-p/RVisuals
  • #11 https://community.powerbi.com/t5/R-Script-Showcase/bd-p/RVisuals
  • #17 Use ‘data(package = .packages(all.available = TRUE))’ to list the data sets in all *available* packages. #------------------Visuals Density Chart plot(density(dat$StockValue)) abline(v = quantile(dat$StockValue, 0.05), col = "red") #------------------Visuals Correlation Chart data(mtcars) require("corrplot") library(corrplot) M <- cor(dataset) #Experiment different plotting parameters by uncommenting your preferred plotting instruction corrplot(M, method = "circle",type = "upper" , tl.srt = 0 ) #corrplot(M, method = "circle", order="hclust", addrect=2) #corrplot(M, method = "color", tl.cex=0.6, tl.srt = 45, tl.col = "black") #corrplot(M, method = "ellipse", type = "upper", tl.cex=0.6, tl.srt = 45, tl.col = "black") install.packages("corrplot") library(corrplot) M <- cor(mtcars) corrplot(M, method = "number") #------------------Venn Diagram install.package('VennDiagram') library(VennDiagram) v<-draw.triple.venn(dataset[1,1],dataset[1,2],dataset[1,3],dataset[1,4],dataset[1,5],dataset[1,6],dataset[1,7],c("First","Second","Third "),cex=1.2, cat.dist = c(0.1, 0.1, 0.1),cat.fontfamily = "plain", fontfamily = "plain")