The document outlines the educational course material for exploratory analytics in Python, emphasizing that it is for instructional purposes only and should not be considered professional advice. It includes a comprehensive introduction to Python programming, covering its history, data types, operators, expressions, and various Python libraries such as NumPy and Pandas. Additionally, it provides structured content for learning Python, including multiple mini projects to reinforce the concepts discussed.


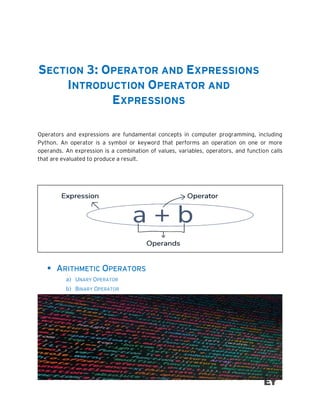
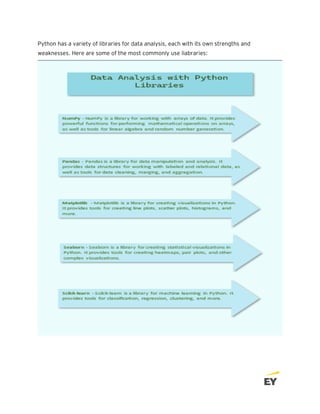
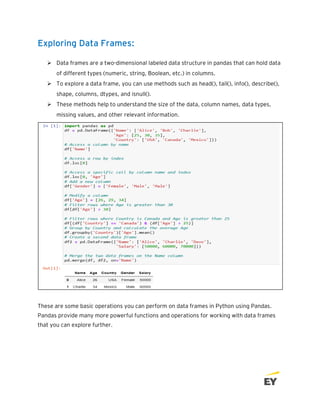
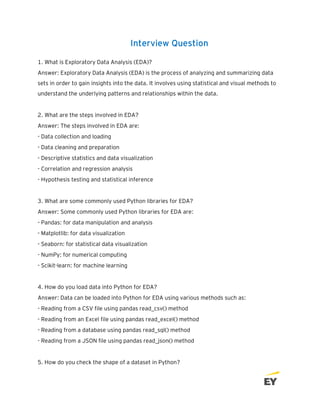
![LIST, TUPLE, DICTIONARY, SETS WITH EXAMPLE
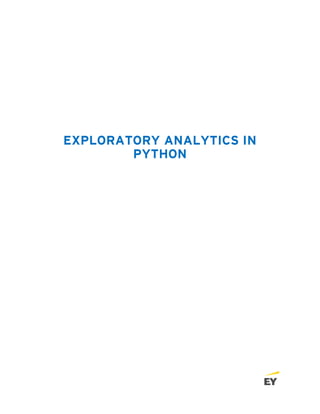
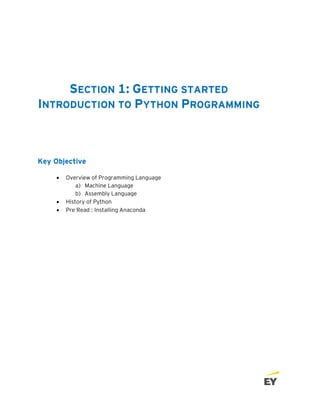
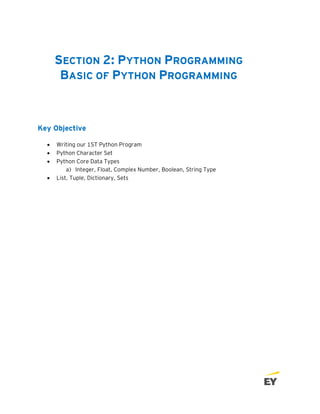
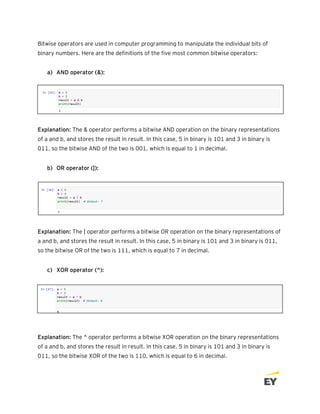
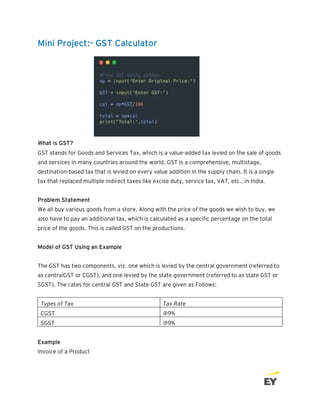
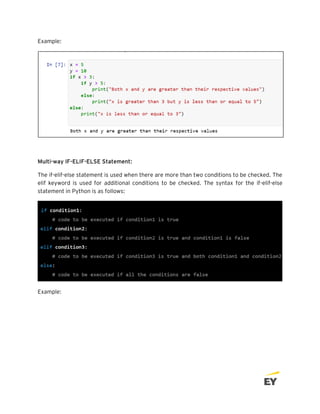
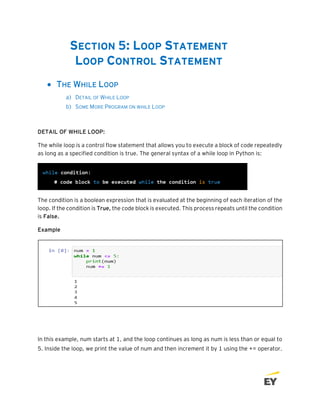
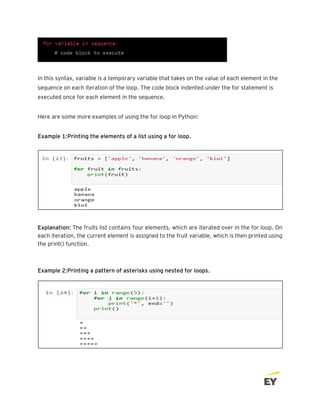
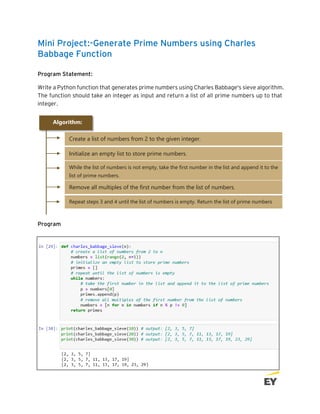
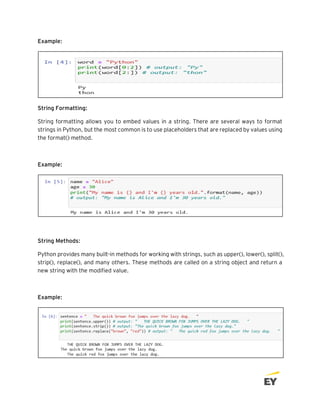
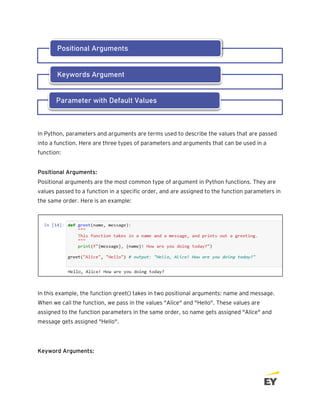
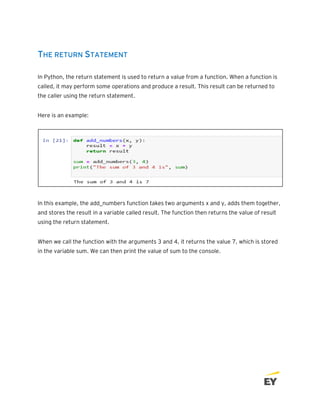
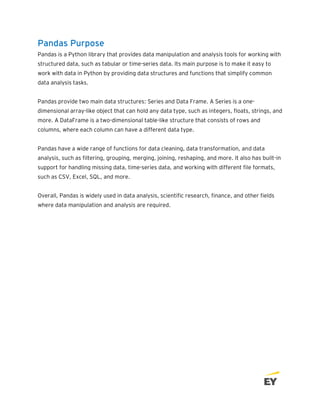
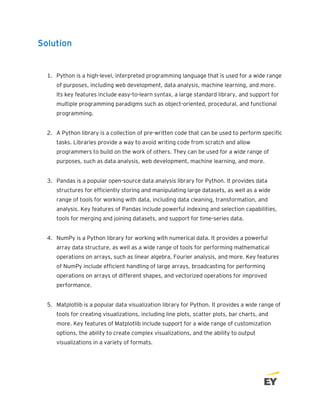
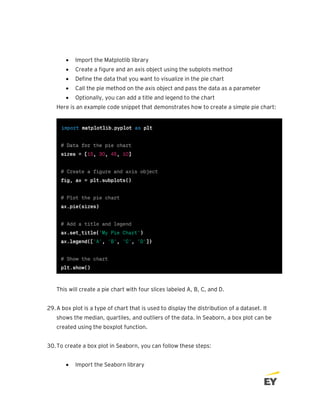
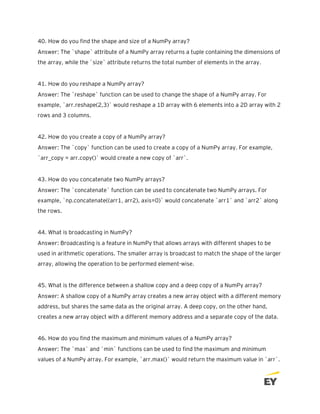
▪ List: A list is a mutable sequence of elements enclosed in square brackets [ ]. Each
element in a list is separated by a comma. Here's an example:
▪ Tuple: A tuple is an immutable sequence of elements enclosed in parentheses ( ). Each
element in a tuple is separated by a comma. Here's an example:
▪ Dictionary: A dictionary is a collection of key-value pairs enclosed in curly braces { }.
Each key-value pair is separated by a colon, and the keys are unique. Here's an
example:
▪ Set: A set is an unordered collection of unique elements enclosed in curly braces { }.
Here's an example:](https://image.slidesharecdn.com/exploratoryanalyticsinpython-240509060245-a04ad8d7/85/Exploratory-Analytics-in-Python-provided-by-EY-pdf-15-320.jpg)
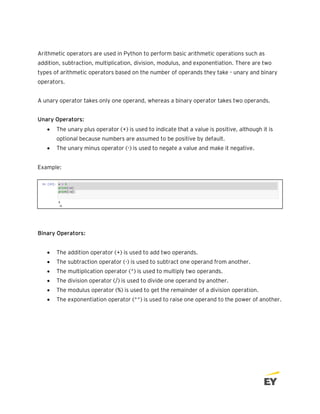
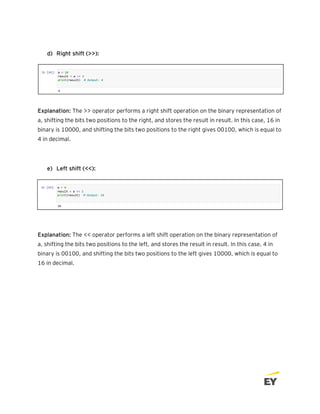
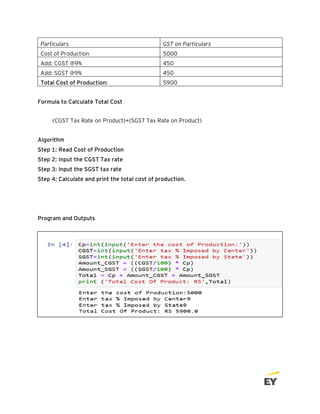
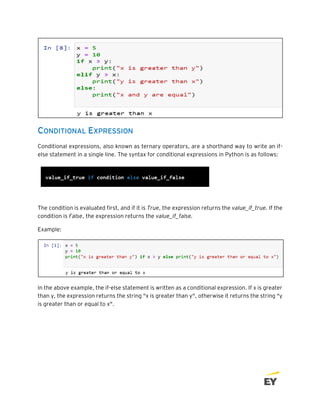
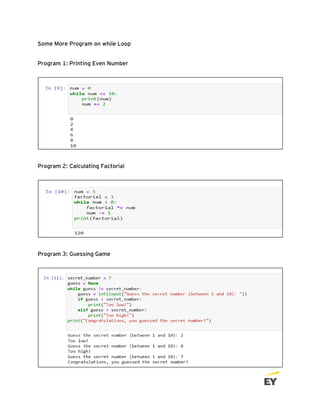
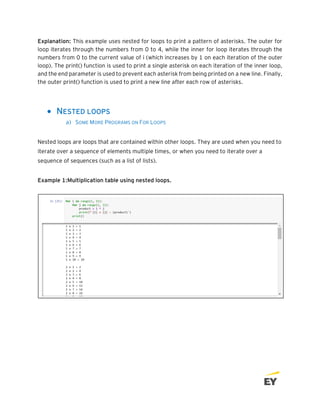

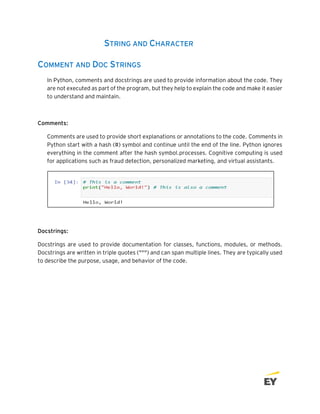

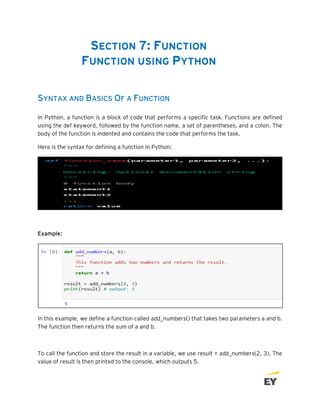

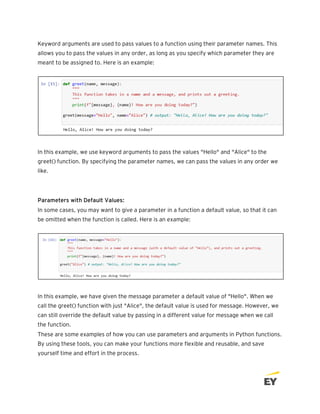
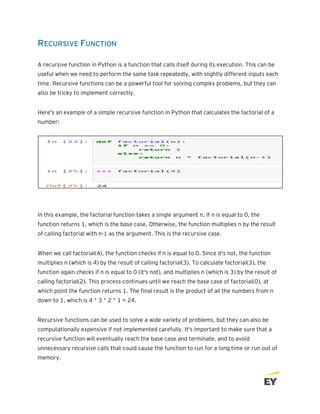


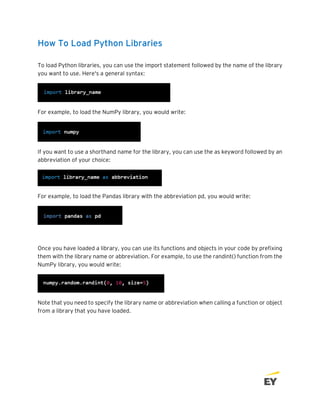
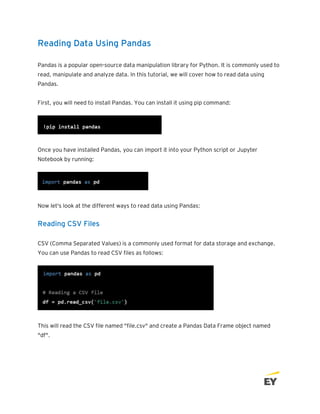
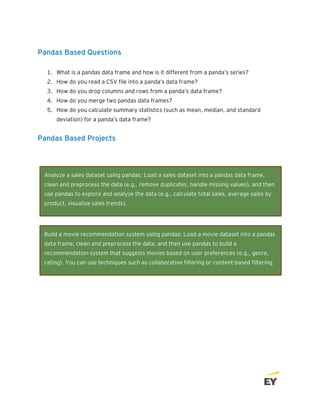


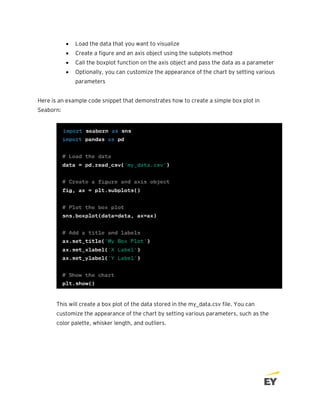

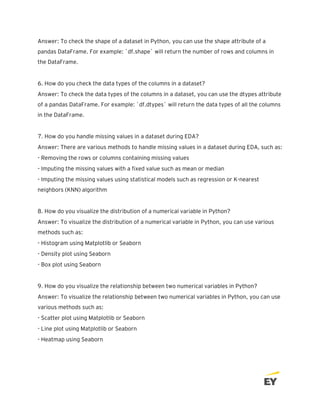
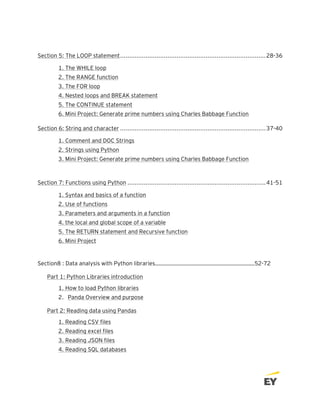
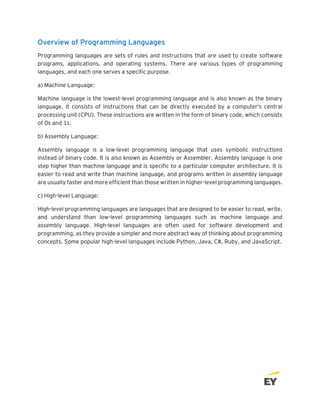
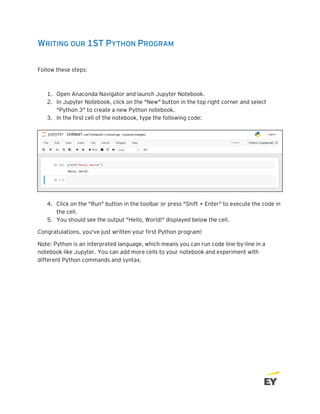
![26. What is a DataFrame in Pandas?
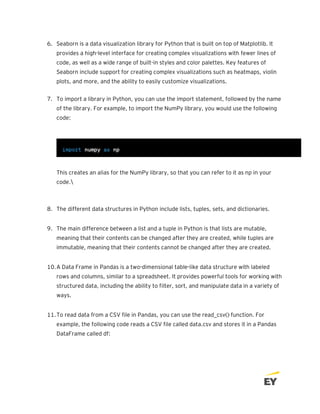
Answer: A DataFrame is a two-dimensional tabular data structure with rows and columns. It is
similar to a spreadsheet or SQL table.
27. How do you create a Series in Pandas?
Answer: You can create a Series in Pandas by passing a list or array of values to the
`pd.Series` function.
28. How do you create a DataFrame in Pandas?
Answer: You can create a DataFrame in Pandas by passing a dictionary of lists or arrays to
the `pd.DataFrame` function.
29. How do you select columns from a DataFrame in Pandas?
Answer: You can select columns from a DataFrame in Pandas by using the column name as an
index, such as `df['column_name']`.
30. How do you select rows from a DataFrame in Pandas?
Answer: You can select rows from a DataFrame in Pandas by using the `loc` or `iloc`
function, such as `df.loc[index]` or `df.iloc[row_number]`.
31. How do you rename columns in a DataFrame in Pandas?
Answer: You can rename columns in a DataFrame in Pandas by using the `rename` function
and passing a dictionary of old and new column names, such as
`df.rename(columns={'old_name': 'new_name'})`.
32. How do you drop columns from a DataFrame in Pandas?
Answer: You can drop columns from a DataFrame in Pandas by using the `drop` function and
passing the column name or index, such as `df.drop('column_name', axis=1)`.
33. How do you add columns to a DataFrame in Pandas?](https://image.slidesharecdn.com/exploratoryanalyticsinpython-240509060245-a04ad8d7/85/Exploratory-Analytics-in-Python-provided-by-EY-pdf-100-320.jpg)
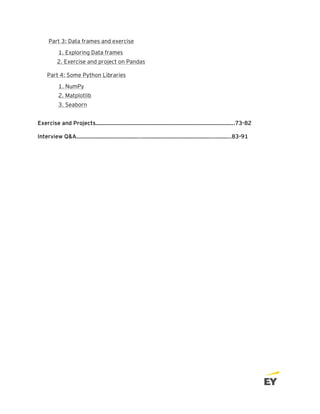
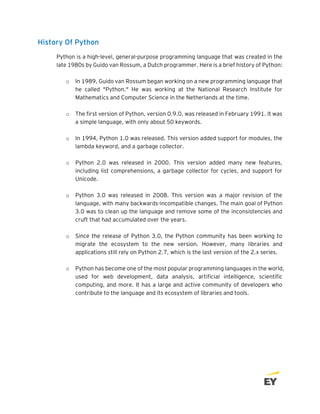
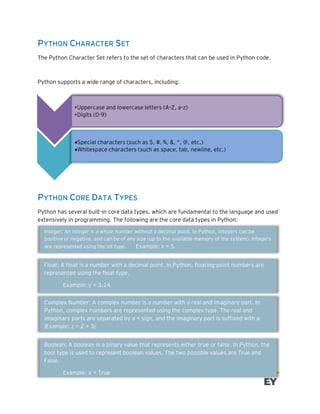
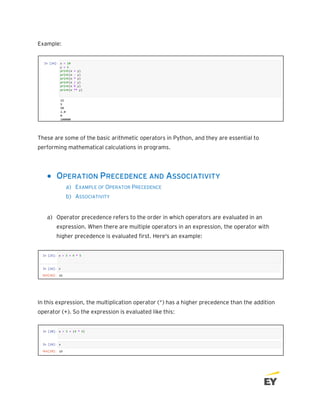
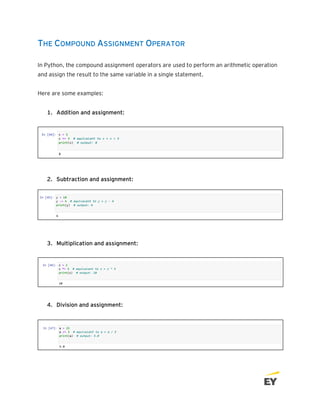
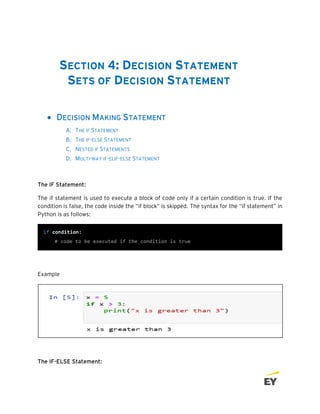
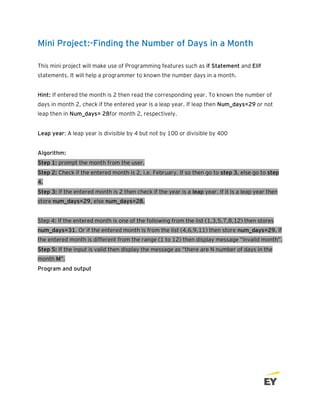
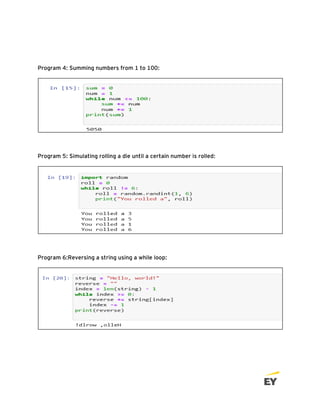
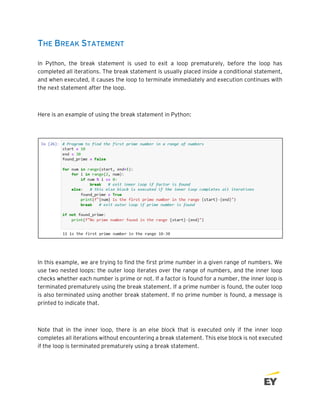
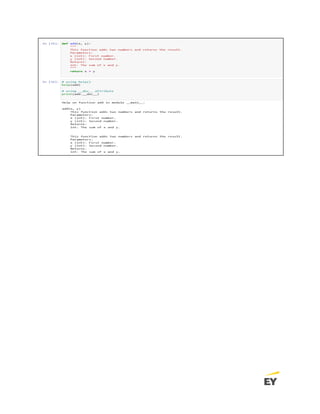
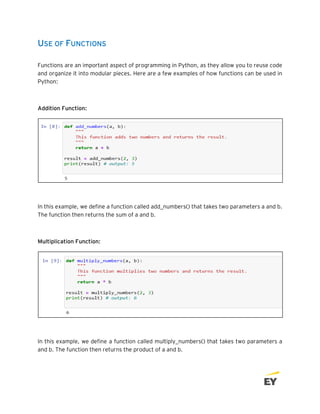
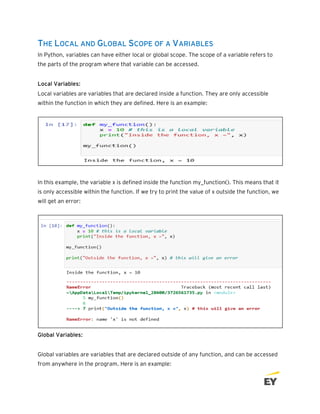
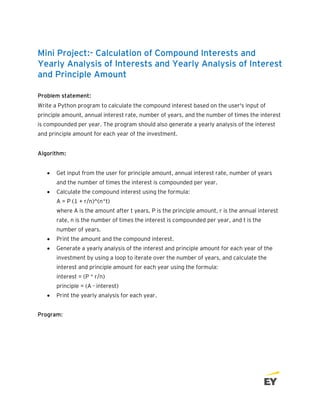
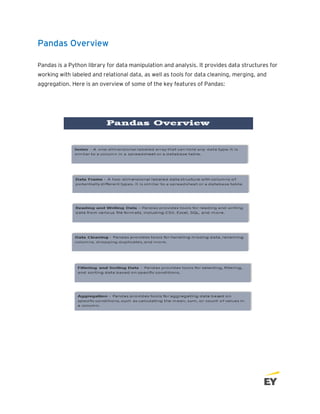
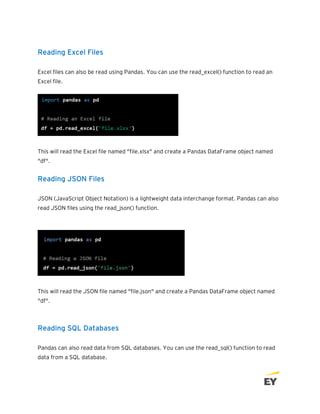
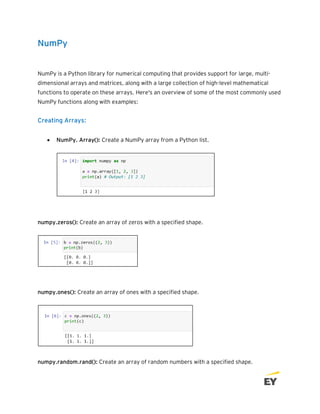
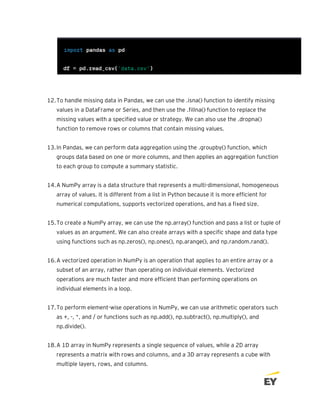
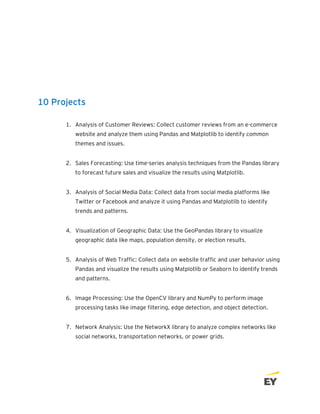
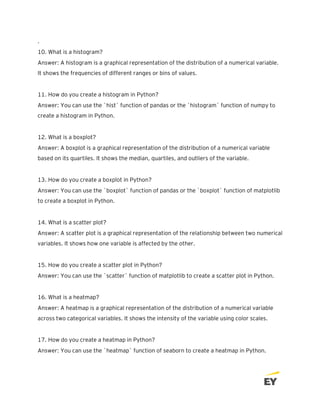
![Answer: You can add columns to a DataFrame in Pandas by assigning a new column as a
Series or a list, such as `df['new_column'] = [1, 2, 3]`.
34. How do you group data in a DataFrame in Pandas?
Answer: You can group data in a DataFrame in Pandas by using the `groupby` function and
passing the column name or names to group by, such as `df.groupby('column_name')`.
35. How do you calculate descriptive statistics of a DataFrame in Pandas?
Answer: You can calculate descriptive statistics of a DataFrame in Pandas by using the
`describe` function, such as `df.describe()`.
36. What is NumPy?
Answer: NumPy is a Python library used for numerical computations in scientific computing. It
provides support for large, multi-dimensional arrays and matrices, along with a large
collection of high-level mathematical functions to operate on these arrays.
37. How do you create a NumPy array?
Answer: NumPy arrays can be created in several ways, including by converting a list or tuple
to an array using the `array` function or by using functions like `zeros`, `ones`, and
`random`.
38. What is the difference between a list and a NumPy array?
Answer: Lists in Python are dynamic and can contain elements of different data types, while
NumPy arrays are homogeneous and fixed in size. NumPy arrays are also faster and more
memory-efficient than lists when working with large datasets.
39. How do you access elements of a NumPy array?
Answer: Elements of a NumPy array can be accessed using indexing or slicing. For example,
`arr[0]` would access the first element of the array, and `arr[1:3]` would access elements 1
and 2.](https://image.slidesharecdn.com/exploratoryanalyticsinpython-240509060245-a04ad8d7/85/Exploratory-Analytics-in-Python-provided-by-EY-pdf-101-320.jpg)
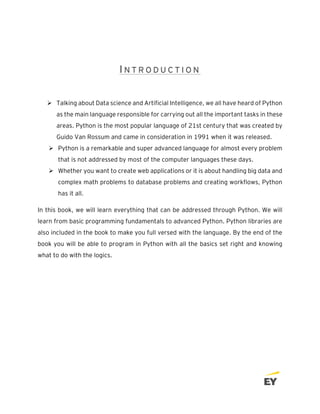
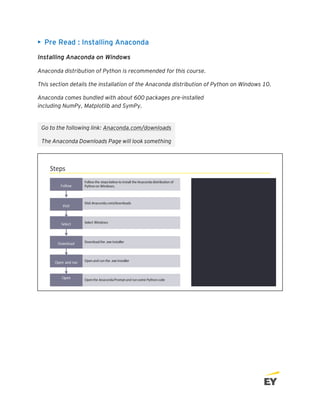
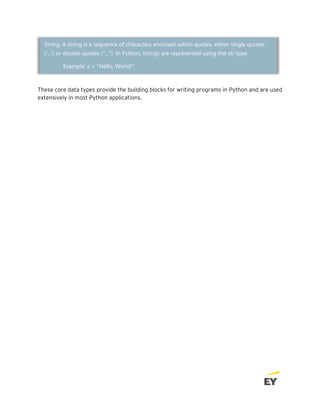
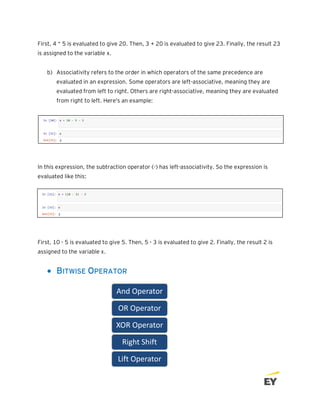
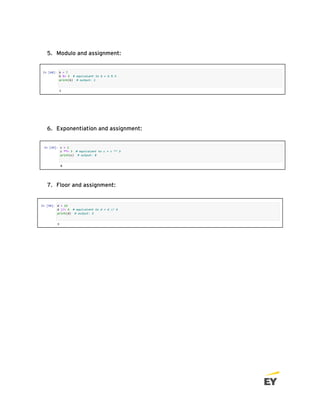
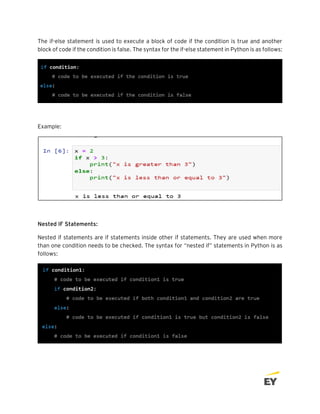
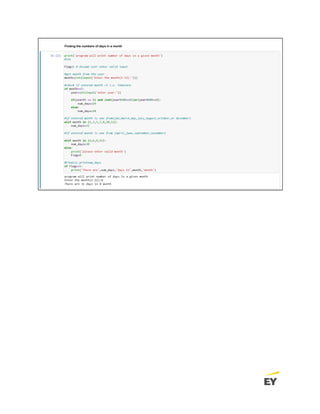
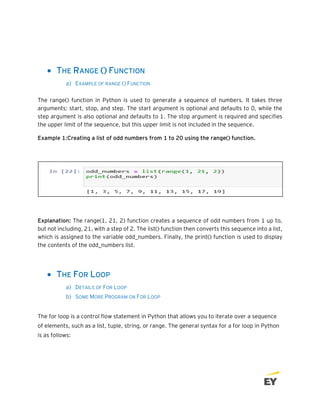
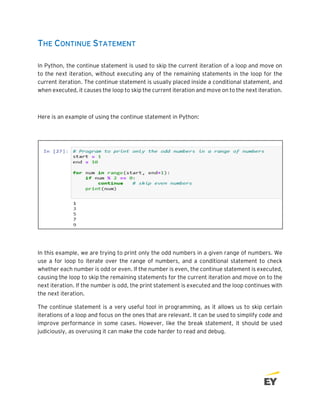
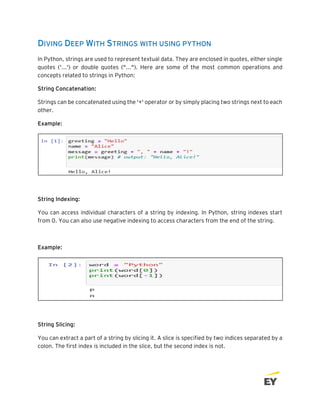
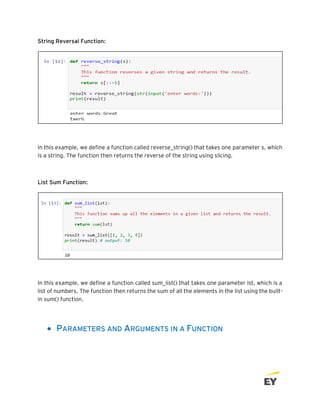
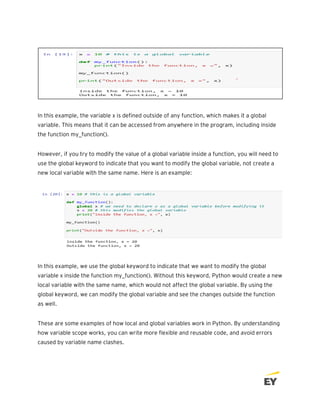
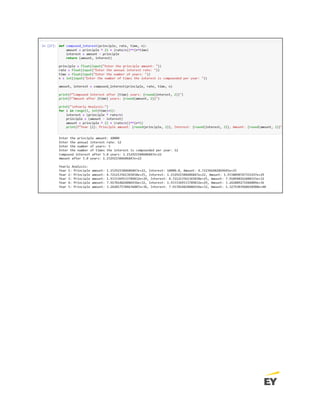
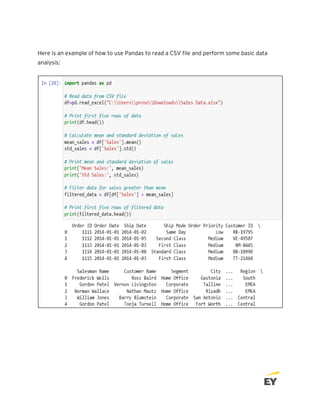
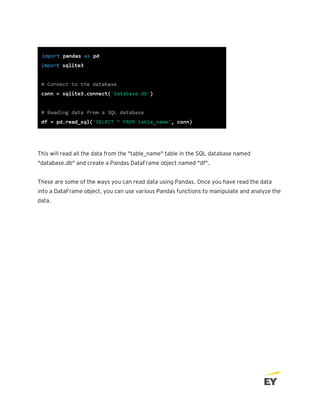
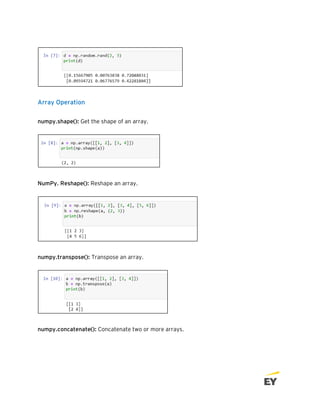
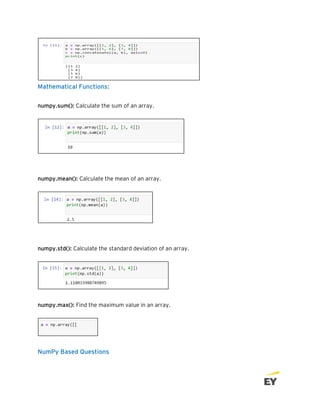
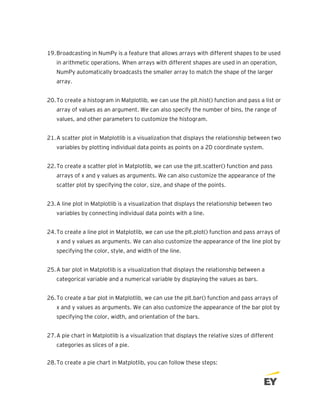
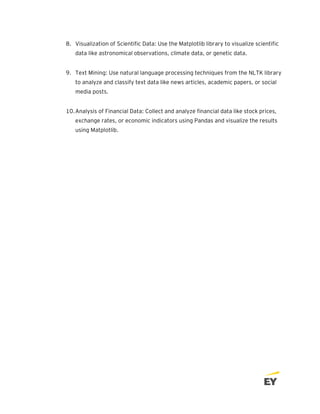
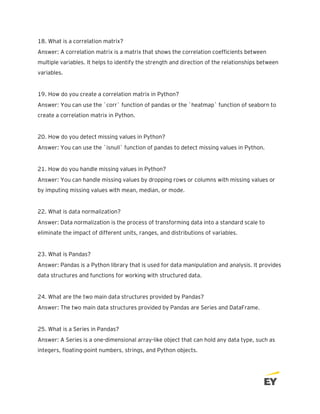
![47. How do you find the sum and product of a NumPy array?
Answer: The `sum` and `prod` functions can be used to find the sum and product of the
elements in a NumPy array, respectively. For example, `arr.sum()` would return the sum of
the elements in `arr`.
48. How do you compute the mean, median, and standard deviation of a NumPy array?
Answer
49. How do you pivot a DataFrame in Pandas?
Answer: You can pivot a DataFrame in Pandas by using the `pivot` function and passing the
row, column, and value names, such as `df.pivot(index='row_name',
columns='column_name', values='value_name')`.
50. How do you melt a DataFrame in Pandas?
Answer: You can melt a DataFrame in Pandas by using the `melt` function and passing the id
variables and value variables, such as `df.melt(id_vars=['id_var'], value_vars=['value_var'])`.
Rough](https://image.slidesharecdn.com/exploratoryanalyticsinpython-240509060245-a04ad8d7/85/Exploratory-Analytics-in-Python-provided-by-EY-pdf-103-320.jpg)


![[DSC Europe 25] Josip Saban - Career building for data professionals.pptx](https://cdn.slidesharecdn.com/ss_thumbnails/zroflcttkm1vmli0txea-josip-saban-career-building-for-data-professionals-260123083019-587cdb8c-thumbnail.jpg?width=640&height=640&fit=bounds)
![[DSC Europe 25] Raul Cruz Bonilla - Harnessing GEN AI in Fashion, Luxury and ...](https://cdn.slidesharecdn.com/ss_thumbnails/me7nvup5thwqzwzblbvw-raul-cruz-harnessing-ai-en-luxury-260123083019-32ac5a43-thumbnail.jpg?width=640&height=640&fit=bounds)


![[DSC Europe 25] Predrag Maletic - Scaling AI in Banking – Our Strategic Journ...](https://cdn.slidesharecdn.com/ss_thumbnails/qu2onv0aruwlvqtygmxx-predrag-maletic-scaling-ai-in-banking-260123083019-6cf1da1d-thumbnail.jpg?width=640&height=640&fit=bounds)