Downloaded 10 times
![The International Journal of Multimedia & Its Applications (IJMA) Vol.5, No.3, June 2013
DOI : 10.5121/ijma.2013.5301 1
EXPLOITING REFERENCE IMAGES IN EXPOSING
GEOMETRICAL DISTORTIONS
Rimba Whidiana Ciptasari1,2
and Kouichi Sakurai1
1
Department of Informatics, Kyushu University, Fukuoka, Japan
sakurai@inf.kyushu-u.ac.jp
2
Faculty of Informatics, Telkom Institute of Technology, Bandung, Indonesia
rimba@itslab.inf.kyushu-u.ac.jp
ABSTRACT
Nowadays, image alteration in the mainstream media has become common. The degree of manipulation is
facilitated by image editing software. In the past two decades the number indicating manipulation of
images rapidly grows. Hence, there are many outstanding images which have no provenance information
or certainty of authenticity. Therefore, constructing a scientific and automatic way for evaluating image
authenticity is an important task, which is the aim of this paper. In spite of having outstanding
performance, all the image forensics schemes developed so far have not provided verifiable information
about source of tampering. This paper aims to propose a different kind of scheme, by exploiting a group of
similar images, to verify the source of tampering. First, we define our definition with regard to tampered
image. The distinctive features are obtained by exploiting Scale- Invariant Feature Transform (SIFT)
technique. We then proposed clustering technique to identify the tampered region based on distinctive
keypoints. In contrast to k-means algorithm, our technique does not require the initialization of k value. The
experimental results over and beyond the dataset indicate the efficacy of our proposed scheme.
KEYWORDS
The trace transform, Geometrical transformation, Reference images, Clustering technique, Image
correlation
1. INTRODUCTION
1.1. Background
In general, the main purpose of computer forensics is the proper identification, extraction,
documentation, and interpretation of computer data to determine potential legal evidence. When
we bring this definition into the digital image forensic's point of view [1], recovering information
on the history of an image could be part of evidence collection. We need evidence to prove that
someone has manipulated the photograph. Among several types of evidence discussed by
Solomon et al. in [2], we observe that finding the traces of forgeries could fall into demonstrative
evidence. It exploits visual aids or other illustrations to give the explanation on some of the more
technical details of the evidence. Inspired by such evidence, identifying the source of tampering
grows to be our subject of interest.
1.2. Prior Work in Tampering Detection
When dealing with high-quality image forgery creation, numerous ways of image processing are
exploited. The image can be tampered at varying degrees by employing sophisticated editing
software, including changing the colour of object, blurring out the object, or changing on the
weather condition. Image splicing, one of the most common types of manipulation, involves](https://image.slidesharecdn.com/ijma050301-130712021001-phpapp02/75/EXPLOITING-REFERENCE-IMAGES-IN-EXPOSING-GEOMETRICAL-DISTORTIONS-1-2048.jpg)
![The International Journal of Multimedia & Its Applications (IJMA) Vol.5, No.3, June 2013
2
copying a certain small portion from an image and pasting onto another image. In order to
produce convinced tampering, geometrical transformations are often performed. It is
consequently, necessary to construct a scheme which is able to detect and expose such
transformed regions.
Researchers have devised various techniques, which can be classified into two main categories:
image as the source of tampering identification and image tampering classification.
1.2.1. Image as source of tampering
A number of sources of tampering identification schemes which belong to the duplicated region
have exhibited promising results. Ryu et al.[3] calculated the magnitude of Zernike moments of
overlapping pixel-blocks to produce rotated region feature vectors. The duplicated regions were
then detected by lexicographically sorting these feature vectors. However, scaled region
identification was not addressed in the paper. Li and Yu [4] proposed a scheme based on Fourier-
Mellin where significant rotation invariance was achieved by taking projection along radius
directions. Nevertheless, the scale invariance seems to be valid only over a small range. Solorio
and Nandi [5] employed log-polar block descriptors to detect rotated, scaled and reflected
regions. Nevertheless, the false alarms are introduced when the scheme is employed to images
containing large textured regions. Numerous schemes using scale-invariant feature transform
(SIFT) features have been proposed in [6][7][8] to handle various transformations. These features
are not robust to many post-processing operations such as blurring and flipping. Thus, Kakar and
Sudha [9] proposed feature's computation improvement, which is robust to such operations. The
scheme, however, seems to be robust only under affine transformations.
Apart from the issue of the duplicated region, detecting the traces of forgeries making use of
estimation-based approach has been developed. Popescu and Farid [10] exploited
expectation/maximization (EM) algorithm to detect re-sampling's lattice of the original image.
Unlike Popescu and Farid, Prasad and Ramakrishnan [11] have a propensity to investigate the
properties of a re-sampled discrete sequence and proposed deterministic techniques to detect re-
sampling. Ye et al. [12] investigated blocking artifacts introduced during JPEG compression. The
inconsistencies caused by compression could be used as evidence of image integrity.
1.2.2. Image tampering classification
Other approaches to detect tampered image are based on a machine learning framework. Farid
and Lyu [13] built a classification scheme to differentiate between natural image and tampered
image. Ng et al. [14] improved the performance of bicoherence features [15] to detect spliced
image. Avcibas et al. [16] constructed a classifier by employing image quality metrics as the
essential features. The rationale of using this metrics is to examine different quality aspects of an
image impacted during manipulations. Bayram et al. [17] exploited the feature correlations
between bit planes and binary texture characteristics within the bit planes. Chen et al.[18]
extracted the image features by calculating the moment of wavelet characteristics functions and
phase congruency. Dong et al. [19] analyzed the spliced artifact on image run-length
representation and edge statistics. Sutthiwan et al. [20] employed support vector machine (SVM)
to train image features as well. The image model is based on Markovian Rake Transform (MRT)
on image luminance.
1.3. Key Contribution
Regarding demonstrative evidence discussed in preceding section, both estimation-based and
machine learning-based approaches do not directly indicate the source of tampering. In case of
duplicated region detection, the tampered region is originally derived from the same image, and
the scheme is seemingly able to identify the distorted region. Apart from this issue, we are
moderately interested in analyzing the suspicious regions derived from other different images.](https://image.slidesharecdn.com/ijma050301-130712021001-phpapp02/75/EXPLOITING-REFERENCE-IMAGES-IN-EXPOSING-GEOMETRICAL-DISTORTIONS-2-2048.jpg)
![The International Journal of Multimedia & Its Applications (IJMA) Vol.5, No.3, June 2013
3
An outstanding and similar work involving grouping of images was recently proposed by Rosa et
al.[21]. They investigated on finding the dependencies among images representing the same real
scene, and then constructed a sort of graph describing on how these images have been generated
and how the information about the real scene contained in such images has changed. We highlight
two key points on their scheme. Firstly, their scheme focused on multi images rather than a single
image. In a certain case, it is difficult to employ their scheme to authenticate image validity.
Second, they did not involve the scenario that the image could be generated from two different
images as well as the image forgery scenario. Though we certainly concentrate on a single image,
we propose comparatively different scheme involving a group of similar images, in terms of
colour, texture, or shape, to the target image. The key contributions are highlighted as follows:
1) Non-blind recovery scheme (NBR-s). To the best our knowledge, our scheme to be the
first concrete technique towards appropriate tools which exploits a group of reference
images to identify the source of tampering. The resulting source of tampering could be
taken as evidence that some form of manipulation occurred.
2) Region extraction based on clustering algorithm. In previous work ([22][23]), the spliced
artifact identification relies on edge detection technique. Due to this condition, the images
which do not introduce any edges are hard to be detected, or might cause fault extraction.
The proposed approach introduces clustering algorithm to group the distinctive keypoints
with regard to the tampered region. Unlike k-means clustering, the algorithm
automatically produces the number of cluster during the process.
3) Complex dataset of tampered images. We construct a dataset to be used for tampering
detection consisting of 344 images employing various transformations. A realistic dataset
of alleged forgery images has been also considered for testing purposes.
The rest of the paper is structured as follows: in section 2, we give a mathematical formalization
of the concept of non-blind recovery scheme. In section 3, we describe the overall process of
geometric tampering detection and methods used in our scheme. Some experimental results
consider both synthesized images and realistic dataset are discussed in section 4. Finally section 5
concludes the paper with summary and a research direction.
2. PROBLEM FORMALIZATION
We begin with our definition on a suspected spliced-image formally defined as follows.
Definition 1 (suspected spliced-image).
Suppose there are n suspicious regions T= {t1, t2,…,tn} derived from a given image I, and m
reference images R={r1, r2,…,rm}. Assume that there exists at least one ti such that ti⊆rj for
i=1,…,n and j=1,…,m. Then, image I is said to be a suspected spliced-image.
Furthermore, given two set of gray-scale images ΙA which refers to authentic images and ΙT
represents tampered images, where an image I∈(ΙA∪ ΙT) is an M ×N matrix, whose entries are
integer values ∈ [0,255]. Suppose there exist a large image database ∆Β consisting of registered
authentic images defined as ∆Β={a1, a2, …, an}. An image is said to be authentic if it is directly
derived from image acquisition device or it has not undergone some image processing functions.
We consider an image retrieval system (IRS) Φf consisting of a set of properties ϕf characterizing
the IRS i.e. color, shape and texture properties. IRS is a system to retrieve images which is similar
to a user-defined specification or pattern. The IRS is described as Φf (.): I×ϕf× ∆Β→R, where
each element of images R ∈ ΙA and R is regarded as reference images.](https://image.slidesharecdn.com/ijma050301-130712021001-phpapp02/75/EXPLOITING-REFERENCE-IMAGES-IN-EXPOSING-GEOMETRICAL-DISTORTIONS-3-2048.jpg)
![The International Journal of Multimedia & Its Applications (IJMA) Vol.5, No.3, June 2013
5
Figure 1.The overall process of verification system architecture. The block denoted by ç
computes the correlation coefficient between suspicious region candidate(s) IS and its similar
regions RS.τ denotes the comparison of ç against the decision threshold.
The verification procedure is conducted as follows. To begin with, IRS is exploited to input
image I in order to obtain a group of similar images. The retrieved images are categorized based
on three properties, i.e. colour, texture, and moment. Despite the fact that the images have the
same properties, it is likely to have a completely different object of interest. Thus, the most
representative images are manually selected from these results as reference images R.
The first stage in our method is to find image keypoints and collect image features at the detected
keypoints on both target I and reference R. Our method is based on effective keypoint and feature
computation algorithm referred to as Scale Invariant Feature Transform (SIFT) [24]. At each
keypoint, a 128-dimensional featurevector is generated from the histograms of local gradientsin
its neighborhood. To guarantee the obtained feature vector invariant to rotation and scaling, the
size of the neighborhood is determined by the dominant scale of the keypoint, and all gradients
within are aligned with the keypoint’s dominant orientation[6] To provide the feature vector
invariant to local illumination changes, the obtained histograms are then normalized to unit
length. Afterward, the detected SIFT keypoints on I and R are matched based on their feature
vectors. We consider the suspicious region tends to emerge as a collection of adjacent keypoints.
Clustering is, therefore, performed on the matched keypoints to identify the suspicious region.
Furthermore, the system calculates the correlation coefficient ç between the corresponding
detected suspicious regions. To accept or reject whether the region is subjected to suspicious one,
ç is compared to a specific threshold τ.
3.1.1. Keypoint Clustering
Recall K={(kIi,kRj)} be the set of matched keypoints where kIi and kRj are keypoints located on
target and reference images, respectively. Note that they correspond with each other. Next,
matched keypoints clustering is accomplished to estimate the suspicious region. In contrast to k-
means algorithm, we propose a technique that requires no initial k value as the number of clusters.
Each cluster is represented by the centre of the cluster and the algorithm converges to
stable members of clusters. As clustering is not the main subject, we do not draw the
comparison to k-means algorithm. The clustering procedure is described as follows.
Input : The set of matched keypoints K={(kIi,kRj)}
The distance threshold r
Output : The pairs of selected regions (IS,RS)](https://image.slidesharecdn.com/ijma050301-130712021001-phpapp02/75/EXPLOITING-REFERENCE-IMAGES-IN-EXPOSING-GEOMETRICAL-DISTORTIONS-5-2048.jpg)
![The International Journal of Multimedia & Its Applications (IJMA) Vol.5, No.3, June 2013
6
Step 1. Initialization.
1: We begin with choosing an arbitrary point from K, and we select kI1 and kR1 as seed
points.
2: Assign each keypoints (kI,kR)∈K to the cluster with the nearest seed point. The basic idea
is to group element of K based on the distance up to r from current coefficient to the next
one (e.g. d(ki, ki+1), d(ki+1, ki+2), so on), and is formulated as follows.
D(k,r)={x∈X|d(k,x)≤r} (1)
where k is the set of SIFT keypoints, and r is an acceptable distance from ci to ci+1
determined experimentally. Consider k is the matched keypoint positioned at (x,y), the
squared Euclidian distance is adopted for this purpose denoted as follows:
݀ሺݍ, ݍିଵሻ = ඥሺݔ − ݔିଵሻଶ + ሺݕ − ݕିଵሻଶ. (2)
Step 2. Let CI and CR be the set of clusters located on target and reference image resulting from
step 1. Next step is to compute centroids of each cluster and distance of each keypoints
(kI,kR)∈K to these new centroids.
Step 3. Do re-clustering as described in step 1. The procedure is repeatedly carried out until the
algorithm converges to stable of cluster members.
3.1.2. Region Extraction
Recall CI and CR are the set of obtained clusters from the preceding subsection. The next step is
to process these clusters to obtain suspicious regions. We use two different block size, i.e. 16×16
and 32×32 pixels, and extract the region centered at each centroid cluster.
In order to properly verify the suspicious region, we compute the normalized cross-correlation
(NCC) formulated as
߫ሺ,ݑ ݒሻ =
∑ ൣ݂ሺ,ݔ ݕሻ − ݂̅௨,௩൧ሾݐሺݔ − ,ݑ ݕ − ݒሻ − ݐ̅ሿ௫,௬
ቄ∑ ൣ݂ሺ,ݔ ݕሻ − ݂̅௨,௩൧
ଶ
∑ ሾݐሺݔ − ,ݑ ݕ − ݒሻ − ݐ̅ሿଶ
௫,௬௫,௬ ቅ
.ହ
(3)
where f is the extracted region on reference image, ݐ̅ is the mean of the suspicious region on target
image, and ݂̅௨,௩ is the mean of f(x,y) in the region under the suspicious region. The correlation
coefficient is in the range [-1, 1], with larger value indicating higher level of similarity. ς close to
-1 means the matching entities are inverse of each other, ς close to 1 refers to matching entities
are exactly the same, and ς=0 is an indication of no relationship between the matching entities. To
accept or reject whether the extracted regions are regarded as suspicious ones, we compare the
correlation coefficient between them with a suitable threshold τ. Considering a lower value of τ
leads to better detection accuracy of suspicious regions, but may increase false positive rate. A
higher value of τ may yield regions that are strongly similar, but could miss detections of regions
having weak correlations. We set a default value of τ = 0.8 experimentally for a good trade-off
between detection accuracy and false detection rate.
3.1.3. Geometrical Distortions Estimation
It is required a method suited to construct features that are invariant and/or sensitive to geometric
transformation, e.g. rotation, translation, and scaling. We consider trace transform [25] that offers
the option to construct features from an image with desirable properties.
Let (IS,RS) be a pair of extracted region and its corresponding region located in either reference
images. A method to represent characteristics of region IS over RS decided by T(φ,p) is called the](https://image.slidesharecdn.com/ijma050301-130712021001-phpapp02/75/EXPLOITING-REFERENCE-IMAGES-IN-EXPOSING-GEOMETRICAL-DISTORTIONS-6-2048.jpg)
![The International Journal of Multimedia & Its Applications (IJMA) Vol.5, No.3, June 2013
7
trace transform as depicted in Figure 2. The trace transform T(φ,p) is computed by drawing lines
denoted by t parameterized by distance p (11 and 21 values from –p to p. Note that we evaluate
two types of block size, i.e. 16×16 and 32×32) and angle φ (240 values from 0 to 2π).
Figure 2. Trace transform parameters
Feature values for calculating the geometrical factors are conducted by computing triple features
which consist of trace function T, diametric function P, and circus function Φ over transformed
regions. In order to produce triple features, we compose combinations selectively from equations
in Table 1.
Table 1. Invariant and Sensitive Functional for Triple Feature Construction
IF2: (∫ |ξ(t)|q
dt)r
IF3: ∫ |ξ(t)|’ dt
IF4: ∫ (t - SF1 )2
ξ(t) dt
IF5: (IF4/IF1)1/2
IF9: Amplitude of 2nd harmonic of ξ(t)
IF10: Amplitude of 3rd harmonic of ξ(t)
SF1: ∫ξ(t) dt/IF1
SF5: phase of 2nd
harmonic of ξ(t)
SF6: phase of 3rd
harmonic of ξ(t)
SF7: phase of 4th
harmonic of ξ(t)
4. EVALUATION
To evaluate the effectiveness of our system, we have constructed a set of generated forgery
images with suspicious regions. Further, we present the experimental results and conduct the
comparison to the existing schemes.
As a basic assumption we suppose to work with image splicing only that is an image derived by
combining image portions from different images without further post-processing such as
smoothing of boundaries among different portions.
4.1. Dataset construction
Our scenario involves forgery images containing several suspicious regions derived from
different images. Distorted images are generated based on 55 images of size 128×128 provided by
DVMM laboratory [26]. Two types of geometric transformation are applied, i.e. rotation and
scaling. The selected region is rotated with a random angle θ∈ [00
, 3600
] and scale up/down with](https://image.slidesharecdn.com/ijma050301-130712021001-phpapp02/75/EXPLOITING-REFERENCE-IMAGES-IN-EXPOSING-GEOMETRICAL-DISTORTIONS-7-2048.jpg)
![The International Journal of Multimedia & Its Applications (IJMA) Vol.5, No.3, June 2013
8
a random factor s∈ [0.8, 1.0]. We use two different block sizes, i.e. 16×16 and 32×32, for each
type of distortion resulting in 344 distorted images. In addition, we exploit spliced images used in
[23] to evaluate the scheme effectiveness against non-geometrical transformations. Figure 3
depicts generated tampered images used in our experiments. The distorted images are constructed
in the following way:
i. For each authentic image, we first collect several arbitrary images with different scene.
ii. We randomly choose such a region(s) from those images in such a way that it looks
natural, copy the region(s), and paste onto the authentic one.
iii. The region is either rotated or scaled prior to pasting onto the authentic image.
Figure 3. Example of dataset used in the experiment. In the first row from left to right, the
tampered region is rotated by angle 91, 181, and 31 respectively. The second row, the tampered
region is scaled with factor 1.2, 1.4, and 0.8, respectively.
4.2. Clustering Results
One of the main contributions of this paper is related to the design of clustering algorithm aiming
at tampered region identification. The accurateness of our verification scheme relies on the
precision of suspicious region extraction. Our first experiment addresses the sensitivity of our
method on identifying the suspicious region.
Extraction performance was measured in terms of true positive rate (TPR) and false positive rate
(FPR) where TPR is the fraction of tampered images correctly identified as such, while FPR is the
fraction of original images that are not correctly identified:
ܴܶܲ =
# images detected as distorted being distorted
# distorted images
.
ܴܲܨ =
# images detected as distorted being original
# original images
.
Suspicious region extraction results obtained by employing the proposed clustering algorithm are
shown in Figure 4. To reduce the processing time, we exploit only three reference images related
to the input image. As stated earlier in Section 3.1, the reference images shown in Figure 4(b) are
manually selected from IRS. The clustering results depicted in Figure 4(c) confirm that the
adjacent keypoints representing the suspected region can be roughly grouped. There are several
corresponding pairs of extracted regions obtained from a clustering process. As we expect that
extracted region shown in the first row of Figure 4(e) indicates the correlation above the
threshold that is 0.8174. Other pairs demonstrate correlation values below the threshold. Thus we
may conclude that the given image in Figure 4(a) contains another image’s sub-region. In other
words, regarding Definition 1 the image is deemed as the tampered one.](https://image.slidesharecdn.com/ijma050301-130712021001-phpapp02/75/EXPLOITING-REFERENCE-IMAGES-IN-EXPOSING-GEOMETRICAL-DISTORTIONS-8-2048.jpg)
![The International Journal of Multimedia & Its Applications (IJMA) Vol.5, No.3, June
(a)
(c)
Figure 4. Tampered region identification using the proposed clustering technique. (a) An example
of image in question. (b) Samples of reference images related to image (a). (c)
clustering results on both reference
correspond to each reference image
Table 2 reports the diagnostic parameters dealing with suspicious region extraction. In terms of
rotation, for block size of 16×16 and 32
FPR around 11%. Similarly, in case of scaling the proposed method attain
90.97% on average with FPR around
approach indicates an improvement on detection accuracy
Table 2. TPR and FPR values (in percentage) for rotation and scaling with respect to suspiciou
Rotation
16×16 32×32
TPR (%) 88,75 88
FPR (%) 10 11,25
4.3. Tampering Detection P
To demonstrate the efficacy of the proposed approach,
distortions is included for completeness and to experimentally show that a clustering step is
fundamental to obtain satisfactory
whether the image has undergone some geometrical distortions, i.e. the localization of the image
regions that have been modified for malicious purposes.
To estimate the geometrical parameters
combinations and experimentally choice the appropriate ones as listed in
scaling factor between two images, we need to calculate a certain triple feature for the
and take the ratio of these values
finding the difference between the values of a triple feature calculated for two versions
same image that are rotated with respect to each other
The International Journal of Multimedia & Its Applications (IJMA) Vol.5, No.3, June
(b)
(d) (e)
region identification using the proposed clustering technique. (a) An example
of image in question. (b) Samples of reference images related to image (a). (c) Corresponding
reference and input images. (d) – (e) Region extraction results that
correspond to each reference image, respectively.
the diagnostic parameters dealing with suspicious region extraction. In terms of
16 and 32×32, our method achieves TPR greater than 88%, with
Similarly, in case of scaling the proposed method attain TPR approximately
n average with FPR around 15%. Compared to previous work in [23]
indicates an improvement on detection accuracy increased by 0, 57%.
. TPR and FPR values (in percentage) for rotation and scaling with respect to suspiciou
region extraction
Scaling
Non-geometric
Non-geometric
Ciptasari et16×16 32×32
94,4 87,5 95,32 92,08
28 3,7 1,81 2,22
ampering Detection Performance
To demonstrate the efficacy of the proposed approach, tampering detection caused by geometrical
distortions is included for completeness and to experimentally show that a clustering step is
fundamental to obtain satisfactory results. The final step of the proposed approach is to verify
whether the image has undergone some geometrical distortions, i.e. the localization of the image
regions that have been modified for malicious purposes.
To estimate the geometrical parameters, we evaluate approximately 25 triple feature
combinations and experimentally choice the appropriate ones as listed in Table 3. To recover the
scaling factor between two images, we need to calculate a certain triple feature for the
and take the ratio of these values [25]. In addition, the rotation angle is identified by simply
finding the difference between the values of a triple feature calculated for two versions
same image that are rotated with respect to each other[25]. We adopt these techniques by
The International Journal of Multimedia & Its Applications (IJMA) Vol.5, No.3, June 2013
9
(f)
region identification using the proposed clustering technique. (a) An example
Corresponding
(e) Region extraction results that
the diagnostic parameters dealing with suspicious region extraction. In terms of
32, our method achieves TPR greater than 88%, with
TPR approximately
the proposed
. TPR and FPR values (in percentage) for rotation and scaling with respect to suspicious
geometric
Ciptasari et al.[23]
92,08
2,22
tampering detection caused by geometrical
distortions is included for completeness and to experimentally show that a clustering step is
The final step of the proposed approach is to verify
whether the image has undergone some geometrical distortions, i.e. the localization of the image
we evaluate approximately 25 triple feature
. To recover the
scaling factor between two images, we need to calculate a certain triple feature for the two images
In addition, the rotation angle is identified by simply
finding the difference between the values of a triple feature calculated for two versions of the
We adopt these techniques by](https://image.slidesharecdn.com/ijma050301-130712021001-phpapp02/75/EXPLOITING-REFERENCE-IMAGES-IN-EXPOSING-GEOMETRICAL-DISTORTIONS-9-2048.jpg)
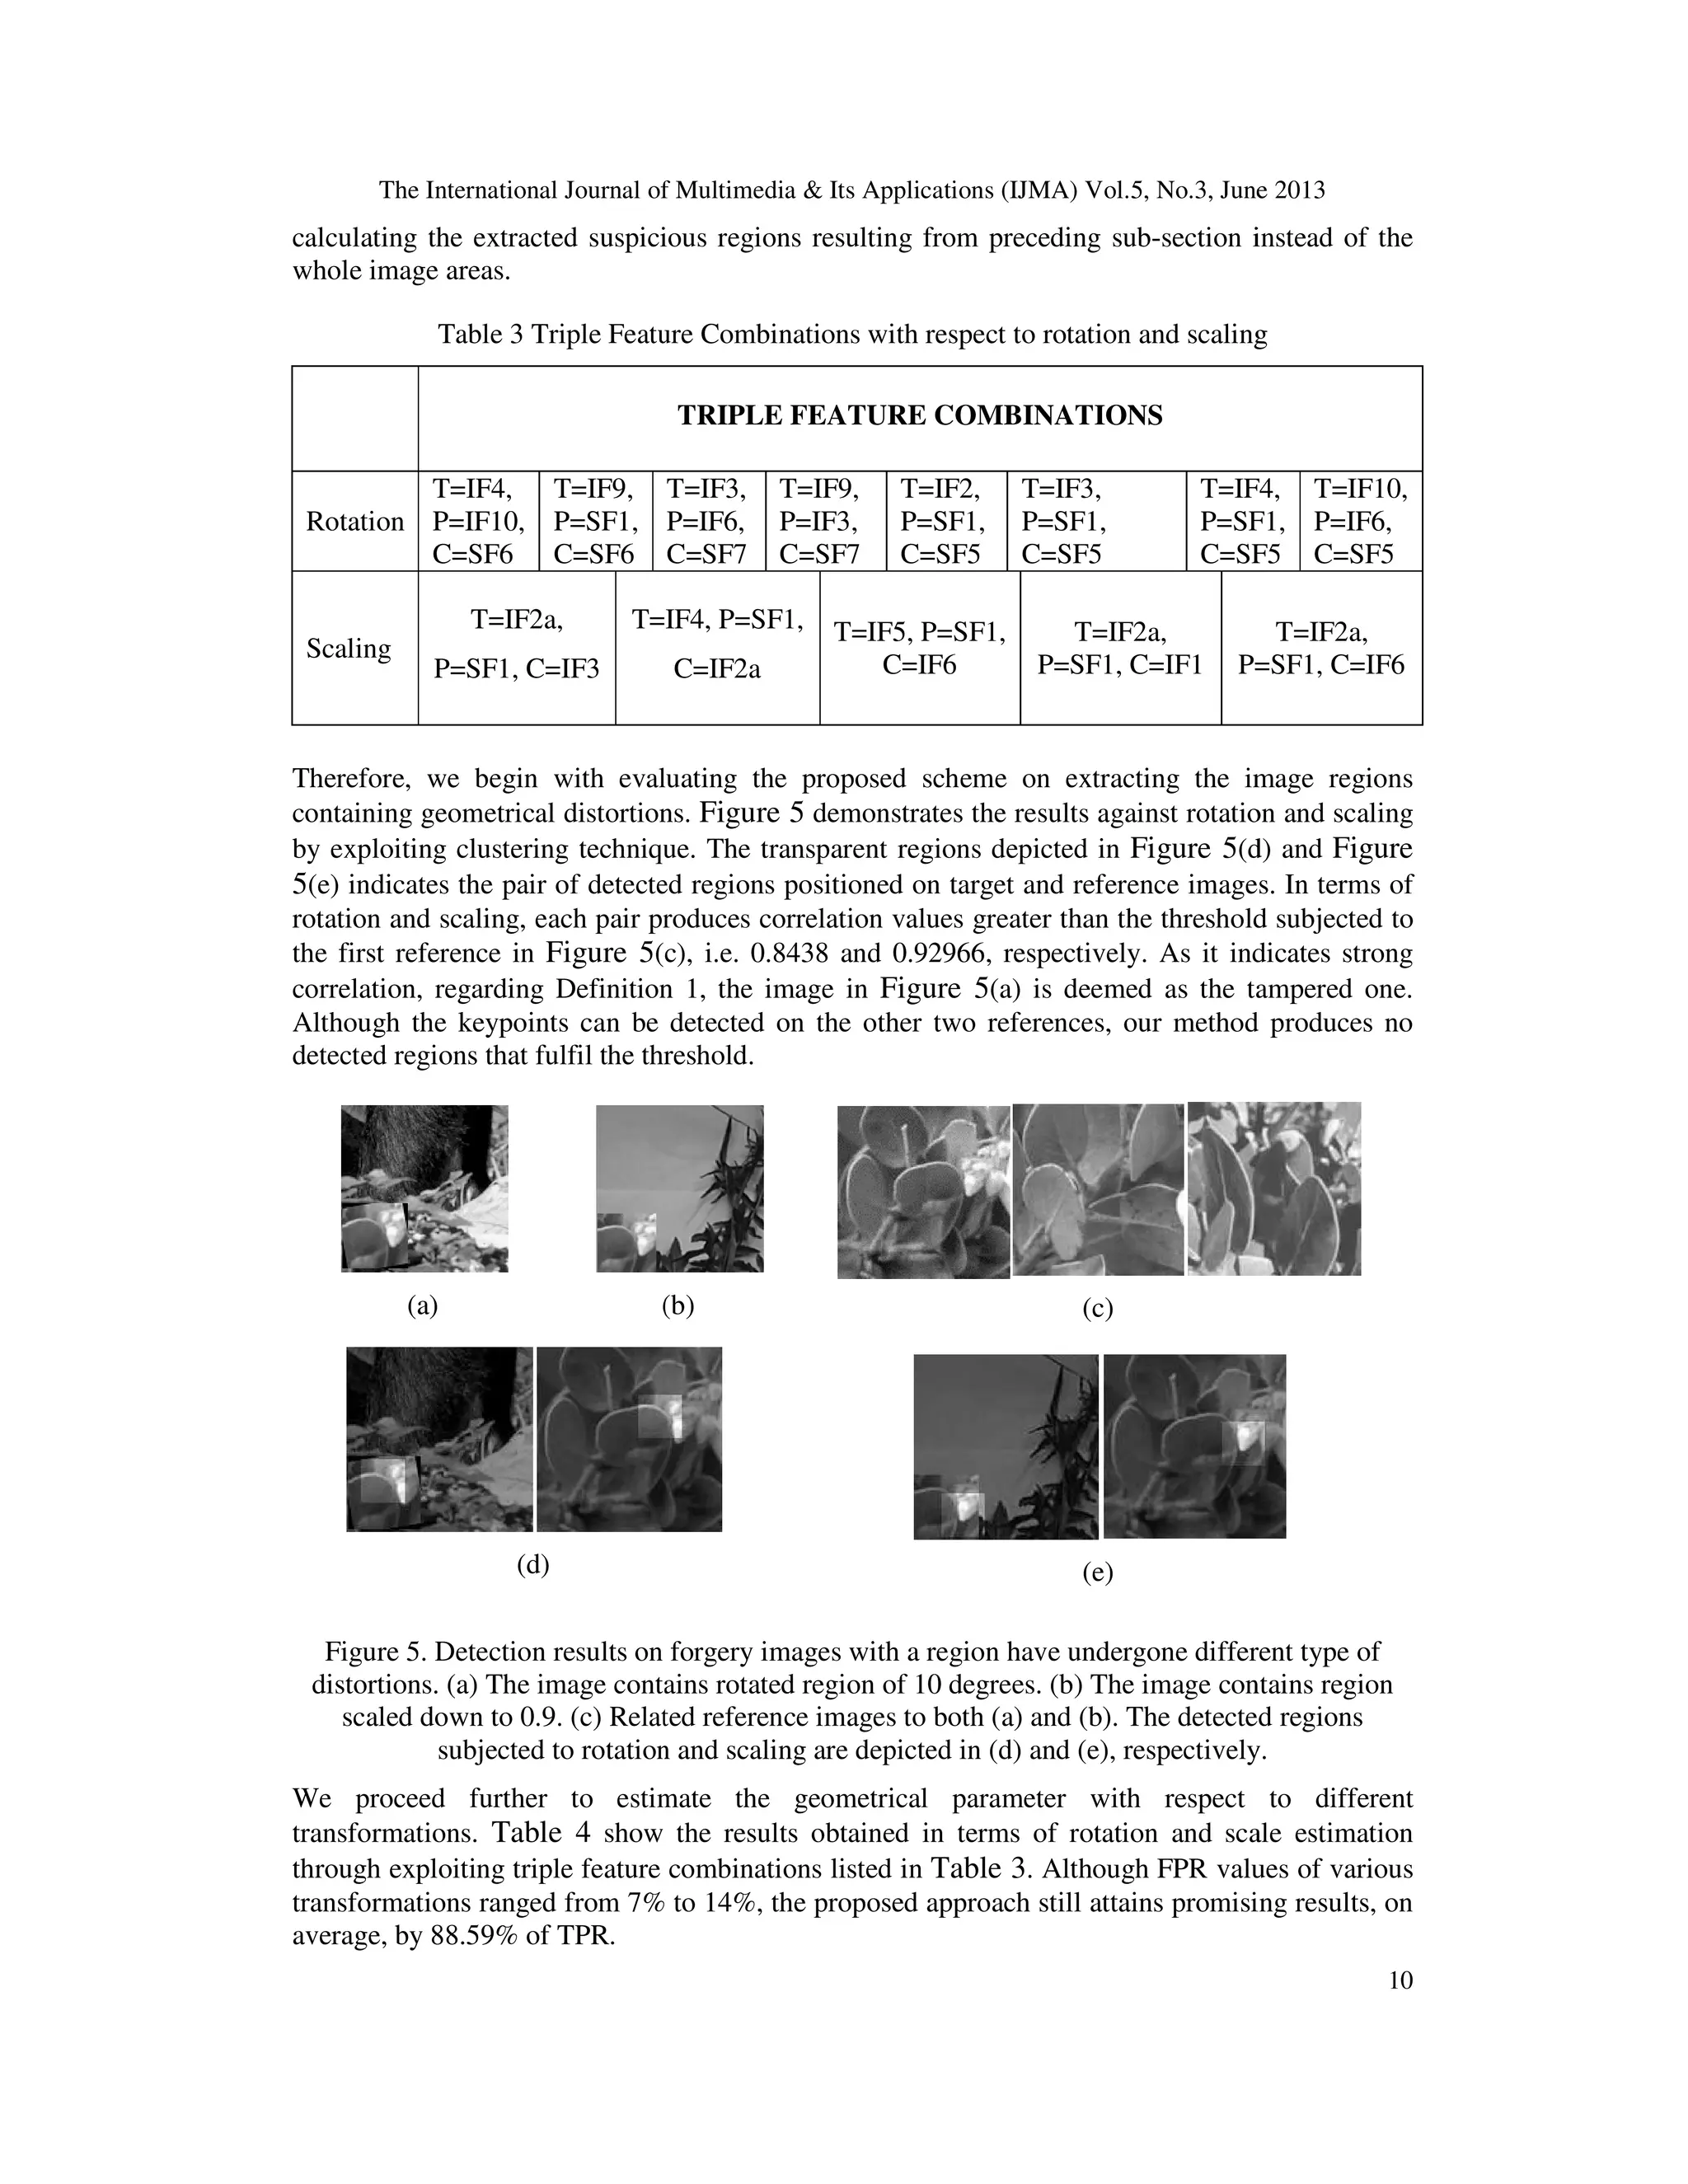
![The International Journal of Multimedia & Its Applications (IJMA) Vol.5, No.3, June 2013
11
Table 4 TPR and FPR values (in percentage) for rotation and scaling with respect to geometrical
parameter estimation
Rotation Scaling
16×16 32×32 16×16 32×32
TPR (%) 83.64 90.91 94.12 85.71
FPR (%) 14.28 11.11 14.29 7.69
Table 5. Average Estimation Error
Rotation Scaling
Battiato et al.[7] 1.4762 0.04645
Ciptasari et al. [23] − −
Proposed approach 1.0961 0.0433
Further, to verify the effectiveness of the proposed scheme, we draw the comparison to
approaches introduced in [7] and [23]. In contrast to our subject, Battiato et al. [7] principally
addressed duplicated region, while the work in [23] did not involve geometric transformation.
Therefore, the comparison is conducted in terms of mean absolute error (MAE) values. The
results are reported in Table 5. It confirms that the proposed approach obtains a considerable
gain both in terms of rotational and scaling accuracy.
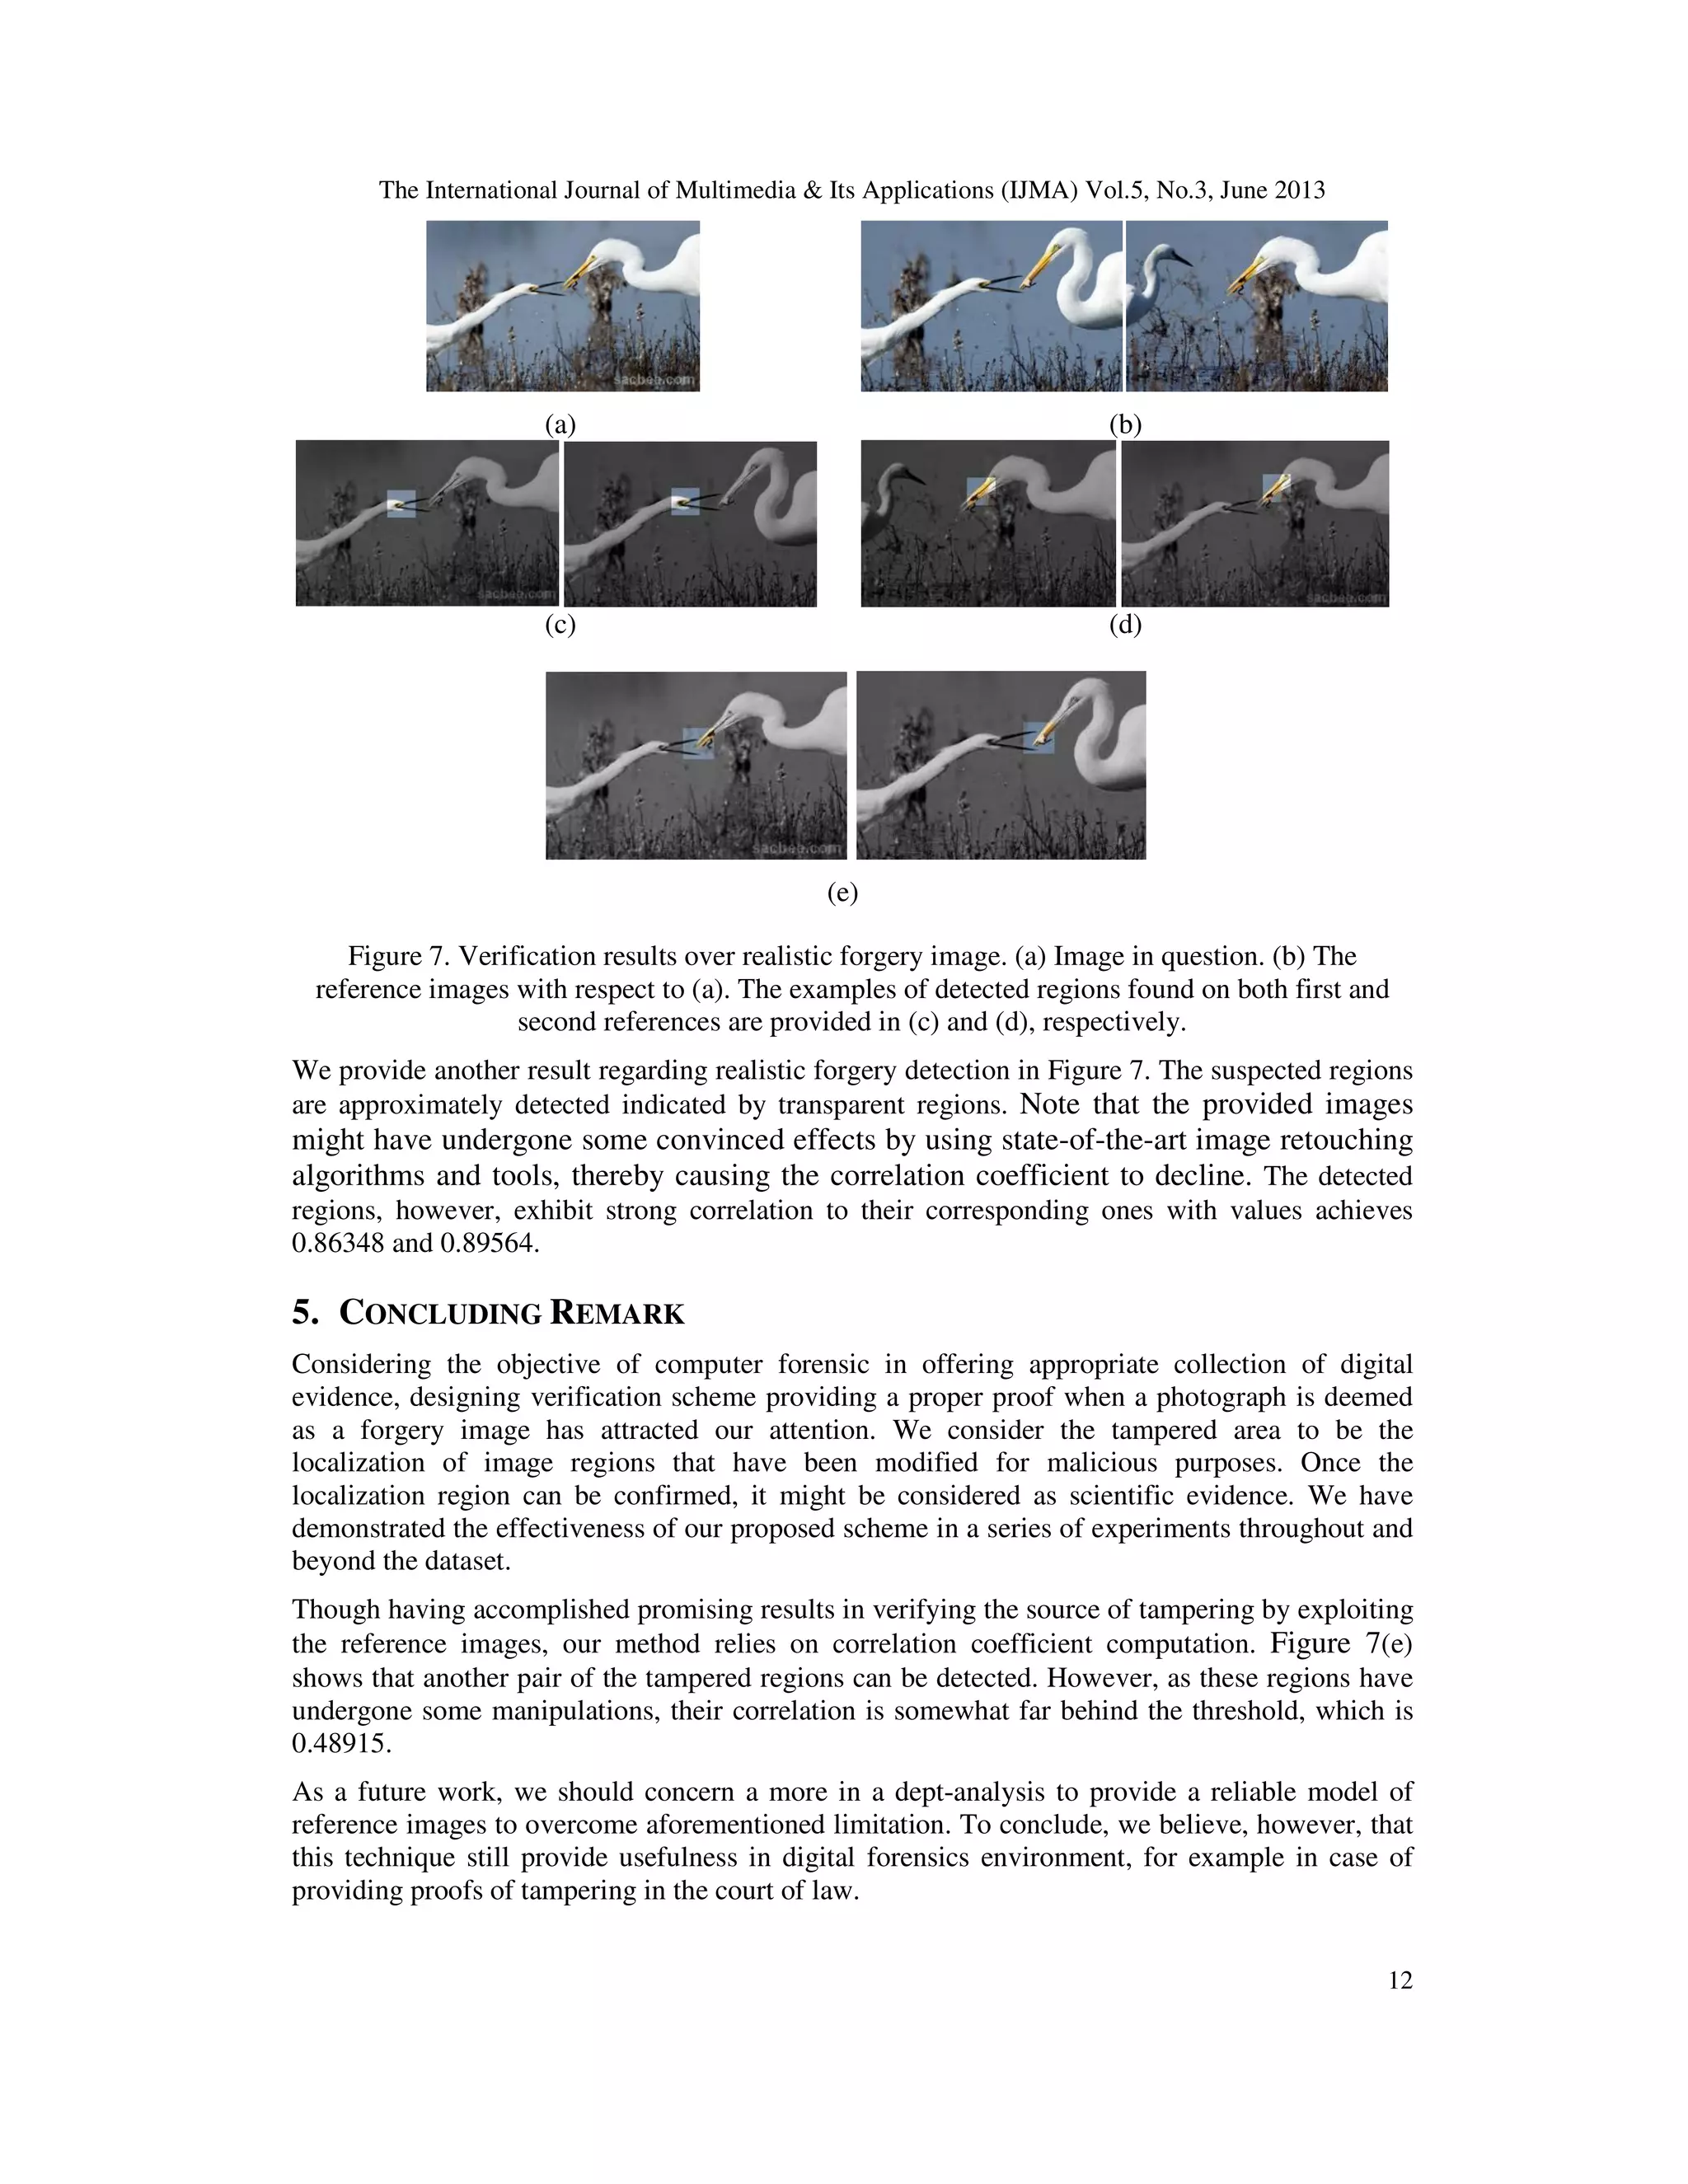
4.4. Realistic detection
To demonstrate the effectiveness of the proposed scheme from practical point of view, we
conduct evaluation against alleged forgery images that has raised public's attention provided by
Fourandsix Technologies, Inc [27]. In this section, we highlight our improvement over the
scheme proposed in [23]. The improvement result is illustrated in Figure 6. We may confirm that
the proposed work precisely extracts the suspected region depicted in Figure 6(d) compared to an
extracted region shown in Figure 6(c). It shows that the localized region has undergone
geometrical transformation for a malicious purpose.
(a) (b) (c) (d)
Figure 6. Improvement result over the previous work in [23] (a) Image in question. (b) A
reference image that corresponds to (a). The previous result is depicted in (c), and the
improvement detected regions are shown in (d).](https://image.slidesharecdn.com/ijma050301-130712021001-phpapp02/75/EXPLOITING-REFERENCE-IMAGES-IN-EXPOSING-GEOMETRICAL-DISTORTIONS-11-2048.jpg)
![The International Journal of Multimedia & Its Applications (IJMA) Vol.5, No.3, June 2013
13
ACKNOWLEDGEMENTS
Research support for the first author is provided by the Directorate General of Higher Education,
Ministry of National Education, Indonesia.
REFERENCES
[1] Redi J.A., Taktak W., Dugelay J.L. (2011) “Digital image forensics: a booklet for beginners”,
Multimedia Tools and Application, Vol. 51, pp.133-162.
[2] Solomon M.G., Barret D., Broom N.(2005) 'Computer Forensics: Jumpstarts', pp.51 - 57. SYBEX
Inc., California
[3] Ryu S.J., Lee M.J., Lee H.K. (2010) “Detection of Copy-Rotate-Move Forgery Using Zernike
Moments”. In: Information Hiding Lecture Notes in Computer Science, Volume 6387, pp. 51-65
[4] Li W., Yu N.(2010) “Rotation robust detection of copy-move forgery”,17th IEEE International
Conference on Image Processing (ICIP), pp. 2113 - 2116.
[5] Solorio S.B., Nandi A.K.(2011) “Automated detection and localisation of duplicated regions affected
by reflection, rotation and scaling in image forensics”, Signal Processing, Elsevier, pp.1759-1770.
[6] Pan X., Lyu S.(2010) “Region Duplication Detection using Image Feature Matching”, IEEE
Transaction on Information Forensics and Security, 5(4):857-867.
[7] Battiato S., Farinella G.M., Messina E., Puglisi G.(2012) “Robust Image Alignment for Tampering
Detection”, IEEE transaction on Information Forensics and Security, volume 7, issue 4, pp. 1105 -
1117.
[8] Amerini I, Ballan L, Caldelli R, Del Bimbo A, Serra G.(2011) “A SIFT-Based Forensic Method for
Copy-Move Attack Detection and Transformation Recovery”, IEEE transaction on Information
Forensics and Security, Volume 6, issue 3, pp. 1099 -1110.
[9] Kakar P., Sudha N.(2012) “Exposing Postprocessed Copy-Paste Forgeries through Transform-
Invariant Features”, IEEE Transaction on Information Forensics and Security, Vol.7 Issue 3, pp.1018-
1028.
[10] Popescu A.C., Farid H.(2005) “Exposing Digital Forgeries by Detecting Traces of Re-sampling”,
IEEE Transaction on Signal Processing, 53(2):758-767.
[11] Prasad S., Ramakrishnan K.R.(2006) “On Resampling Detection And Its Application To Detect
Image Tampering”, IEEE International Conference on Multimedia and Expo (ICME).
[12] Ye S., Sun Q., Chang E.C.(2007) “Detecting Digital Image Forgeries by Measuring Inconsistencies of
Blocking Artifact”, IEEE International Conference on Multimedia and Expo (ICME)
[13] Farid H., Lyu S.(2003) “Higher-order Wavelet Statistics and their Application to Digital Forensics”,
IEEE Workshop on Statistical Analysis in Computer Vision (in conjunction with CVPR).
[14] Ng T.T., Chang S.F., Sun Q.(2004) “Blind Detection of Photomontage using Higher Order Statistics”,
IEEE International Symposium on Circuits and Systems, vol. 5, pp. 688 - 691.
[15] Farid H.(1999)“Detecting Digital Forgeries Using Bispectral Analysis”, Technical Report AIM-1657,
AI Lab, Massachusetts Institute of Technology.
[16] Avcibas I., Bayram S., Memon N., Sankur B., Ramkumar M.(2004) “A Classifier Design for
Detecting Image Manipulations”, IEEE International Conference on Image Processing (ICIP).
[17] Bayram S., Avcibas I., Sankur B., Memon N.(2006) “Image Manipulation Detection”, Journal of
Electronic Imaging, SPIE and IST, 15(4), 041102.
[18] Chen W., Shi Y.Q., Su W.(2007) “Image Splicing Detection using 2-D Phase Congruency and
Statistical Moments of Characteristic Function”, Society of Photo-Optical Instrumentation Engineers
(SPIE) Conference Series, vol. 6505, art. No. 65050R. SPIE, Washington.
[19] Dong J., Wang W., Tan T., Shi Y.Q.(2009) “Run-Length and Edge Statistics Based Approach for
Image Splicing Detection”, International Workshop on Digital Watermarking (IWDW), LNCS 5450,
pp. 76-87.
[20] Sutthiwan P., Shi Y.Q., Zhao H., Ng T.T., Su W.(2011) “Markovian Rake Transform for Digital
Image Tampering Detection”, Y.Q.Shi (Ed.): Transaction on DHMS VI, LNCS 6730, pp. 1-17.
Springer, Heidelberg.
[21] Rosa A.D., Uccheddu F., Costanzo A., Piva A., Barni M.(2010) “Exploring Image Dependencies: a
New Challenge in Image Forensics”, Media Forensics and Security II, edited by Nasir D.Memon,
Jana Dittman, Adnan M. Alattar, Edward J. Delp III, Proceeding of SPIE-IS&T Electronic Imaging,
SPIE, Vol. 7541, 75410X.](https://image.slidesharecdn.com/ijma050301-130712021001-phpapp02/75/EXPLOITING-REFERENCE-IMAGES-IN-EXPOSING-GEOMETRICAL-DISTORTIONS-13-2048.jpg)
![The International Journal of Multimedia & Its Applications (IJMA) Vol.5, No.3, June 2013
14
[22] Ciptasari R.W., Rhee K.H., Sakurai K.(2012) “An Image Splicing Detection based on Interpolation
Analysis”, W. Lin, D. Xu, A. Ho, J. Wu, Y. He, J. Cai, M. Kankanhalli, M.-T. Sun,Editors. Pacific-
Rim Conference on Multimedia (PCM 2012), LNCS 7674, pp.390-401, Springer, Heidelberg.
[23] Ciptasari R.W., Rhee K.H., Sakurai K.(2013) “Image Splicing Verification based on Pixel-based
Alignment Method”, The 11th International Workshop on Digital-forensics and Watermarking
(IWDW 2012), LNCS 7809, pp. 198-212, Springer, Heidelberg.
[24] D.G. Lowe, (2004) “Distinctive image features from scale-invariant keypoints”, Int. J. Computer
Vision, vol. 60, no. 2, pp. 91 – 110
[25] Kadyrov A., Petrou M.(2001) “The trace transform and its applications”, IEEE Transaction on Pattern
Analysis and Machine Intelligence, vol. 23, no. 8, pp. 811-828.
[26] Ng, T.T., Chang, S., Sun, Q.(2004) “A data set of authentic and spliced image blocks”, ADVENT
Technical Report 203-2004-3, Columbia University , http://www.ee.columbia.edu/trustfoto.
[27] Fourandsix Technologies, Inc. http://www.fourandsix.com/photo-tampering-history/.
Authors
Rimba Whidiana Ciptasari received her M.Eng degree in software engineering from
Bandung Institute of Technology (ITB), Indonesia, in 2005. She is currently pursuing
Ph.D degree in Graduate School of Information Science and Electrical Engineering,
Department of Informatics, Information Technology and Multimedia Security Laboratory,
Kyushu University. She is also a faculty member at Telkom Institute of Technology,
Indonesia. Her research interest includes information hiding, image processing, and
multimedia security.
Kouichi Sakurai is Professor of Department of Computer Science and Communication
Engineering, Kyushu University, Japan since 2002. He received B.E., M.E., and D.E. of
Mathematics, Applied Mathematics and Computer Science from Kyushu University in
1982, 1986, and 1993, respectively. He is interested in cryptography and information
security. He is a member of IPSJ, IEEE and ACM.](https://image.slidesharecdn.com/ijma050301-130712021001-phpapp02/75/EXPLOITING-REFERENCE-IMAGES-IN-EXPOSING-GEOMETRICAL-DISTORTIONS-14-2048.jpg)

The paper proposes a novel scheme for identifying the source of image tampering by using a group of similar reference images, leveraging the Scale-Invariant Feature Transform (SIFT) technique for detecting unique keypoints. It suggests a clustering approach that automatically determines the number of clusters without requiring prior initialization, aiming to enhance tampering detection accuracy. The method is validated through experimental results on a dataset containing various transformations, highlighting its effectiveness in distinguishing between authentic and tampered regions.


![gina cv 2016[1]](https://cdn.slidesharecdn.com/ss_thumbnails/c8f12674-4333-45f6-aeef-c05ffe29f5f8-160914224803-thumbnail.jpg?width=640&height=640&fit=bounds)


![[BDD 2025 - Mobile Development] Exploring Apple’s On-Device FoundationModels](https://cdn.slidesharecdn.com/ss_thumbnails/md-exploringappleson-devicefoundationmodels-251124030840-d690542c-thumbnail.jpg?width=640&height=640&fit=bounds)
![[BDD 2025 - Full-Stack Development] The Modern Stack: Building Web & AI Appli...](https://cdn.slidesharecdn.com/ss_thumbnails/fs-themodernstackbuildingwebaiapplicationswithserverless-251124030844-388cf04f-thumbnail.jpg?width=640&height=640&fit=bounds)
![[BDD 2025 - Mobile Development] Crafting Immersive UI with E2E and AGSL Shade...](https://cdn.slidesharecdn.com/ss_thumbnails/md-craftingimmersiveuiwithe2eandagslshaderveronicaputrianggraini-251124030840-0c677f44-thumbnail.jpg?width=640&height=640&fit=bounds)


![[BDD 2025 - Full-Stack Development] Digital Accessibility: Why Developers nee...](https://cdn.slidesharecdn.com/ss_thumbnails/fs-digitalaccessibilitywhydevelopersneedtoknowandcarein2025-251127011019-0674441d-thumbnail.jpg?width=640&height=640&fit=bounds)
