Downloaded 44 times


![© BPI10
©BPIgroup
About Executive Outplacement Services
EXECUTIVE EMPLOYMENT TRENDS REPORT Q3 2016
BPI group offers a local boutique touch with a global network of resources
to ensure long-term career success for our executive outplacement clients.
In addition to job search coaching, clients may also choose to focus on
entrepreneurial ventures, preparing for retirement, or other work
alternatives.
Each client works with a personal career coach to develop a customized,
winning services plan, helping them to:
• Focus on developing the next step in their career, leveraging assessment
tools and professional consulting to establish short and long-term career
direction.
• Learn how to effectively job search and thrive in the new world of
work.
• Search for the next opportunity, be it a new job, a business acquisition
or start-up, or a part-time career.
• Connect to high-quality job opportunities, through technology, a team
of job developers, social networks, in-person networking events,
personal introductions, and direct placement activities.
• Succeed in their new role, by developing a 90-day onboarding plan.
Interested in learning more?
Call +1.800.323.0206.
My coach provided a sounding board, someone I could vent to,
support, compassion, and most importantly, sound, pragmatic
suggestions and solutions...[my coach] is simply the best.
- Gary, landed as Chief Executive Officer
at an energy service solutions company
A weekly session with my coach was a great shot in the arm, as
he provided me with useful guidance, support, and an
opportunity to laugh while reminding me that I’m on the right
track…I couldn’t be more pleased with the professional and
personal support I received from BPI group. I felt very fortunate
when I compared notes with colleagues of mine who did not work
with BPI group.
- Matthew, landed as Vice President of Marketing
with a manufacturing holding company](https://image.slidesharecdn.com/executiveemploymenttrendsq32016-160812170144/85/Executive-Employment-Trends-Report-Q3-2016-10-320.jpg)

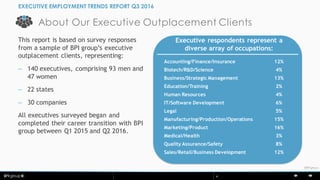
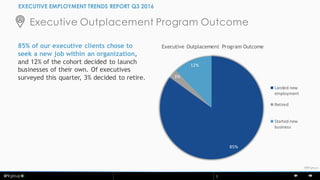
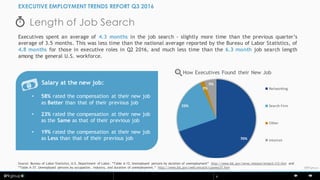
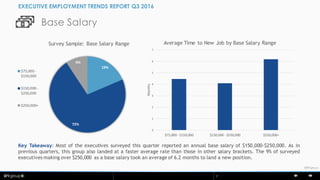
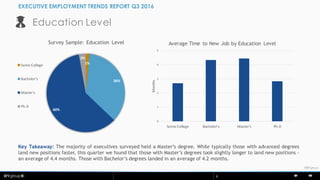
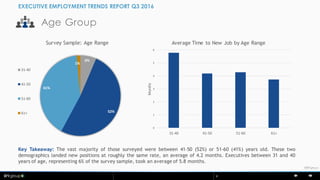
The executive employment trends report by BPI Group analyzes the job search experiences of executives to improve their outplacement services, highlighting that clients found new positions in an average of 4.3 months, significantly less than national averages. The report shows that 85% of clients pursued new jobs, with many reporting improved compensation packages at their new roles. Key factors influencing job search length included salary level, education, and age, with most survey respondents holding master's degrees and aged between 41-60.


