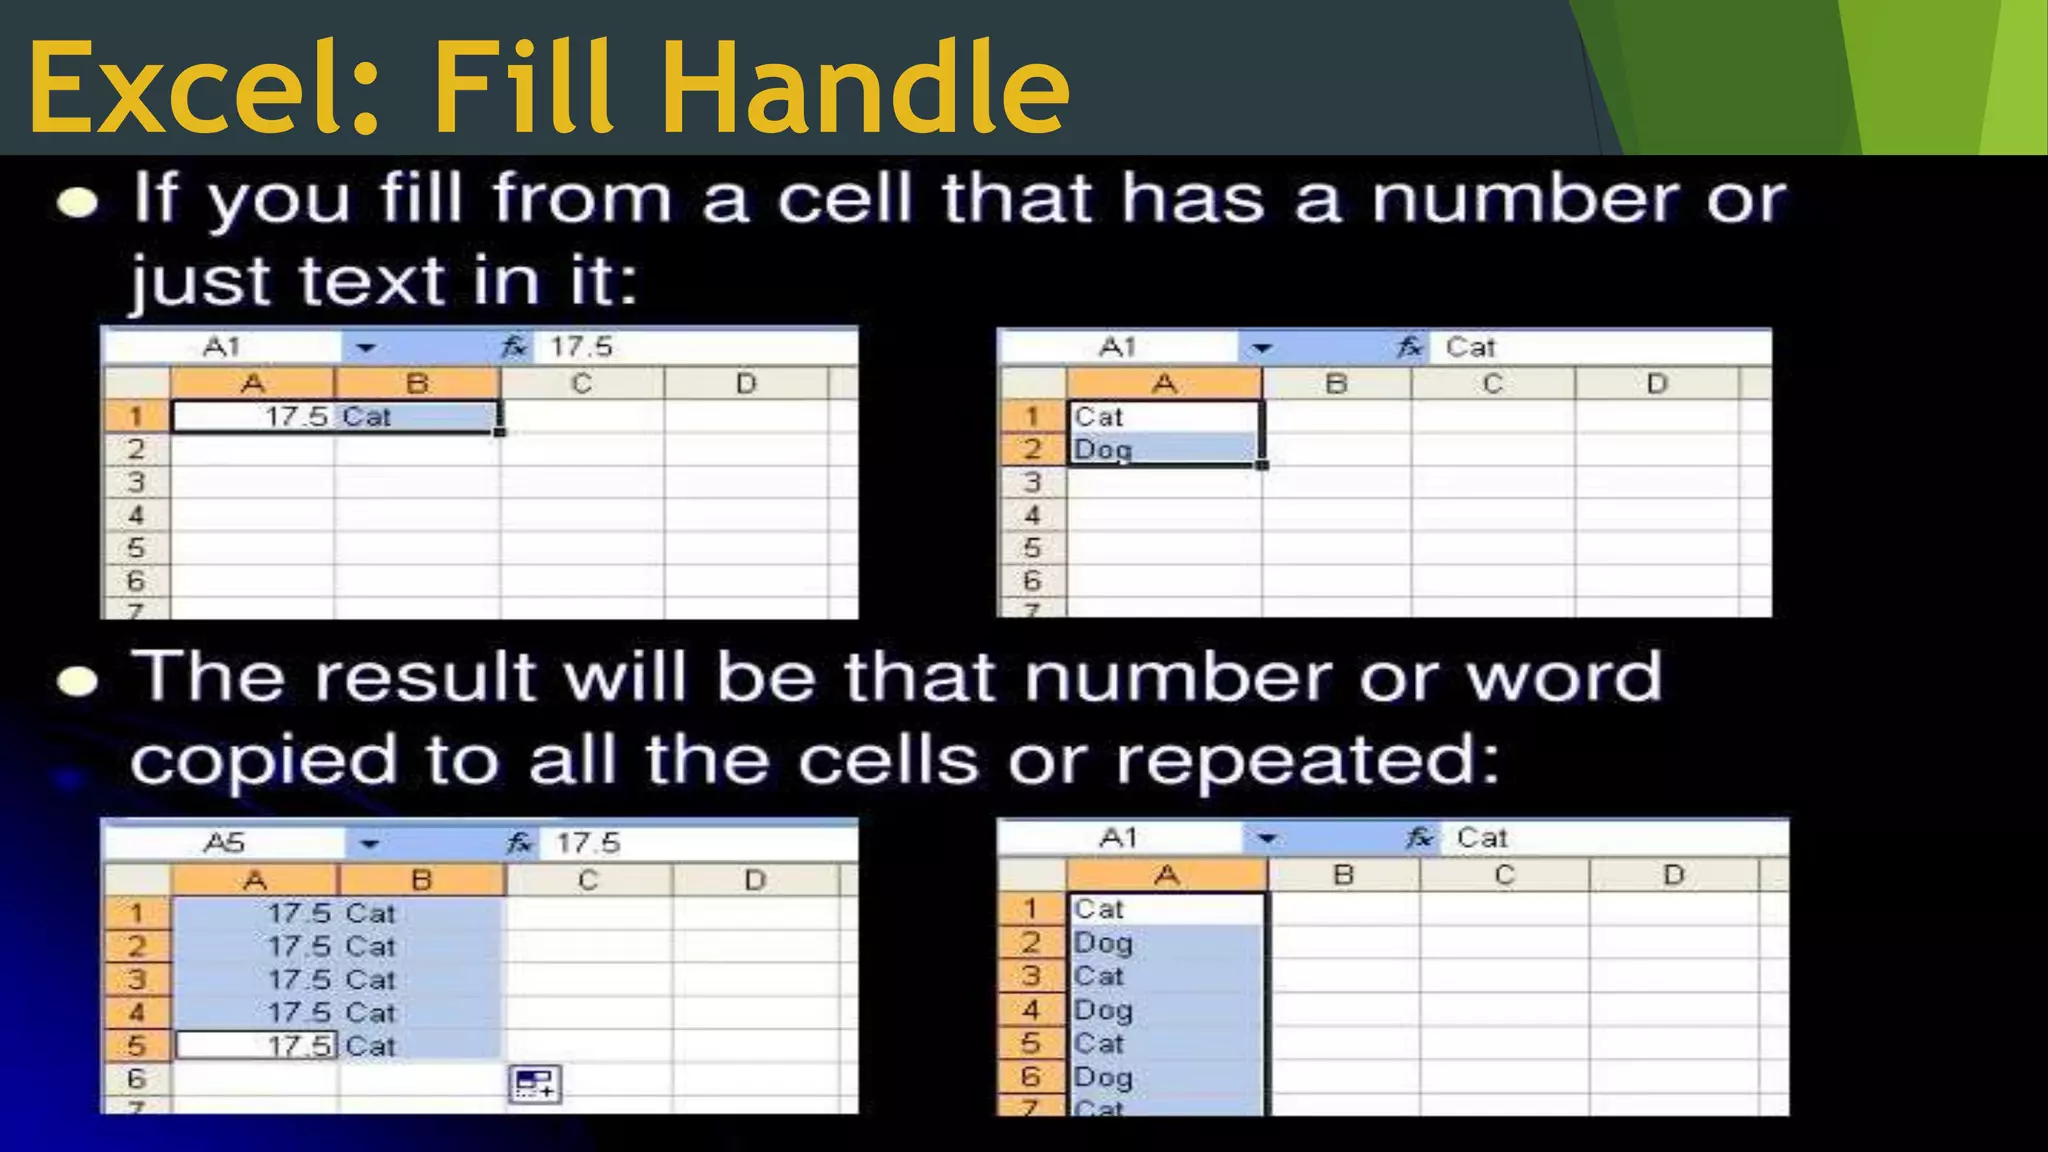
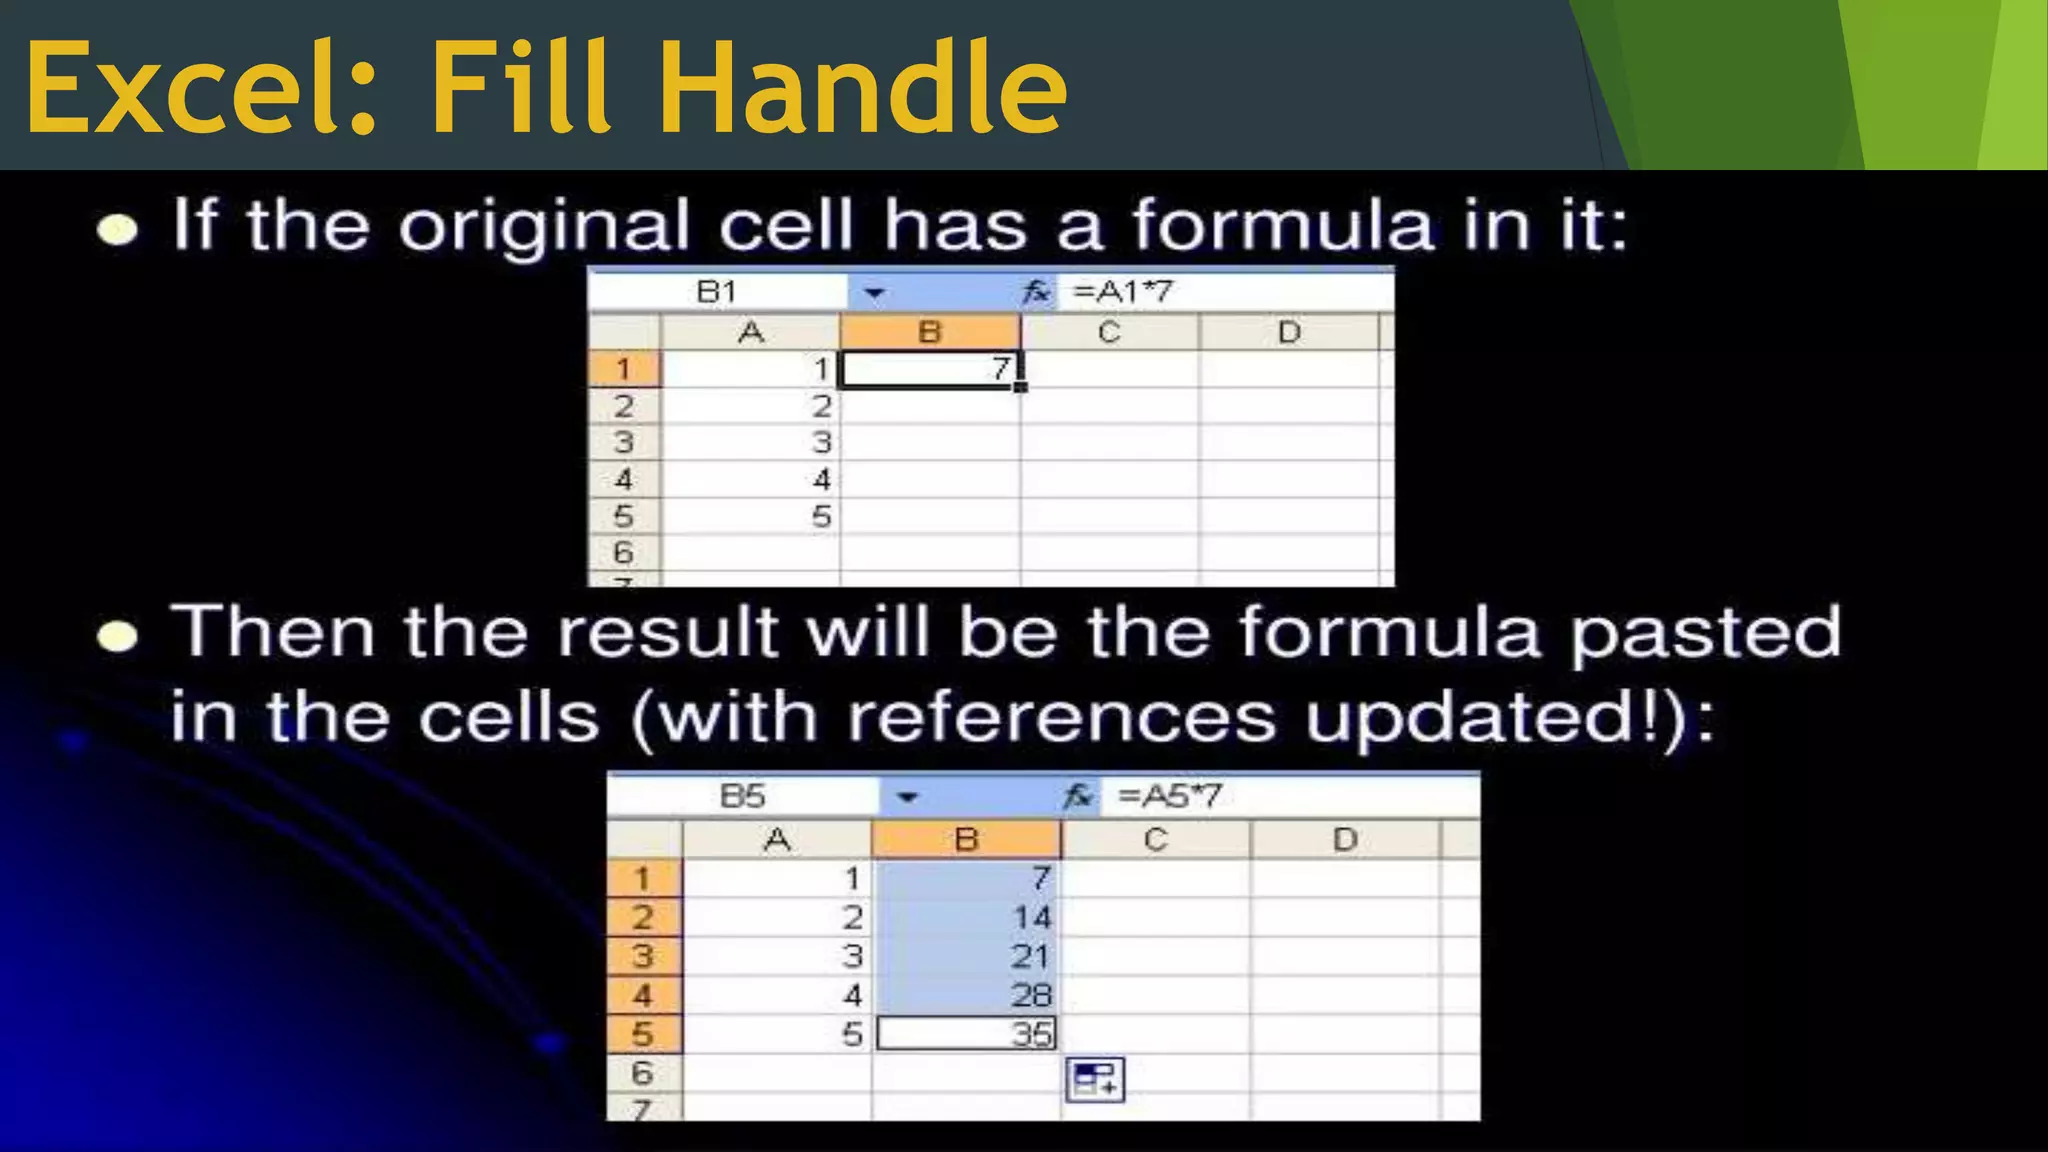
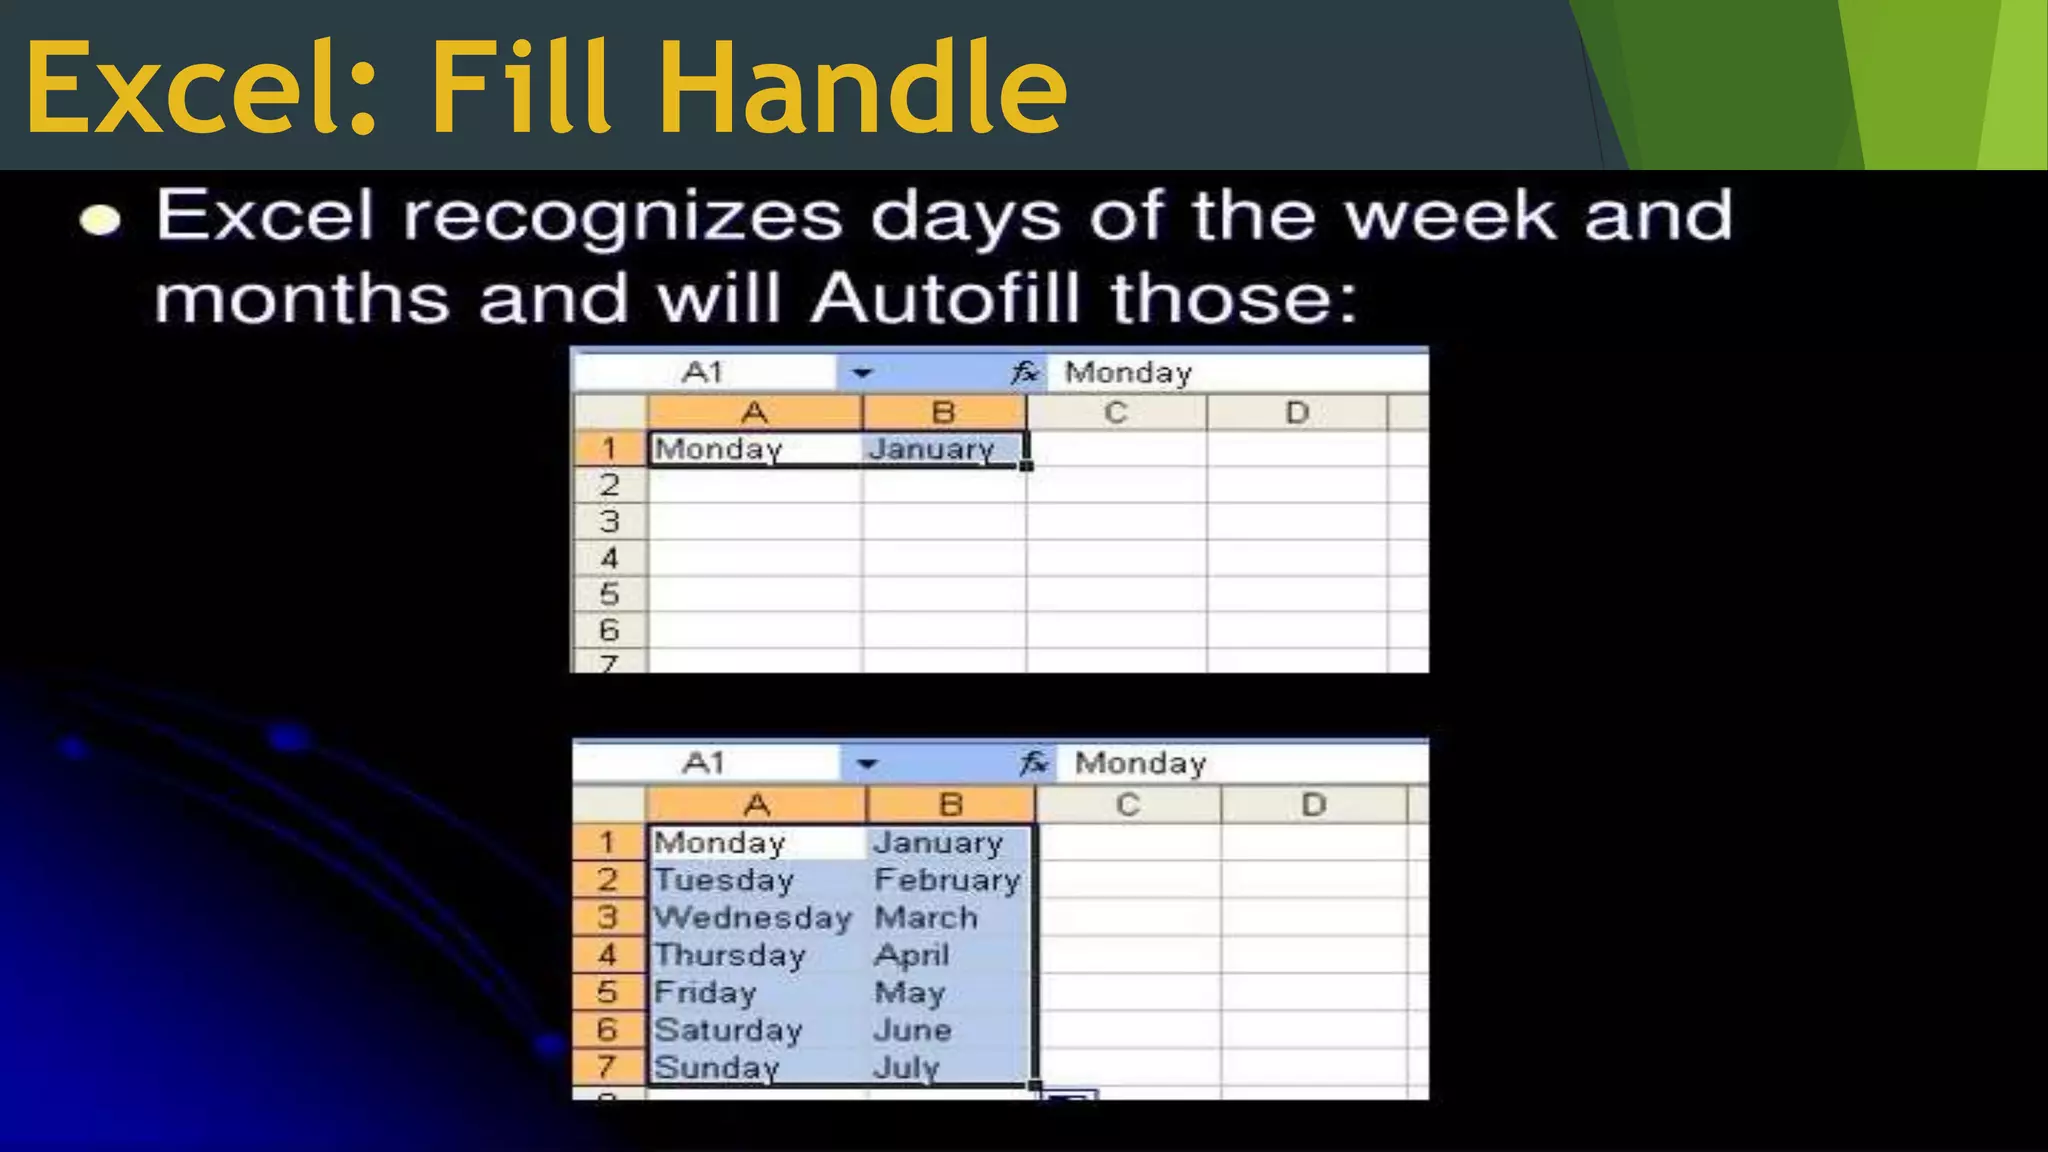
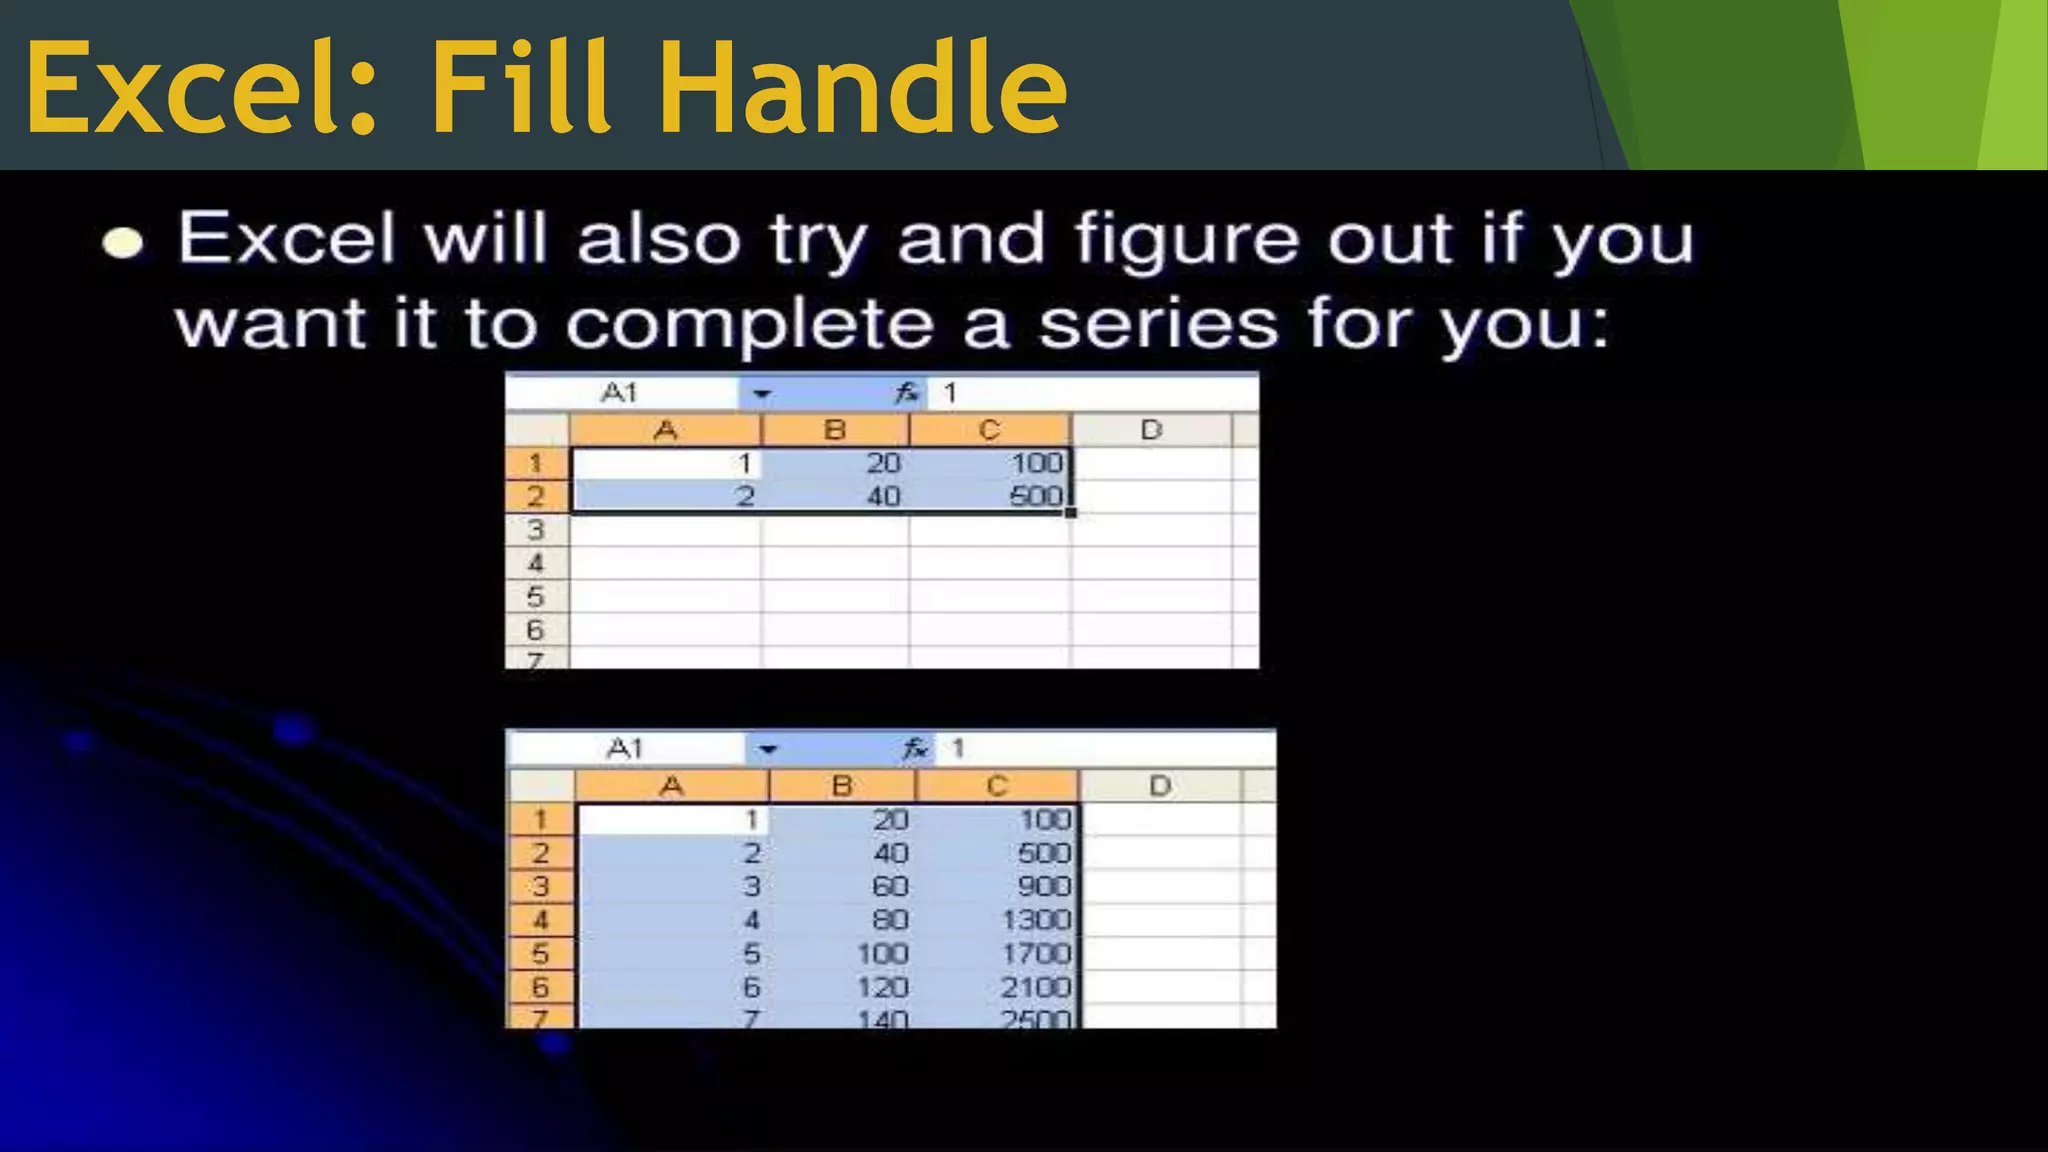
In Microsoft Excel, a fill handle is a feature to extend (and fill) several numbers, dates, or even text to other cells. In the active cell of the spreadsheet, the fill handle is a small black box at the bottom-right corner, as shown in the image.
This document provides an overview of topics that will be covered in a Microsoft Excel training course, including basic and advanced features. The main goals of the course are to help professionals enhance their Excel skills through hands-on exercises and practice with techniques ranging from basic functions to more powerful tools like pivot tables, macros, and statistical/graphing functions. Mastering these Excel skills will allow delegates to more efficiently manage and analyze worksheet data.
5 Excel Tricks and Shortcuts for AccountantsRiyaWalke
Excel is a powerful tool for accountants, enabling them to organize, analyze, and interpret financial data efficiently. To enhance productivity and streamline daily tasks, mastering Excel shortcuts and tricks is essential. In this article, we'll explore five Excel tricks and shortcuts that every accountant should know.
This document provides an overview of useful features in Excel including formulas, functions, columns, rows, cells, data types, basic math functions, the SUM, AVERAGE, MAX, MIN, COUNT, IF, and CONCATENATE functions, text to columns, removing duplicates, instantly revealing formulas, comparing multiple spreadsheets, sorting, filtering, creating and using tables, freezing headers, setting print areas, narrowing margins, shrinking to fit, pivot tables, and cell referencing. Key features allow for calculations, analysis, and manipulation of data in spreadsheets.
This document provides a summary of Microsoft Excel tools and functions for beginners. It explains that Excel is a spreadsheet program used to organize and analyze data in tables consisting of rows and columns. The document then covers navigation within Excel, basic functions like sums and subtotals, filtering data, lookups, text functions, and concatenating cells. The goal is to give an overview of common Excel tools to improve daily work efficiency.
Microsoft Excel is a spreadsheet application developed by Microsoft for creating and formatting spreadsheets. Spreadsheets allow information to be organized in rows and columns and analyzed using automatic mathematics. Excel workbooks can contain multiple worksheets which are made up of a grid of cells organized into rows and columns where data can be stored and analyzed using formulas. Excel offers various features for working with spreadsheets including formatting options, functions, charts and more.
Learn the most important tools of excel that will enable you to become an excel master. These skills are the building blocks of any advanced analysis and should be used every time you are int the program
Microsoft Excel is a spreadsheet program created by Microsoft that allows users to organize, format, and calculate data. It has tools like pivot tables, graphs, formulas, and macros to help users analyze information. Excel allows data analysts to easily examine and update data. Key parts of Excel include active cells, columns, rows, fill handles, address bars, formula bars, title bars, menus, toolbars, ribbons, worksheet tabs, and status bars. Important Excel formulas include SUM, AVERAGE, COUNT, and VLOOKUP to calculate and look up values.
This document provides an overview of key features and functions in Microsoft Excel. It discusses how Excel is organized into workbooks and worksheets containing cells. It also describes common commands for opening, saving, printing and formatting data. Formatting includes filling cells, sorting data, and using reference operators to select ranges of cells. Functions like AutoSum, sorting, and the Function Wizard are demonstrated for summarizing numeric data across ranges of cells.
Advanced Excel Study Materials | Sourav Sir Academy.pptxSBOfficial2
This document outlines the curriculum for a 14-chapter Microsoft Advanced Excel certification training program. The curriculum covers topics such as formatting cells, sorting and filtering data, formulas and functions, charts, pivot tables, macros, and more. Chapter 1 provides an introduction to Excel and covers basic elements like worksheets, cells, formatting, navigating, and views. It describes Excel as a program for creating spreadsheets to enter and analyze data using functions and formulas.
This document provides an overview of a training course on intermediate Microsoft Excel skills. It covers topics such as logical functions, financial functions, lookup functions, sorting and filtering data, working with dates and times, data validation, formula auditing, the Solver tool, data consolidation, pivot tables, and preparing data for analysis. The training is designed to help participants learn how to enter and navigate data, create formulas to solve problems, use charts and graphs, and reference data using relative and absolute cell references. The first lecture demonstrates how to refresh Excel skills, design better spreadsheets, and improve readability through cell styles and data validation.
Spreadsheets allow users to organize and calculate data. Key features include the ability to create and modify workbooks containing multiple worksheets with rows and columns. Worksheets can contain numbers, formulas, and functions to automatically calculate values. Common spreadsheet programs like Microsoft Excel allow users to format and visualize data through graphs and charts.
The document provides an overview of functions and formulas in Excel 2007. It describes how to insert functions using the Insert Function window and how to specify function arguments. It also discusses how to revise existing functions, research new functions using Help, and construct formulas using cell references, operators, and external data. Various functions are listed along with their syntax and examples of use. The document also covers absolute, relative, and mixed cell references.
This document provides an overview of Microsoft Excel and its various features and functions. It discusses the layout and components of a spreadsheet, including rows, columns, cells, worksheets and ribbons. It describes how to enter and modify cell data, insert and delete rows and columns, and use basic formulas and functions like SUM. The document is intended as a guide for using Excel and highlights its applications in fields like accounting, auditing, taxation and data analysis.
This courseware will introduce you to basics in working with Excel Spreadsheets. It'll serve as a compliment to the in-lab sessions that will be held during the data journalism training session - Voter's Count - in Kumasi
The document provides information about working with Microsoft Excel. It discusses key aspects of the Excel interface like the ribbon, tabs, groups of buttons, worksheet, cells, and more. It also provides steps to perform basic arithmetic operations in Excel like addition, subtraction, division, and multiplication on a sample dataset. Finally, it discusses different types of charts in Excel like column charts, line charts, bar charts, area charts, and pie/doughnut charts. It provides detailed steps to create a column chart on a sample dataset of animal population rates over six years.
Microsoft Excel is a spreadsheet program that allows users to enter, organize, and analyze data. It maintains records relating to finances, products, activities, events, and services. Excel workbooks contain individual worksheets made up of cells organized into rows and columns. Formulas can be used to perform calculations with cell values. Navigation between cells can be done using the mouse, keyboard shortcuts, or by entering cell references.
MS Excel is a spreadsheet program used to store and manipulate data in rows and columns divided into cells using worksheets, allowing users to easily write equations and functions. Excel has numerous functions, formulas, shortcuts, and tools that increase its usefulness for accounting, business, and other tasks. The Excel interface includes ribbons, tabs, groups, command buttons, and other components to access its various capabilities.
MS Excel Learning for PPC Google AdWords Training CourseRanjan Jena
MS Excel learning to get expertise in Google AdWords training course. Learn all important tips and techniques in MS Excel for your fast and easy approach to Google AdWords analysis and reporting formats.
Ranjan Jena conducts Adwords Training session in Bangalore, currently with more than 45 students already graduated under his guidance and mentorship. For any training need, you can directly reach him at +91-7760969452
This document provides an overview of key aspects of Microsoft Excel including:
- Excel is a widely used spreadsheet program that allows users to store, organize, and analyze information using workbooks, worksheets, and cells.
- The document reviews Excel interfaces such as the ribbon, toolbars, and shortcuts to help navigate and perform tasks more efficiently.
- Common functions and features like formulas, formatting, filtering, sorting, conditional formatting, and protecting sheets are described to understand how to manipulate and present data.
- Best practices for working with dates, times, and functions are covered to help properly store, display, and calculate dates and times in Excel.
This document provides an introduction and overview of Microsoft Excel. It discusses key aspects of Excel including its use as a spreadsheet program to record and analyze numerical data in columns and rows. It describes the Office button, formatting text, inserting rows and columns, sorting and editing data, using formulas and functions, and some shortcut keys.
This document provides an overview and contents of a 3-day Microsoft Excel 2010 training course. The training is intended for beginners and will cover setting up workbooks, customizing the Excel window, working with data and tables, applying visual effects, and printing workbooks. Specific topics include entering data into cells, editing data, formatting cells, and inserting and deleting columns and rows.
Microsoft Excel is a spreadsheet program that stores and organizes data in workbooks and worksheets. It allows users to perform calculations and analyze information. The Excel window contains components like the active cell, column and row headings, and toolbars. Users can navigate within and between worksheets using arrow keys, scroll bars, tabs, and navigation buttons. They can enter data, formulas, and functions into cells and format worksheets by adjusting rows, columns, and printing options. Charts provide visual representations of workbook data and can be created using the Chart Wizard to select chart types and data ranges.
Advance Microsoft Office Excel Course.pptxssuserc9f959
Microsoft Excel is a spreadsheet application that allows users to enter and store numeric data in a tabular format. It includes features like formulas, charts, pivot tables, and conditional formatting that enable data analysis and visualization. Pivot tables are a key tool for summarizing, analyzing, and comparing trends in large datasets. They allow filtering of data using slicers, autofilters, and pivot table filters. Charts can also be inserted into pivot tables to add visualizations to the data.
This document defines key terms related to the Excel user interface and workbooks. It describes:
1) The main components of the Excel interface including the title bar, menus, toolbars, worksheet, cells, and sheet tabs.
2) How workbooks contain worksheets made up of columns and rows that intersect to form cells.
3) How to navigate within and between worksheets using keyboard shortcuts, scroll bars, and sheet tabs.
This document provides an introduction to Microsoft Excel. It outlines key aspects of using Excel including exploring the interface with toolbars, menus, and ribbons. It describes worksheets and cell referencing. It also covers entering formulas, using functions like SUM and AUTOSUM, finding and replacing text, and printing workbooks. The document is intended as an introductory guide to getting started with basic Excel functions and navigation.
𝐔𝐧𝐯𝐞𝐢𝐥 𝐭𝐡𝐞 𝐅𝐮𝐭𝐮𝐫𝐞 𝐨𝐟 𝐄𝐧𝐞𝐫𝐠𝐲 𝐄𝐟𝐟𝐢𝐜𝐢𝐞𝐧𝐜𝐲 𝐰𝐢𝐭𝐡 𝐍𝐄𝐖𝐍𝐓𝐈𝐃𝐄’𝐬 𝐋𝐚𝐭𝐞𝐬𝐭 𝐎𝐟𝐟𝐞𝐫𝐢𝐧𝐠𝐬
Explore the details in our newly released product manual, which showcases NEWNTIDE's advanced heat pump technologies. Delve into our energy-efficient and eco-friendly solutions tailored for diverse global markets.
The Most Inspiring Entrepreneurs to Follow in 2024.pdfthesiliconleaders
In a world where the potential of youth innovation remains vastly untouched, there emerges a guiding light in the form of Norm Goldstein, the Founder and CEO of EduNetwork Partners. His dedication to this cause has earned him recognition as a Congressional Leadership Award recipient.
SATTA MATKA DPBOSS KALYAN MATKA RESULTS KALYAN CHART KALYAN MATKA MATKA RESULT KALYAN MATKA TIPS SATTA MATKA MATKA COM MATKA PANA JODI TODAY BATTA SATKA MATKA PATTI JODI NUMBER MATKA RESULTS MATKA CHART MATKA JODI SATTA COM INDIA SATTA MATKA MATKA TIPS MATKA WAPKA ALL MATKA RESULT LIVE ONLINE MATKA RESULT KALYAN MATKA RESULT DPBOSS MATKA 143 MAIN MATKA KALYAN MATKA RESULTS KALYAN CHART INDIA MATKA KALYAN SATTA MATKA 420 INDIAN MATKA SATTA KING MATKA FIX JODI FIX FIX FIX SATTA NAMBAR MATKA INDIA SATTA BATTA
Cover Story - China's Investment Leader - Dr. Alyce SUmsthrill
In World Expo 2010 Shanghai – the most visited Expo in the World History
https://www.britannica.com/event/Expo-Shanghai-2010
China’s official organizer of the Expo, CCPIT (China Council for the Promotion of International Trade https://en.ccpit.org/) has chosen Dr. Alyce Su as the Cover Person with Cover Story, in the Expo’s official magazine distributed throughout the Expo, showcasing China’s New Generation of Leaders to the World.
SATTA MATKA DPBOSS KALYAN MATKA RESULTS KALYAN CHART KALYAN MATKA MATKA RESULT KALYAN MATKA TIPS SATTA MATKA MATKA COM MATKA PANA JODI TODAY BATTA SATKA MATKA PATTI JODI NUMBER MATKA RESULTS MATKA CHART MATKA JODI SATTA COM INDIA SATTA MATKA MATKA TIPS MATKA WAPKA ALL MATKA RESULT LIVE ONLINE MATKA RESULT KALYAN MATKA RESULT DPBOSS MATKA 143 MAIN MATKA KALYAN MATKA RESULTS KALYAN CHART
Prescriptive analytics BA4206 Anna University PPTFreelance
Business analysis - Prescriptive analytics Introduction to Prescriptive analytics
Prescriptive Modeling
Non Linear Optimization
Demonstrating Business Performance Improvement
Best Competitive Marble Pricing in Dubai - ☎ 9928909666Stone Art Hub
Stone Art Hub offers the best competitive Marble Pricing in Dubai, ensuring affordability without compromising quality. With a wide range of exquisite marble options to choose from, you can enhance your spaces with elegance and sophistication. For inquiries or orders, contact us at ☎ 9928909666. Experience luxury at unbeatable prices.
SATTA MATKA DPBOSS KALYAN MATKA RESULTS KALYAN CHART KALYAN MATKA MATKA RESULT KALYAN MATKA TIPS SATTA MATKA MATKA COM MATKA PANA JODI TODAY BATTA SATKA MATKA PATTI JODI NUMBER MATKA RESULTS MATKA CHART MATKA JODI SATTA COM INDIA SATTA MATKA MATKA TIPS MATKA WAPKA ALL MATKA RESULT LIVE ONLINE MATKA RESULT KALYAN MATKA RESULT DPBOSS MATKA 143 MAIN MATKA KALYAN MATKA RESULTS KALYAN CHART
Discover the Beauty and Functionality of The Expert Remodeling Serviceobriengroupinc04
Unlock your kitchen's true potential with expert remodeling services from O'Brien Group Inc. Transform your space into a functional, modern, and luxurious haven with their experienced professionals. From layout reconfiguration to high-end upgrades, they deliver stunning results tailored to your style and needs. Visit obriengroupinc.com to elevate your kitchen's beauty and functionality today.
SATTA MATKA DPBOSS KALYAN MATKA RESULTS KALYAN CHART KALYAN MATKA MATKA RESULT KALYAN MATKA TIPS SATTA MATKA MATKA COM MATKA PANA JODI TODAY BATTA SATKA MATKA PATTI JODI NUMBER MATKA RESULTS MATKA CHART MATKA JODI SATTA COM INDIA SATTA MATKA MATKA TIPS MATKA WAPKA ALL MATKA RESULT LIVE ONLINE MATKA RESULT KALYAN MATKA RESULT DPBOSS MATKA 143 MAIN MATKA KALYAN MATKA RESULTS KALYAN CHART
63662490260Kalyan chart, satta matta matka 143, satta matka jodi fix , matka boss OTC 420, Indian Satta, India matka, matka ank, spbossmatka, online satta matka game play, live satta matka results, fix fix fix satta namber, free satta matka games, Kalyan matka jodi chart, Kalyan weekly final anl matka 420
Satta matka fixx jodi panna all market dpboss matka guessing fixx panna jodi kalyan and all market game liss cover now 420 matka office mumbai maharashtra india fixx jodi panna
Call me 9040963354
WhatsApp 9040963354
SATTA MATKA DPBOSS KALYAN MATKA RESULTS KALYAN CHART KALYAN MATKA MATKA RESULT KALYAN MATKA TIPS SATTA MATKA MATKA COM MATKA PANA JODI TODAY BATTA SATKA MATKA PATTI JODI NUMBER MATKA RESULTS MATKA CHART MATKA JODI SATTA COM INDIA SATTA MATKA MATKA TIPS MATKA WAPKA ALL MATKA RESULT LIVE ONLINE MATKA RESULT KALYAN MATKA RESULT DPBOSS MATKA 143 MAIN MATKA KALYAN MATKA RESULTS KALYAN CHART
1Q24_HYUNDAI CAPITAL SERVICES INC. AND SUBSIDIARIES
Excel Fill Handle
1.
2. 1.Understand how to use the fill handle
2.Understand how fill works on the following:
• Values
• Formulas
• Series
3. Fill handle is a way to:
⚫copy data to other cells in the row or column.
⚫continue a pattern for data To use AutoFill,
you just select a cell or cells and drag the fill
handle in the bottom right corner of the
selection across the cells you want to fill.
9. Summary:
• Fill is a quick and easy way to copy
cellsacross columns or down the rows.
• The results of the fill depend on the
sourcecells
10. Summary:
• Plan the layout of the worksheet
Determine the necessary formulas and
functions needed
• Identify how to format various elements
of the worksheet Specify how the chart
should convey necessary information
• Perform what-if analysis and goal seeking
using the best techniques