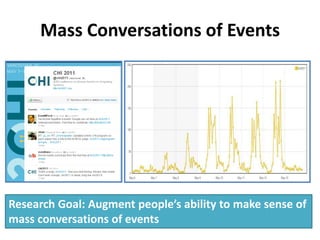
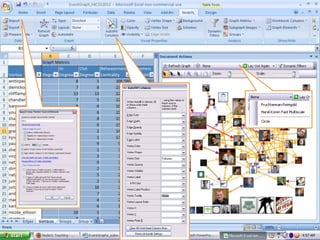
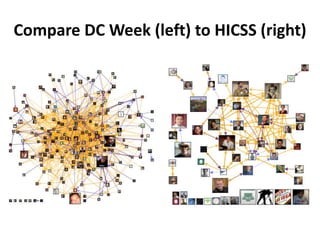
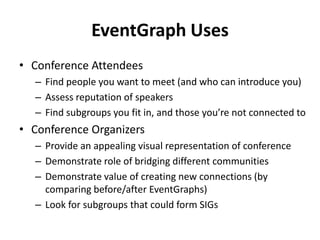
EventGraphs: mapping the social structure of events with NodeXL
Mass Conversations of EventsResearch Goal: Augment people’s ability to make sense of mass conversations of events
HICSS 2011 EventGraphhttps://casci.umd.edu/HICSS_2011_EventGraph
EventGraph: n. A specific genre of network graph that illustrates the structure of connections among people discussing an event via social media services like Twitter.11Derek Hansen, Marc A. Smith, Ben Shneiderman, "EventGraphs: Charting Collections of Conference Connections," HICSS, pp.1-10, 2011 44th Hawaii International Conference on System Sciences, 2011
Types of EventGraph ConnectionsConversational Connections: E.g., Mentions, Replies to, Forwards to, Re-TweetsStructural Connections: E.g., Follows, is Friends with, is a Fan of
Taxonomy of EventGraphsDuration of event (point events, hours long, days long, weeks long…)Frequency of event (one-time, repeated)Spontaneity of event (planned, unplanned)Geographic dispersion of event discussants
Creating EventGraphs in NodeXL
HICSS
Analyzing EventGraphs in NodeXL
What is the Social Structure of an Event Related Discussion?EventGraph of “oil spill” Twitter data from May 4, 2010 with clusters colored differently and size based on Twitter followers
Compare DC Week (left) to HICSS (right)
Who are “Important” Event Discussants?Popular globally and locallyBridge SpannerPopular locally but not globallyPopular globally but not locally
What is the Nature of the Event Conversation?
Theorizing The Web 2011 (@ttw2011)(Size = Total Twitter Follower)https://casci.umd.edu/TTW2011_EventGraph
Theorizing The Web 2011 (@ttw2011)(Size = Betweenness Centrality)https://casci.umd.edu/TTW2011_EventGraph
HCIL Symposium 2011 (#hcil OR hcil)(Size based on Total Twitter Follower)https://casci.umd.edu/HCIL2011
HCIL Symposium 2011 (#hcil OR hcil)(Size based on Betweenness Centrality)https://casci.umd.edu/HCIL2011
HCIL Symposium 2011 (#hcil OR hcil)(Size based on Betweenness Centrality; Discussion only)https://casci.umd.edu/HCIL2011
CaveatsEventGraphs are only as good as their dataKeywords with low recall (#ashcloud, #ashtag) or precision (Jaguar)Not everyone Tweets (HICSS vs. South by Southwest)Twitter usage patterns confounded with underlying social network relationships (not a problem for conversational analysis)Size limitations for visualizations to be meaningful
EventGraph UsesConference AttendeesFind people you want to meet (and who can introduce you)Assess reputation of speakersFind subgroups you fit in, and those you’re not connected toConference OrganizersProvide an appealing visual representation of conferenceDemonstrate role of bridging different communitiesDemonstrate value of creating new connections (by comparing before/after EventGraphs)Look for subgroups that could form SIGs
Future WorkAutomated query expansion/refinement (particularly for unplanned events)Event detection algorithms and hashtag recommendationsOverlaying text-based attributes (e.g., sentiment analysis)Integrating EventGraphs and eventsDeveloping metrics that identify individuals that benefit most from events
http://nodexl.codeplex.com

EventGraphs Talk at HCIL2011

  • 1.
    EventGraphs: mapping thesocial structure of events with NodeXL
  • 2.
    Mass Conversations ofEventsResearch Goal: Augment people’s ability to make sense of mass conversations of events
  • 3.
  • 4.
    EventGraph: n. Aspecific genre of network graph that illustrates the structure of connections among people discussing an event via social media services like Twitter.11Derek Hansen, Marc A. Smith, Ben Shneiderman, "EventGraphs: Charting Collections of Conference Connections," HICSS, pp.1-10, 2011 44th Hawaii International Conference on System Sciences, 2011
  • 5.
    Types of EventGraphConnectionsConversational Connections: E.g., Mentions, Replies to, Forwards to, Re-TweetsStructural Connections: E.g., Follows, is Friends with, is a Fan of
  • 6.
    Taxonomy of EventGraphsDurationof event (point events, hours long, days long, weeks long…)Frequency of event (one-time, repeated)Spontaneity of event (planned, unplanned)Geographic dispersion of event discussants
  • 7.
  • 8.
  • 9.
  • 10.
    What is theSocial Structure of an Event Related Discussion?EventGraph of “oil spill” Twitter data from May 4, 2010 with clusters colored differently and size based on Twitter followers
  • 11.
    Compare DC Week(left) to HICSS (right)
  • 12.
    Who are “Important”Event Discussants?Popular globally and locallyBridge SpannerPopular locally but not globallyPopular globally but not locally
  • 13.
    What is theNature of the Event Conversation?
  • 14.
    Theorizing The Web2011 (@ttw2011)(Size = Total Twitter Follower)https://casci.umd.edu/TTW2011_EventGraph
  • 15.
    Theorizing The Web2011 (@ttw2011)(Size = Betweenness Centrality)https://casci.umd.edu/TTW2011_EventGraph
  • 16.
    HCIL Symposium 2011(#hcil OR hcil)(Size based on Total Twitter Follower)https://casci.umd.edu/HCIL2011
  • 17.
    HCIL Symposium 2011(#hcil OR hcil)(Size based on Betweenness Centrality)https://casci.umd.edu/HCIL2011
  • 18.
    HCIL Symposium 2011(#hcil OR hcil)(Size based on Betweenness Centrality; Discussion only)https://casci.umd.edu/HCIL2011
  • 19.
    CaveatsEventGraphs are onlyas good as their dataKeywords with low recall (#ashcloud, #ashtag) or precision (Jaguar)Not everyone Tweets (HICSS vs. South by Southwest)Twitter usage patterns confounded with underlying social network relationships (not a problem for conversational analysis)Size limitations for visualizations to be meaningful
  • 20.
    EventGraph UsesConference AttendeesFindpeople you want to meet (and who can introduce you)Assess reputation of speakersFind subgroups you fit in, and those you’re not connected toConference OrganizersProvide an appealing visual representation of conferenceDemonstrate role of bridging different communitiesDemonstrate value of creating new connections (by comparing before/after EventGraphs)Look for subgroups that could form SIGs
  • 21.
    Future WorkAutomated queryexpansion/refinement (particularly for unplanned events)Event detection algorithms and hashtag recommendationsOverlaying text-based attributes (e.g., sentiment analysis)Integrating EventGraphs and eventsDeveloping metrics that identify individuals that benefit most from events
  • 22.

Editor's Notes

  • #3 Thanks to Jimmy Lin for the CHI2011 image.
  • #4 Size based on total Twitter FollowersEdge Colors: Orange=Follow, Blue dotted=Mentions, Red=Reply To, Purple = Mentions and Reply ToSee https://casci.umd.edu/HICSS_2011_EventGraph for details
  • #9 Identify search terms (e.g., “hicss”, “oil spill” OR “oilspill”)User “importer” to download sample of messages and connections between authors, along with other data of interestChoose appropriate layout algorithmMap visual attributes to variables of interest (e.g., size = Twitter Followers)
  • #11 Colors indicate automatic detection of groups based on network position, not trait.
  • #12 Size, number of isolates, distribution of degree, clusters
  • #13 Bill Murray = Cliff Lampe
  • #15 Sized by Total Twitter Followers
  • #16 Sized by Betweenness Centrality
  • #17 Sized by Total Twitter Followers
  • #18 Sized by Total Twitter Followers
  • #19 Sized by Total Twitter Followers
  • #21 Here are some ways that EventGraphs can be used to achieve “actionable insights” for conference attendees and organizers.
  • #22 Take-Home message. Ways of using EventGraphs as user & conference organizer