SlideShare a Scribd company logo
Evaluation of APTT clot waveform analysis by IL ACL TOP®
in
patients with Haemophilia and comparison to clot waveform
analysis with MDA®
180
Aghighi S., Riddell A.F., Vijayakumar, E., Chowdary, P.
Katharine Dormandy Haemophilia Centre & Thrombosis Unit, The Royal Free Hospital, Pond Street, London NW3 2QG, U.K.
Introduction
•Optical data generated during clotting tests such as prothrombin time (PT)
and activated partial thromboplastin time (APTT) have been used to measure
kinetics of fibrin generation, and indirectly of thrombin generation in
haemophilia patients 1
.
• Formation of fibrin leads to a concomitant increase in the optical density of
the plasma specimen (or a decrease in light transmittance).
• Modern automated photo-optical coagulation analysers, collect optical data
over the entire course of clot formation and an optical profile, or clot
waveform, is mathematically processed by a software algorithm, to derive
parameters of coagulation velocity.
• Clot waveform analysis using light transmittance on MDA®
180 analysers
has previously been reported 1,2,3
.
•Recently, Solano et al. have studied the use of APTT derivative curves by
using absorbance values to create the clot reaction curve on ACL TOP®
analysers Instrumentation Laboratory (IL), USA) in different patient groups 4
.
Conclusion
•The APTT clot reaction derivatives, produced by the ACL TOP®
correlated
significantly with the parameters of clot waveform analysis on the MDA®
180.
•Similar to MDA clot waveform analysis, ACL TOP®
results showed a
significant correlation with FVIII/FIX levels.
•The high sensitivity and specificity of these tests make them a reliable
predictor of FVIII/FIX levels in haemophilia patients.
Aim
To investigate the use of clot reaction curve derivatives, based on light
absorbance on the ACL TOP®
coagulometer, and compare them with the light
transmittance generated clot waveform as performed on the MDA®
180
analyser, in a normal individual group and in patients with haemophilia A.
References
1. Braun, P.J., Givens, T.B., Stead, A.G., Beck, L.R., Gooch, S.A., Fischer, T.J. (1997). Properties of optical data from APTT and PT
assays. Thromb Haemost, 78, 1079-87.
2. Downey, C., Kasmir, R.. Toh, CH. (1997). Novel and diagnostically applicable information from optical waveform analysis of blood
coagulation in disseminated intravascular coagulation. British Journal of Haematology, 98(1), 68-73.
3. Shima, M., Matsumoto, T., Fukuda, K., Kubota, Y., Tanaka, I., Nishiya, K (2002). The utility of activated partial thromboplastin time (aptt)
clot waveform analysis in the investigation of hemophilia a patients with very low levels of factor viii activity (FVIII:C). Thromb Haemost,
87(3), 436-441.
4. Solano, C., Zerafa, P., Bird, R. (2010). A study of atypical APTT derivative curves on the ACL TOP coagulation analyser. Int Jnl Lab Hem
33(1), 67-78.
Methods
•APTTs were measured on the MDA®
180 (Organon Teknika, UK), using
Platelin LS reagent (Stago, France) and on an ACL TOP®
, using SynthASIL
reagent (IL, USA). MDA®
180 clot waveform parameters (Min1 = velocity, Min2
= acceleration) and ACL TOP®
clot profile parameters (Max1 = velocity, Max2
= acceleration) were calculated by the manufacturer’s software.
•A reference range was established for each parameter and compared with 70
patients with Haemophilia (Haemophilia A: severe, n=27, moderate n=9, mild
n=10, and Haemophilia B: severe n=9, moderate n=3, mild n=4). FVIII and FIX
activity levels were also measured with one-stage clotting factor assay using
the ACL®
3000 analyser.
Results
•Min1 correlated significantly with Max1 (r = 0.883, p < 0.0001)
•Min2 also correlated significantly with Max2 (r = 0.883, p < 0.0001)
•FVIII levels correlated significantly with Min1, Min2, Max1, and Max2 (r =
0.804, 0.837, 0.701, 0.75;respectivly; p < 0.0001)
•FIX levels were also correlated significantly with Min1, Min2, Max1, and
Max2 (r = 0.721, 0.697, 0.685, 0.681 respectively; p < 0.001)
•Sensitivity and specificity of tests to distinguish between normal individuals
and patients with Haemophilia A or B was Min1 = 99%, 96%, Min2 = 97%,
96%, Max1 = 98%, 96% and Max2 = 100%, 96%.
Discussion
•Clot waveform analysis, based on light transmission on the MDA®
180
analyser, has been used to analyse fibrin clot formation beyond clot detection
as a surrogate marker of thrombin generation.
•Several groups have described the usefulness of clot waveform analysis in
different clinical settings 1,2,3
.
•In our study light absorbance based APTT derivatives generated by the ACL
TOP®
, correlated significantly with parameters of clot waveform by the MDA®
180. The high sensitivity and specificity we achieved make them a useful
global screening test.
•Our results showed a significant correlation between FVIII/FIX clotting activity
levels and Max1/Max2.
•APTT velocity and acceleration parameters of fibrin polymerisation may not
only be dependent on clotting factor levels but also other markers that may
influence the coagulation potential of individuals.
•Further studies are required to determine the correlation of APTT derivatives
and clinical phenotype of haemophilia patients.
Figure A showing linear regression
analysis of comparison of ACL TOP®
Max1 and MDA ®
180 Min1 (r2
=
0.771).
Figure B showing linear regression
analysis of ACL TOP®
Max2 and
MDA ®
180 Min2 (r2
= 0.789).
0 50 100 150
0
10
20
30
40
50
Min2
%
Max2
%
0 50 100 150
0
20
40
60
80
Min1
%
Max1
%
APTT clot reaction curve by ACL
TOP®
.
Based on light absorbance, point a is the
start of light absorbance by addition of
activating reagent. Point b indicates the
initiation of coagulation. Point c is the
coagulation midpoint. Point d is the end of
coagulation phase. Point e is the end of
acquisition time. The absolute value of
Max1 shows the maximum coagulation
velocity and the absolute value of Max2
shows the maximum coagulation
acceleration 4
.
APTT clot reaction curve by MDA®
180.
Based on light transmittance, point a is the
start of light transmittance by addition of
activating reagent. Point b indicates the
initiation of coagulation. Point c is the
coagulation midpoint. Point d is the end of
coagulation phase. Point e is the end of
acquisition time. The absolute value of Min1
shows the maximum coagulation velocity
and the absolute value of Min2 shows the
maximum coagulation acceleration 1
.
Max2
Max1
d
c
ba
mAbs
Time (s)
e
P-TH-568
Figure A Figure B
Min2
%
Min1
%

More Related Content

Viewers also liked

WELDING JOINT DESING AND WELDINGSYMBOLS
WELDING JOINT DESING AND WELDINGSYMBOLSWELDING JOINT DESING AND WELDINGSYMBOLS
WELDING JOINT DESING AND WELDINGSYMBOLSRAJA K
 
Pemanfaatan Sampah / Limbah Sebagai Energi Terbarukan
Pemanfaatan Sampah / Limbah Sebagai Energi TerbarukanPemanfaatan Sampah / Limbah Sebagai Energi Terbarukan
Pemanfaatan Sampah / Limbah Sebagai Energi TerbarukanNahdya Maulina
 
studio perancangan 2
studio perancangan 2studio perancangan 2
studio perancangan 2Purwo S
 
Powered Industrial Trucks Operator Training by OSHA
Powered Industrial Trucks Operator Training by OSHAPowered Industrial Trucks Operator Training by OSHA
Powered Industrial Trucks Operator Training by OSHAAtlantic Training, LLC.
 
Forklift Operator Safety Training by Platteville
Forklift Operator Safety Training by PlattevilleForklift Operator Safety Training by Platteville
Forklift Operator Safety Training by PlattevilleAtlantic Training, LLC.
 

Viewers also liked (8)

Mail Merge
Mail MergeMail Merge
Mail Merge
 
WELDING JOINT DESING AND WELDINGSYMBOLS
WELDING JOINT DESING AND WELDINGSYMBOLSWELDING JOINT DESING AND WELDINGSYMBOLS
WELDING JOINT DESING AND WELDINGSYMBOLS
 
Pemanfaatan Sampah / Limbah Sebagai Energi Terbarukan
Pemanfaatan Sampah / Limbah Sebagai Energi TerbarukanPemanfaatan Sampah / Limbah Sebagai Energi Terbarukan
Pemanfaatan Sampah / Limbah Sebagai Energi Terbarukan
 
Pengertian Sampah
Pengertian SampahPengertian Sampah
Pengertian Sampah
 
studio perancangan 2
studio perancangan 2studio perancangan 2
studio perancangan 2
 
Powered Industrial Trucks Operator Training by OSHA
Powered Industrial Trucks Operator Training by OSHAPowered Industrial Trucks Operator Training by OSHA
Powered Industrial Trucks Operator Training by OSHA
 
Forklift Operator Safety Training by Platteville
Forklift Operator Safety Training by PlattevilleForklift Operator Safety Training by Platteville
Forklift Operator Safety Training by Platteville
 
Nordics at SXSW 2017
Nordics at SXSW 2017Nordics at SXSW 2017
Nordics at SXSW 2017
 

Similar to Evaluation of APTT clot waveform analysis by IL ACL TOP® in patients with Haemophilia and comparison to clot waveform analysis with MDA® 180

Vascular Biomarkers in Cardiovascular Risk Prediction & Radiofrequency-based ...
Vascular Biomarkers in Cardiovascular Risk Prediction & Radiofrequency-based ...Vascular Biomarkers in Cardiovascular Risk Prediction & Radiofrequency-based ...
Vascular Biomarkers in Cardiovascular Risk Prediction & Radiofrequency-based ...MIDEAS
 
Predicciones de a5 y a10 br. j. anaesth. 2013-görlinger-222-30
Predicciones de a5 y a10 br. j. anaesth. 2013-görlinger-222-30Predicciones de a5 y a10 br. j. anaesth. 2013-görlinger-222-30
Predicciones de a5 y a10 br. j. anaesth. 2013-görlinger-222-30Carla Castro Blanco
 
On The Detection of Ctni - A Comparison of Surface-Plasmon Optical - Electroc...
On The Detection of Ctni - A Comparison of Surface-Plasmon Optical - Electroc...On The Detection of Ctni - A Comparison of Surface-Plasmon Optical - Electroc...
On The Detection of Ctni - A Comparison of Surface-Plasmon Optical - Electroc...komalicarol
 
Haemodynamic monitoring
Haemodynamic monitoringHaemodynamic monitoring
Haemodynamic monitoringguest5c708a
 
Comparison of reticulocyte count by VCS technology; Beckman Coulter Hematolog...
Comparison of reticulocyte count by VCS technology; Beckman Coulter Hematolog...Comparison of reticulocyte count by VCS technology; Beckman Coulter Hematolog...
Comparison of reticulocyte count by VCS technology; Beckman Coulter Hematolog...kridsada31
 
Topic -Analysis of Patients specific Quality Assurance of IMRT/VMAT
Topic -Analysis of Patients specific Quality Assurance of IMRT/VMATTopic -Analysis of Patients specific Quality Assurance of IMRT/VMAT
Topic -Analysis of Patients specific Quality Assurance of IMRT/VMATRajeev Kumar Pandit
 
Insertable cardiac monitors to detect AF and subsequently moderate stroke ris...
Insertable cardiac monitors to detect AF and subsequently moderate stroke ris...Insertable cardiac monitors to detect AF and subsequently moderate stroke ris...
Insertable cardiac monitors to detect AF and subsequently moderate stroke ris...Alex Diamantopoulos
 
Myocardial triglyceride Cardiac Amyloidosis MR Spectroscopy
Myocardial triglyceride Cardiac Amyloidosis MR SpectroscopyMyocardial triglyceride Cardiac Amyloidosis MR Spectroscopy
Myocardial triglyceride Cardiac Amyloidosis MR SpectroscopyPRAMOD KUMAR
 
Wavelength selection in measuring red.pdf
Wavelength selection in measuring red.pdfWavelength selection in measuring red.pdf
Wavelength selection in measuring red.pdfbitconcepts
 
IRJET- Congestive Heart Failure Recognition by Analyzing The ECG Signals usi...
IRJET-  Congestive Heart Failure Recognition by Analyzing The ECG Signals usi...IRJET-  Congestive Heart Failure Recognition by Analyzing The ECG Signals usi...
IRJET- Congestive Heart Failure Recognition by Analyzing The ECG Signals usi...IRJET Journal
 
Real-time and Non-Invasive Detection of Haemoglobin level using CNN
Real-time and Non-Invasive Detection of Haemoglobin level using CNNReal-time and Non-Invasive Detection of Haemoglobin level using CNN
Real-time and Non-Invasive Detection of Haemoglobin level using CNNIRJET Journal
 
hERG SOT Poster 2010
hERG SOT Poster 2010hERG SOT Poster 2010
hERG SOT Poster 2010ShiminWang
 
hERG SOT Poster 2010
hERG SOT Poster 2010hERG SOT Poster 2010
hERG SOT Poster 2010karenbernards
 
Thrombin Generation Test (TGT) & Rotational Thromboelastography (ROTEM™) and ...
Thrombin Generation Test (TGT) & Rotational Thromboelastography (ROTEM™) and ...Thrombin Generation Test (TGT) & Rotational Thromboelastography (ROTEM™) and ...
Thrombin Generation Test (TGT) & Rotational Thromboelastography (ROTEM™) and ...Saman Aghighi DBMS
 
THE USE OF ADAPTIVE STATISTICAL ITERATIVE RECONSTRUCTION (ASIR) ON IMAGE QUAL...
THE USE OF ADAPTIVE STATISTICAL ITERATIVE RECONSTRUCTION (ASIR) ON IMAGE QUAL...THE USE OF ADAPTIVE STATISTICAL ITERATIVE RECONSTRUCTION (ASIR) ON IMAGE QUAL...
THE USE OF ADAPTIVE STATISTICAL ITERATIVE RECONSTRUCTION (ASIR) ON IMAGE QUAL...AM Publications
 
Development and Validation of RP HPLC Method for Estimation of Vortioxetine i...
Development and Validation of RP HPLC Method for Estimation of Vortioxetine i...Development and Validation of RP HPLC Method for Estimation of Vortioxetine i...
Development and Validation of RP HPLC Method for Estimation of Vortioxetine i...ijtsrd
 

Similar to Evaluation of APTT clot waveform analysis by IL ACL TOP® in patients with Haemophilia and comparison to clot waveform analysis with MDA® 180 (20)

Vascular Biomarkers in Cardiovascular Risk Prediction & Radiofrequency-based ...
Vascular Biomarkers in Cardiovascular Risk Prediction & Radiofrequency-based ...Vascular Biomarkers in Cardiovascular Risk Prediction & Radiofrequency-based ...
Vascular Biomarkers in Cardiovascular Risk Prediction & Radiofrequency-based ...
 
Predicciones de a5 y a10 br. j. anaesth. 2013-görlinger-222-30
Predicciones de a5 y a10 br. j. anaesth. 2013-görlinger-222-30Predicciones de a5 y a10 br. j. anaesth. 2013-görlinger-222-30
Predicciones de a5 y a10 br. j. anaesth. 2013-görlinger-222-30
 
On The Detection of Ctni - A Comparison of Surface-Plasmon Optical - Electroc...
On The Detection of Ctni - A Comparison of Surface-Plasmon Optical - Electroc...On The Detection of Ctni - A Comparison of Surface-Plasmon Optical - Electroc...
On The Detection of Ctni - A Comparison of Surface-Plasmon Optical - Electroc...
 
Haemodynamic monitoring
Haemodynamic monitoringHaemodynamic monitoring
Haemodynamic monitoring
 
Comparison of reticulocyte count by VCS technology; Beckman Coulter Hematolog...
Comparison of reticulocyte count by VCS technology; Beckman Coulter Hematolog...Comparison of reticulocyte count by VCS technology; Beckman Coulter Hematolog...
Comparison of reticulocyte count by VCS technology; Beckman Coulter Hematolog...
 
SPECTROPHOTOMETRIC MEASUREMENT OF SOLUBILITY TEST TURBIDITY AS AN IMPROVED DI...
SPECTROPHOTOMETRIC MEASUREMENT OF SOLUBILITY TEST TURBIDITY AS AN IMPROVED DI...SPECTROPHOTOMETRIC MEASUREMENT OF SOLUBILITY TEST TURBIDITY AS AN IMPROVED DI...
SPECTROPHOTOMETRIC MEASUREMENT OF SOLUBILITY TEST TURBIDITY AS AN IMPROVED DI...
 
Topic -Analysis of Patients specific Quality Assurance of IMRT/VMAT
Topic -Analysis of Patients specific Quality Assurance of IMRT/VMATTopic -Analysis of Patients specific Quality Assurance of IMRT/VMAT
Topic -Analysis of Patients specific Quality Assurance of IMRT/VMAT
 
Insertable cardiac monitors to detect AF and subsequently moderate stroke ris...
Insertable cardiac monitors to detect AF and subsequently moderate stroke ris...Insertable cardiac monitors to detect AF and subsequently moderate stroke ris...
Insertable cardiac monitors to detect AF and subsequently moderate stroke ris...
 
Myocardial triglyceride Cardiac Amyloidosis MR Spectroscopy
Myocardial triglyceride Cardiac Amyloidosis MR SpectroscopyMyocardial triglyceride Cardiac Amyloidosis MR Spectroscopy
Myocardial triglyceride Cardiac Amyloidosis MR Spectroscopy
 
Wavelength selection in measuring red.pdf
Wavelength selection in measuring red.pdfWavelength selection in measuring red.pdf
Wavelength selection in measuring red.pdf
 
IRJET- Congestive Heart Failure Recognition by Analyzing The ECG Signals usi...
IRJET-  Congestive Heart Failure Recognition by Analyzing The ECG Signals usi...IRJET-  Congestive Heart Failure Recognition by Analyzing The ECG Signals usi...
IRJET- Congestive Heart Failure Recognition by Analyzing The ECG Signals usi...
 
Real-time and Non-Invasive Detection of Haemoglobin level using CNN
Real-time and Non-Invasive Detection of Haemoglobin level using CNNReal-time and Non-Invasive Detection of Haemoglobin level using CNN
Real-time and Non-Invasive Detection of Haemoglobin level using CNN
 
hERG SOT Poster 2010
hERG SOT Poster 2010hERG SOT Poster 2010
hERG SOT Poster 2010
 
hERG SOT Poster 2010
hERG SOT Poster 2010hERG SOT Poster 2010
hERG SOT Poster 2010
 
A review of thromboelastography
A review of thromboelastographyA review of thromboelastography
A review of thromboelastography
 
Thrombin Generation Test (TGT) & Rotational Thromboelastography (ROTEM™) and ...
Thrombin Generation Test (TGT) & Rotational Thromboelastography (ROTEM™) and ...Thrombin Generation Test (TGT) & Rotational Thromboelastography (ROTEM™) and ...
Thrombin Generation Test (TGT) & Rotational Thromboelastography (ROTEM™) and ...
 
THE USE OF ADAPTIVE STATISTICAL ITERATIVE RECONSTRUCTION (ASIR) ON IMAGE QUAL...
THE USE OF ADAPTIVE STATISTICAL ITERATIVE RECONSTRUCTION (ASIR) ON IMAGE QUAL...THE USE OF ADAPTIVE STATISTICAL ITERATIVE RECONSTRUCTION (ASIR) ON IMAGE QUAL...
THE USE OF ADAPTIVE STATISTICAL ITERATIVE RECONSTRUCTION (ASIR) ON IMAGE QUAL...
 
isi
isi isi
isi
 
F010513135
F010513135F010513135
F010513135
 
Development and Validation of RP HPLC Method for Estimation of Vortioxetine i...
Development and Validation of RP HPLC Method for Estimation of Vortioxetine i...Development and Validation of RP HPLC Method for Estimation of Vortioxetine i...
Development and Validation of RP HPLC Method for Estimation of Vortioxetine i...
 

Evaluation of APTT clot waveform analysis by IL ACL TOP® in patients with Haemophilia and comparison to clot waveform analysis with MDA® 180

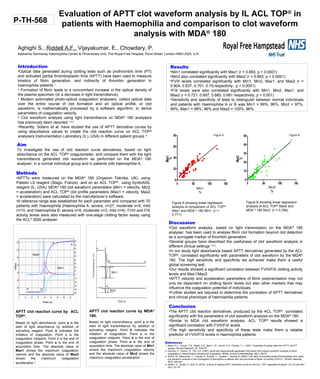
  • 1. Evaluation of APTT clot waveform analysis by IL ACL TOP® in patients with Haemophilia and comparison to clot waveform analysis with MDA® 180 Aghighi S., Riddell A.F., Vijayakumar, E., Chowdary, P. Katharine Dormandy Haemophilia Centre & Thrombosis Unit, The Royal Free Hospital, Pond Street, London NW3 2QG, U.K. Introduction •Optical data generated during clotting tests such as prothrombin time (PT) and activated partial thromboplastin time (APTT) have been used to measure kinetics of fibrin generation, and indirectly of thrombin generation in haemophilia patients 1 . • Formation of fibrin leads to a concomitant increase in the optical density of the plasma specimen (or a decrease in light transmittance). • Modern automated photo-optical coagulation analysers, collect optical data over the entire course of clot formation and an optical profile, or clot waveform, is mathematically processed by a software algorithm, to derive parameters of coagulation velocity. • Clot waveform analysis using light transmittance on MDA® 180 analysers has previously been reported 1,2,3 . •Recently, Solano et al. have studied the use of APTT derivative curves by using absorbance values to create the clot reaction curve on ACL TOP® analysers Instrumentation Laboratory (IL), USA) in different patient groups 4 . Conclusion •The APTT clot reaction derivatives, produced by the ACL TOP® correlated significantly with the parameters of clot waveform analysis on the MDA® 180. •Similar to MDA clot waveform analysis, ACL TOP® results showed a significant correlation with FVIII/FIX levels. •The high sensitivity and specificity of these tests make them a reliable predictor of FVIII/FIX levels in haemophilia patients. Aim To investigate the use of clot reaction curve derivatives, based on light absorbance on the ACL TOP® coagulometer, and compare them with the light transmittance generated clot waveform as performed on the MDA® 180 analyser, in a normal individual group and in patients with haemophilia A. References 1. Braun, P.J., Givens, T.B., Stead, A.G., Beck, L.R., Gooch, S.A., Fischer, T.J. (1997). Properties of optical data from APTT and PT assays. Thromb Haemost, 78, 1079-87. 2. Downey, C., Kasmir, R.. Toh, CH. (1997). Novel and diagnostically applicable information from optical waveform analysis of blood coagulation in disseminated intravascular coagulation. British Journal of Haematology, 98(1), 68-73. 3. Shima, M., Matsumoto, T., Fukuda, K., Kubota, Y., Tanaka, I., Nishiya, K (2002). The utility of activated partial thromboplastin time (aptt) clot waveform analysis in the investigation of hemophilia a patients with very low levels of factor viii activity (FVIII:C). Thromb Haemost, 87(3), 436-441. 4. Solano, C., Zerafa, P., Bird, R. (2010). A study of atypical APTT derivative curves on the ACL TOP coagulation analyser. Int Jnl Lab Hem 33(1), 67-78. Methods •APTTs were measured on the MDA® 180 (Organon Teknika, UK), using Platelin LS reagent (Stago, France) and on an ACL TOP® , using SynthASIL reagent (IL, USA). MDA® 180 clot waveform parameters (Min1 = velocity, Min2 = acceleration) and ACL TOP® clot profile parameters (Max1 = velocity, Max2 = acceleration) were calculated by the manufacturer’s software. •A reference range was established for each parameter and compared with 70 patients with Haemophilia (Haemophilia A: severe, n=27, moderate n=9, mild n=10, and Haemophilia B: severe n=9, moderate n=3, mild n=4). FVIII and FIX activity levels were also measured with one-stage clotting factor assay using the ACL® 3000 analyser. Results •Min1 correlated significantly with Max1 (r = 0.883, p < 0.0001) •Min2 also correlated significantly with Max2 (r = 0.883, p < 0.0001) •FVIII levels correlated significantly with Min1, Min2, Max1, and Max2 (r = 0.804, 0.837, 0.701, 0.75;respectivly; p < 0.0001) •FIX levels were also correlated significantly with Min1, Min2, Max1, and Max2 (r = 0.721, 0.697, 0.685, 0.681 respectively; p < 0.001) •Sensitivity and specificity of tests to distinguish between normal individuals and patients with Haemophilia A or B was Min1 = 99%, 96%, Min2 = 97%, 96%, Max1 = 98%, 96% and Max2 = 100%, 96%. Discussion •Clot waveform analysis, based on light transmission on the MDA® 180 analyser, has been used to analyse fibrin clot formation beyond clot detection as a surrogate marker of thrombin generation. •Several groups have described the usefulness of clot waveform analysis in different clinical settings 1,2,3 . •In our study light absorbance based APTT derivatives generated by the ACL TOP® , correlated significantly with parameters of clot waveform by the MDA® 180. The high sensitivity and specificity we achieved make them a useful global screening test. •Our results showed a significant correlation between FVIII/FIX clotting activity levels and Max1/Max2. •APTT velocity and acceleration parameters of fibrin polymerisation may not only be dependent on clotting factor levels but also other markers that may influence the coagulation potential of individuals. •Further studies are required to determine the correlation of APTT derivatives and clinical phenotype of haemophilia patients. Figure A showing linear regression analysis of comparison of ACL TOP® Max1 and MDA ® 180 Min1 (r2 = 0.771). Figure B showing linear regression analysis of ACL TOP® Max2 and MDA ® 180 Min2 (r2 = 0.789). 0 50 100 150 0 10 20 30 40 50 Min2 % Max2 % 0 50 100 150 0 20 40 60 80 Min1 % Max1 % APTT clot reaction curve by ACL TOP® . Based on light absorbance, point a is the start of light absorbance by addition of activating reagent. Point b indicates the initiation of coagulation. Point c is the coagulation midpoint. Point d is the end of coagulation phase. Point e is the end of acquisition time. The absolute value of Max1 shows the maximum coagulation velocity and the absolute value of Max2 shows the maximum coagulation acceleration 4 . APTT clot reaction curve by MDA® 180. Based on light transmittance, point a is the start of light transmittance by addition of activating reagent. Point b indicates the initiation of coagulation. Point c is the coagulation midpoint. Point d is the end of coagulation phase. Point e is the end of acquisition time. The absolute value of Min1 shows the maximum coagulation velocity and the absolute value of Min2 shows the maximum coagulation acceleration 1 . Max2 Max1 d c ba mAbs Time (s) e P-TH-568 Figure A Figure B Min2 % Min1 %