Eurostat Estimate of Q1 GDP for Eurozone
•
1 like•269 views

European GDP figures published on May 15th, 2013

Recommended
Recommended
More Related Content
Similar to Eurostat Estimate of Q1 GDP for Eurozone
Similar to Eurostat Estimate of Q1 GDP for Eurozone (20)
Recently uploaded
Recently uploaded (19)
Eurostat Estimate of Q1 GDP for Eurozone
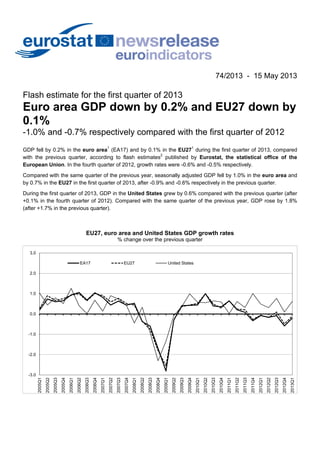
- 1. 74/2013 - 15 May 2013 Flash estimate for the first quarter of 2013 Euro area GDP down by 0.2% and EU27 down by 0.1% -1.0% and -0.7% respectively compared with the first quarter of 2012 GDP fell by 0.2% in the euro area1 (EA17) and by 0.1% in the EU271 during the first quarter of 2013, compared with the previous quarter, according to flash estimates2 published by Eurostat, the statistical office of the European Union. In the fourth quarter of 2012, growth rates were -0.6% and -0.5% respectively. Compared with the same quarter of the previous year, seasonally adjusted GDP fell by 1.0% in the euro area and by 0.7% in the EU27 in the first quarter of 2013, after -0.9% and -0.6% respectively in the previous quarter. During the first quarter of 2013, GDP in the United States grew by 0.6% compared with the previous quarter (after +0.1% in the fourth quarter of 2012). Compared with the same quarter of the previous year, GDP rose by 1.8% (after +1.7% in the previous quarter). EU27, euro area and United States GDP growth rates % change over the previous quarter -3.0 -2.0 -1.0 0.0 1.0 2.0 3.0 2005Q1 2005Q2 2005Q3 2005Q4 2006Q1 2006Q2 2006Q3 2006Q4 2007Q1 2007Q2 2007Q3 2007Q4 2008Q1 2008Q2 2008Q3 2008Q4 2009Q1 2009Q2 2009Q3 2009Q4 2010Q1 2010Q2 2010Q3 2010Q4 2011Q1 2011Q2 2011Q3 2011Q4 2012Q1 2012Q2 2012Q3 2012Q4 2013Q1 EA17 EU27 United States
- 2. Growth rates of GDP in volume (based on seasonally adjusted* data) Percentage change compared with the previous quarter Percentage change compared with the same quarter of the previous year 2012 2013 2012 2013 Q2 Q3 Q4 Q1 Q2 Q3 Q4 Q1 EA17 -0.2 -0.1 -0.6 -0.2 -0.5 -0.7 -0.9 -1.0 EU27 -0.2 0.1 -0.5 -0.1 -0.3 -0.4 -0.6 -0.7 Member States Belgium -0.4 0.0 -0.1 0.1 -0.4 -0.4 -0.5 -0.5 Bulgaria 0.1 0.1 0.0 0.1 0.8 0.7 0.6 0.4 Czech Republic -0.5 -0.3 -0.3 -0.8 -1.1 -1.4 -1.6 -1.9 Denmark -0.9 0.8 -0.7 : -1.3 0.0 -0.7 : Germany 0.2 0.2 -0.7 0.1 1.0 0.9 0.3 -0.3 Estonia 0.3 1.4 0.6 -1.0 2.8 3.1 3.0 1.2 Ireland 0.7 -0.4 0.0 : 0.8 0.9 0.0 : Greece** : : : : -6.4 -6.7 -5.7 -5.3 Spain -0.4 -0.3 -0.8 -0.5 -1.4 -1.6 -1.9 -2.0 France -0.2 0.1 -0.2 -0.2 0.1 0.0 -0.3 -0.4 Italy -0.6 -0.2 -0.9 -0.5 -2.5 -2.6 -2.8 -2.3 Cyprus -1.0 -0.7 -1.2 -1.3 -2.5 -2.3 -3.4 -4.1 Latvia 1.3 1.6 1.3 1.2 5.0 5.4 5.8 5.6 Lithuania 0.6 1.5 0.7 1.3 3.1 3.8 3.1 4.1 Luxembourg 0.5 -0.5 1.6 : 0.6 -0.5 1.6 : Hungary -0.6 0.0 -0.4 0.7 -1.7 -1.8 -2.4 -0.3 Malta 1.8 0.9 -0.2 : 1.5 3.0 2.2 : Netherlands*** 0.2 -1.0 -0.4 -0.1 -0.4 -1.2 -1.2 -1.3 Austria**** 0.1 0.0 -0.1 0.0 0.8 0.8 0.4 0.0 Poland 0.1 0.3 0.0 0.1 2.2 1.7 0.7 0.4 Portugal -1.1 -0.9 -1.8 -0.3 -3.2 -3.6 -3.8 -3.9 Romania 0.6 -0.2 0.4 0.5 1.8 0.1 0.7 1.3 Slovenia -1.1 -0.6 -1.0 : -2.3 -2.8 -2.8 : Slovakia 0.3 0.2 0.1 0.3 2.3 1.9 1.0 0.9 Finland -1.4 0.0 -0.6 -0.1 -0.1 -0.8 -1.4 -2.0 Sweden 0.8 0.3 0.0 : 1.4 0.6 1.5 : United Kingdom -0.4 0.9 -0.3 0.3 0.0 0.4 0.2 0.6 Other countries Iceland -6.4 4.8 0.5 : -0.9 1.9 1.5 : Norway 0.8 -0.6 0.4 : 4.4 1.7 1.9 : Switzerland -0.1 0.6 0.2 : 0.4 1.3 1.2 : Croatia** -0.7 -0.6 -0.7 : -2.5 -1.9 -2.3 : United States 0.3 0.8 0.1 0.6 2.1 2.6 1.7 1.8 Japan -0.2 -0.9 0.0 : 4.0 0.4 0.4 : : Data not available. * The seasonal adjustment does not include a working-day correction for Ireland, Portugal, Romania and Slovakia. ** Percentage change compared with the same quarter of the previous year calculated from non-seasonally adjusted data. *** Percentage change compared with the same quarter of the previous year calculated from working-day adjusted data. **** Growth rates are calculated using the trend component.
- 3. 1. The euro area (EA17) includes Belgium, Germany, Estonia, Ireland, Greece, Spain, France, Italy, Cyprus, Luxembourg, Malta, the Netherlands, Austria, Portugal, Slovenia, Slovakia and Finland. The EU27 includes Belgium, Bulgaria, the Czech Republic, Denmark, Germany, Estonia, Ireland, Greece, Spain, France, Italy, Cyprus, Latvia, Lithuania, Luxembourg, Hungary, Malta, the Netherlands, Austria, Poland, Portugal, Romania, Slovenia, Slovakia, Finland, Sweden and the United Kingdom. 2. European quarterly national accounts are compiled in accordance with the European System of Accounts 1995 (ESA95). The flash estimate of first quarter 2013 GDP growth presented in this release is based on Member States’ data as available, covering 97% of EA17 GDP (93% of EU27 GDP). For more details of the flash methodology please refer to News Release 55/2003 of 15 May 2003. Data on previous revisions showing that the flash estimation procedure is reliable are available on the Eurostat website: http://epp.eurostat.ec.europa.eu/portal/page/portal/national_accounts/methodology/quarterly_accounts. With the flash estimate, euro area and EU GDP figures for earlier quarters are not revised. All figures presented in this release may be revised with the second estimate of GDP scheduled for 5 June 2013. Issued by: Eurostat Press Office Tim ALLEN Tel: +352-4301-33 444 eurostat-pressoffice@ec.europa.eu Eurostat news releases on the internet: http://ec.europa.eu/eurostat For further information on data: Christine GERSTBERGER Tel: +352-4301-30 175 Luis BIEDMA Tel: +352-4301-34 728 estat-gdp-query@ec.europa.eu Selected Principal European Economic Indicators: http://ec.europa.eu/eurostat/euroindicators