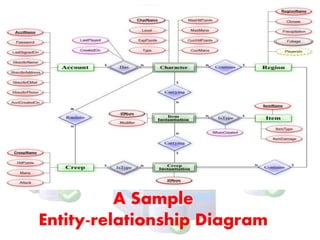
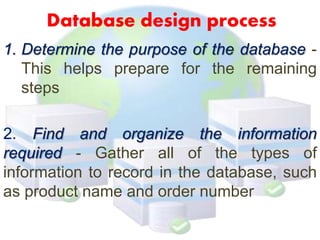
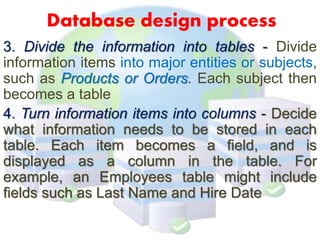
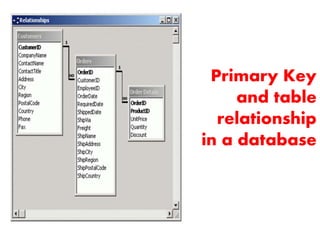
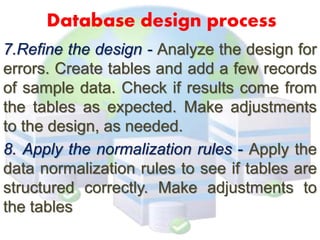
The document discusses database design and related concepts. It begins by defining database design as the logical design of data structures used to store data, such as tables and views in a relational database. It also notes database design involves determining relationships between data elements and structuring data based on these relationships. The document then discusses entity-relationship (ER) diagrams as a tool for efficiently designing databases and includes an example ER diagram. It also outlines the typical steps in the database design process, including determining data types and relationships, structuring data into tables, and applying normalization rules.
The document discusses database design and the design process. It explains that database design involves determining the logical structure of tables and relationships between data elements. The design process consists of steps like determining relationships between data, dividing information into tables, specifying primary keys, and applying normalization rules. The document also covers entity-relationship diagrams and designing inputs and outputs, including input controls and designing report formats.
The document provides an overview of the proposed press management system project. It discusses the existing manual system and its limitations including lack of immediate information storage and retrieval. The proposed system aims to address these limitations through a computerized system. It describes the scope of the project, system requirements, conceptual and detailed designs including modules for authors, customers, books, dealers, subscriptions and issues. Data flow diagrams are also discussed to model the flow of information through the system's processes.
This document provides an overview of data flow diagrams (DFDs), including their components, development process, and purposes. It describes DFDs as a technique for modeling system requirements and information flows. Key points:
- DFDs have four main components - processes, data stores, external entities, and data flows. They are developed at different levels of detail, starting with a high-level context diagram then more detailed lower levels.
- The development process involves gathering requirements, drawing a document flow diagram to define the system boundary, then creating DFDs showing information flows and processes within and outside the system.
- DFDs are used to discuss system processes with users, determine what the new system should
The document discusses various aspects of system design including:
1) System design involves defining elements like architecture, modules, components, interfaces and data flow. It decomposes a system into pieces to define how well they interact.
2) Key elements of a system include architecture, modules, components, interfaces and data. Architecture defines the system structure and behavior. Modules handle specific tasks. Components provide functions and interfaces define boundaries for information exchange.
3) System design takes inputs like requirements and proposed system specifications to produce the system design.
Structured system analysis and design Jayant Dalvi
The document discusses principles and guidelines for designing user interfaces, input, output, and forms for a structured system analysis and design. Some key points:
1. The user interface is the most important part of the system for users and should be informative, appealing, user-friendly, and attractive.
2. Input design involves data collection, validation, and ensuring the interface allows for efficient user interaction. Output design focuses on principles like simplicity, timeliness, and promoting decision making.
3. Guidelines for interface, input, output, and form design include considering objectives, contents, format, frequency, medium, and location. Validation checks and error detection are also important aspects of input design.
The document discusses the design phase of systems analysis and design. It explains that the design phase defines and structures the components of the final system solution. Key activities in design include designing the network, application architecture, user interfaces, system interfaces, database, and controls. The document provides details on client/server architecture, structure charts, entity relationship diagrams, and guidelines for designing user interfaces.
The document discusses system design and implementation. It describes the process of system design which includes system analysis to decompose a system into components. The key elements of a system are identified as architecture, modules, components, interfaces, and data. Logical and physical design approaches are compared. Logical design focuses on abstract representations while physical design translates schemas into actual database structures. Input, output, form, and test plan designs are also outlined.
Need for System Analysis
Stages in System Analysis
Structured SAD and tools :
DFD
Context Diagram
Decision Table
Structured Diagram.
System Development Models:
Water Flow
Prototype
Spiral
RAD
Roles and responsibilities of
System Analyst,
Database Administrator
Database Designer
Entity relationship modeling visually represents entities, attributes, and relationships using entity relationship diagrams (ERDs). Peter Chen developed the original ERD format in 1976. Over time, a relational format evolved and is used by popular data modeling tools. The IDEF1X standard also specifies a format for ERDs. Process models include flowcharts, function hierarchy diagrams, swim lane diagrams, and data flow diagrams. A CRUD matrix relates database entities to business processes.
The document discusses systems analysis and design. It explains that systems analysis involves analyzing existing systems within organizations to identify problems and improve efficiency. The stages of designing a new system are then outlined, including research, analysis, design, production, testing, documentation, implementation and evaluation. Various aspects of analyzing existing systems and designing new systems are then described in more detail, such as identifying inputs, outputs, and processes, specifying requirements, and designing data entry, validation, storage, outputs and system processes. Testing methods and strategies are also discussed.
It 302 computerized accounting (week 2) - sharifahalish sha
Here are some potential ways to represent relational databases other than using tables and relationships:
- Graph databases: Represent data as nodes, edges, and properties. Nodes represent entities, edges represent relationships between entities. Good for highly connected data.
- Document databases: Store data in flexible, JSON-like documents rather than rigid tables. Good for semi-structured or unstructured data.
- Multidimensional databases (OLAP cubes): Represent data in cubes with dimensions and measures. Good for analytical queries involving aggregation and slicing/dicing of data.
- Network/graph databases: Similar to graph databases but focus more on network properties like paths, connectivity etc. Good for social networks, recommendation systems.
-
The document outlines the objectives and key concepts covered in Chapter 14 of the textbook "Accounting Information Systems, 6th edition". The objectives include the in-house development phase of the SDLC, tools used such as CASE and PERT/Gantt charts, structured vs object-oriented design approaches, documentation types, and the commercial software option. It then covers the phases of SDLC in more detail including in-house development, commercial packages, and maintenance. Design approaches like structured and object-oriented are defined. Documentation, testing, training and post-implementation review are discussed as part of system delivery.
A flowchart is a diagram that depicts a process, system, or computer algorithm through visual symbols and arrows. It is used to document, study, plan, improve, and communicate complex processes. Common symbols in flowcharts include shapes like rectangles, ovals, and diamonds to represent steps, along with connecting arrows to show the flow and sequence. Flowcharts are widely applied in fields like business, manufacturing, education, and computer programming to analyze processes, identify inefficiencies, and communicate workflows.
The document discusses four main types of application architectures: data processing systems, transaction processing systems, event processing systems, and language processing systems. It describes the key characteristics of each type, including their common components and structures. For example, it notes that data processing systems operate in batches and have an input-process-output structure, while transaction processing systems allow remote database access and updating by multiple users.
This document outlines the topics covered in various units of a database course, including query basics, joins, forms and reports design, transactions, data storage methods, and distributed applications. Key concepts discussed are form and report layout, creating forms and reports, graphical objects, PL/SQL, triggers, error handling, application structure, and table operations. Data storage methods covered include sequential storage, pointers, indexes, linked lists, B-trees, hash tables, and centralized vs distributed storage models like RAID.
The document discusses the process of analyzing client requirements for a new system. This includes gathering information from clients, clarifying needs, structuring requirements, and confirming with clients that all functional, quality, and other needs have been identified correctly and fall within the project scope. The key steps are analyzing the information gathered, documenting the requirements, and obtaining final sign-off from stakeholders to finalize the requirements document.
This document discusses function-oriented design and compares it to object-oriented design. It begins by explaining function-oriented design and how a system is decomposed into a set of interacting functions that share a centralized system state. It then covers the key aspects of function-oriented design process, including:
1. Using data flow diagrams to model how data passes through the system.
2. Developing structure charts to show how high-level functions call lower-level subfunctions.
3. Creating detailed design descriptions and interface specifications for each function in a data dictionary.
An example of an ATM system is used to illustrate the function-oriented design process. The document concludes by comparing function-oriented and
The document discusses information management concepts including data versus information, characteristics of valuable information, and information technology components. It defines an information system as a set of interrelated components that collect, process, and disseminate data and information with feedback. It also discusses manual versus computerized information systems and key technology infrastructure elements like hardware, software, databases, telecommunications, people, and procedures.
Generic application architectures help categorize systems into common types including data processing systems, transaction processing systems, event processing systems, and language processing systems. Data processing systems operate in batches to process input data and output results without user intervention. Transaction processing systems allow multiple users to access and update a shared database. Event processing systems like editors must rapidly respond to unpredictable user events by modifying an in-store data structure. Language processing systems translate or interpret a specified language into another representation.
Outsourcing insurance data entry services is a great way to increase your productivity and reduce your operational costs. Data entry operators are skilled at capturing data from reliable sources and make entries in specific electronic formats that make retrieval easier and faster. Outsourcing partners have a high level of accuracy and customer service, which is a great benefit for insurers.
The document discusses the design phase of the system development life cycle. It describes the objectives and steps of the design phase, which include presenting design alternatives, converting logical models to physical models, designing the system architecture, making hardware and software selections, and designing inputs, outputs, data storage, and programs. Common design strategies like custom development, packaged systems, and outsourcing are also covered. The document then explains various system design methods and the stages of system design, including logical, physical, and program design. Finally, it discusses avoiding common design mistakes.
The document discusses the Software Development Life Cycle (SDLC), which is a process used in software engineering to design, develop, and test high-quality software. It describes the main phases of SDLC as planning, defining, designing, building, and testing. Key activities in each phase like feasibility study, requirement analysis, prototyping are explained. Various tools used for system analysis and design such as data flow diagrams, flow charts are also outlined.
Here we uploaded E workshop system design with complete details. This details helpful for students who are freshers. Even software developers can refer this document. For project source code visit www.studentprojectguide.com
The document discusses data dictionaries, which collect and define data terms to provide documentation and eliminate redundancy. A data dictionary includes information about the data maintained by a system. It relates to data flow diagrams by defining the categories of data flows, structures, elements and stores. It also provides examples of how to describe data flows, structures, elements, stores and the relationships between them. The data dictionary is used to generate code, create screens/reports, and analyze system design.
This document discusses various modeling techniques used in structured systems analysis, including:
1) Data flow diagrams and system flowcharts are used to model system functions and data flows.
2) Entity-relationship diagrams and data dictionaries are used to model stored data and define data elements.
3) The purpose of these modeling techniques is to provide precise, understandable definitions of the system to both users and developers.
The document discusses how to determine technical requirements within an IT environment. It describes identifying technical requirements by assessing business problems and opportunities, documenting input/output, interface and process requirements, and investigating products to meet requirements. Requirements include assessing business problems, identifying solutions, and documenting results. Common interfacing methods like EDI and XML are also discussed.
This document discusses various types of diagrams and design phases used in software development lifecycle. It describes entity-relationship diagrams, data flow diagrams, logical design, physical design, architectural design, detailed design, testing strategies, unit testing, integration testing and functional testing. The key aspects covered are modeling entities and relationships, inputs/outputs, data flows, user requirements, interfaces, processes, databases and testing at different stages of development.
The document discusses business modeling and how modeling systems can help businesses redesign processes to cut costs. It states that a business model must be adaptable to changing customer needs and priorities. The modeling system allows businesses to link IT systems to organizational information and processes in a relational way to facilitate redesigning processes.
Similar to essentialofdatabasedesign-141203001046-conversion-gate01.pdf (20)
Global Situational Awareness of A.I. and where its headedvikram sood
You can see the future first in San Francisco.
Over the past year, the talk of the town has shifted from $10 billion compute clusters to $100 billion clusters to trillion-dollar clusters. Every six months another zero is added to the boardroom plans. Behind the scenes, there’s a fierce scramble to secure every power contract still available for the rest of the decade, every voltage transformer that can possibly be procured. American big business is gearing up to pour trillions of dollars into a long-unseen mobilization of American industrial might. By the end of the decade, American electricity production will have grown tens of percent; from the shale fields of Pennsylvania to the solar farms of Nevada, hundreds of millions of GPUs will hum.
The AGI race has begun. We are building machines that can think and reason. By 2025/26, these machines will outpace college graduates. By the end of the decade, they will be smarter than you or I; we will have superintelligence, in the true sense of the word. Along the way, national security forces not seen in half a century will be un-leashed, and before long, The Project will be on. If we’re lucky, we’ll be in an all-out race with the CCP; if we’re unlucky, an all-out war.
Everyone is now talking about AI, but few have the faintest glimmer of what is about to hit them. Nvidia analysts still think 2024 might be close to the peak. Mainstream pundits are stuck on the wilful blindness of “it’s just predicting the next word”. They see only hype and business-as-usual; at most they entertain another internet-scale technological change.
Before long, the world will wake up. But right now, there are perhaps a few hundred people, most of them in San Francisco and the AI labs, that have situational awareness. Through whatever peculiar forces of fate, I have found myself amongst them. A few years ago, these people were derided as crazy—but they trusted the trendlines, which allowed them to correctly predict the AI advances of the past few years. Whether these people are also right about the next few years remains to be seen. But these are very smart people—the smartest people I have ever met—and they are the ones building this technology. Perhaps they will be an odd footnote in history, or perhaps they will go down in history like Szilard and Oppenheimer and Teller. If they are seeing the future even close to correctly, we are in for a wild ride.
Let me tell you what we see.
06-04-2024 - NYC Tech Week - Discussion on Vector Databases, Unstructured Data and AI
Round table discussion of vector databases, unstructured data, ai, big data, real-time, robots and Milvus.
A lively discussion with NJ Gen AI Meetup Lead, Prasad and Procure.FYI's Co-Found
Analysis insight about a Flyball dog competition team's performanceroli9797
Insight of my analysis about a Flyball dog competition team's last year performance. Find more: https://github.com/rolandnagy-ds/flyball_race_analysis/tree/main
4th Modern Marketing Reckoner by MMA Global India & Group M: 60+ experts on W...Social Samosa
The Modern Marketing Reckoner (MMR) is a comprehensive resource packed with POVs from 60+ industry leaders on how AI is transforming the 4 key pillars of marketing – product, place, price and promotions.
ViewShift: Hassle-free Dynamic Policy Enforcement for Every Data LakeWalaa Eldin Moustafa
Dynamic policy enforcement is becoming an increasingly important topic in today’s world where data privacy and compliance is a top priority for companies, individuals, and regulators alike. In these slides, we discuss how LinkedIn implements a powerful dynamic policy enforcement engine, called ViewShift, and integrates it within its data lake. We show the query engine architecture and how catalog implementations can automatically route table resolutions to compliance-enforcing SQL views. Such views have a set of very interesting properties: (1) They are auto-generated from declarative data annotations. (2) They respect user-level consent and preferences (3) They are context-aware, encoding a different set of transformations for different use cases (4) They are portable; while the SQL logic is only implemented in one SQL dialect, it is accessible in all engines.
#SQL #Views #Privacy #Compliance #DataLake
Enhanced Enterprise Intelligence with your personal AI Data Copilot.pdfGetInData
Recently we have observed the rise of open-source Large Language Models (LLMs) that are community-driven or developed by the AI market leaders, such as Meta (Llama3), Databricks (DBRX) and Snowflake (Arctic). On the other hand, there is a growth in interest in specialized, carefully fine-tuned yet relatively small models that can efficiently assist programmers in day-to-day tasks. Finally, Retrieval-Augmented Generation (RAG) architectures have gained a lot of traction as the preferred approach for LLMs context and prompt augmentation for building conversational SQL data copilots, code copilots and chatbots.
In this presentation, we will show how we built upon these three concepts a robust Data Copilot that can help to democratize access to company data assets and boost performance of everyone working with data platforms.
Why do we need yet another (open-source ) Copilot?
How can we build one?
Architecture and evaluation
2. Database Design
It can be used to describe many different
parts of the design of an overall database
system
Principally, and most correctly, it can be
thought of as the logical design of the
base data structures used to store the
data
3. Database Design
In the relational model these are the tables and
views. In an object database the entities and
relationships map directly to object classes and
named relationships
However, the term database design could also be
used to apply to the overall process of designing,
not just the base data structures, but also the
forms and queries used as part of the overall
database application within the database
management system
4. Database Design
The process of doing database design
generally consists of a number of steps which
will be carried out by the database designer.
Usually, the designer must:
Determine the relationships between the different
data elements
Overlay a logical structure upon the data on the
basis of these relationships
5. ER Diagram (Entity Relationship Diagram)
Database designs also include ER (entity-
relationship model) diagrams
An ER diagram is a diagram that helps to
design databases in an efficient way
Attributes in ER diagrams are usually modeled
as an oval with the name of the attribute, linked
to the entity or relationship that contains the
attribute
6. ER Diagram (Entity Relationship Diagram)
Database designs also include ER (entity-
relationship model) diagrams
An ER diagram is a diagram that helps to
design databases in an efficient way
Attributes in ER diagrams are usually modeled
as an oval with the name of the attribute, linked
to the entity or relationship that contains the
attribute
8. Database design process
1. Determine the purpose of the database -
This helps prepare for the remaining
steps
2. Find and organize the information
required - Gather all of the types of
information to record in the database, such
as product name and order number
9. Database design process
3. Divide the information into tables - Divide
information items into major entities or subjects,
such as Products or Orders. Each subject then
becomes a table
4. Turn information items into columns - Decide
what information needs to be stored in each
table. Each item becomes a field, and is
displayed as a column in the table. For
example, an Employees table might include
fields such as Last Name and Hire Date
10. Database design process
5. Specify primary keys - Choose each table’s
primary key. The primary key is a column, or a
set of columns, that is used to uniquely identify
each row. An example might be Product ID or
Order ID.
6. Set up the table relationships - Look at each
table and decide how the data in one table is
related to the data in other tables. Add fields to
tables or create new tables to clarify the
relationships, as necessary.
12. Database design process
7.Refine the design - Analyze the design for
errors. Create tables and add a few records
of sample data. Check if results come from
the tables as expected. Make adjustments
to the design, as needed.
8. Apply the normalization rules - Apply the
data normalization rules to see if tables are
structured correctly. Make adjustments to
the tables
14. Input Integrity Controls
Use with all input mechanism from specific
electronic device to standard keyboard inputs
Additional level of verification that helps reduce
errors on input data
For example a system need a certain amount of
information for a valid entry, but an input device
cannot ensure that all the necessary fields have
been entered
An additional level of verification, which will call a
control is necessary to check for completeness
15. Common input control techniques
Error Detection and Elimination
Field Combination Control. Verifies data in
one field based on data in another field or
fields
Value limit Control. Identify when a value in a
field is too large or too small
Completeness Control. Ensures all necessary
fields in an input form have been entered
Data validation Control. Validate the input data
for correctness and appropriateness
16. Common input control techniques
Transaction Logging
A technique by which any update to the
database is logged with audit information
such as user ID, date, time, input data, and
type of update
So that it can trace any errors or problems
that occur. The more advanced database
systems- such as those that run on servers,
workstations, and mainframes
17. Common Input Control techniques
Transaction Logging
It has 2 main objective:
Helps discourage fraudulent transactions, If person
knows that every transaction is logged, then that
person is less apt to attempt a fraudulent
transaction
Provide recovery mechanism for erroneous
transaction, more sophisticated systems can
provide a “before” and “after” image of he field
that are change by the transaction, as well as audit
trail of all transactions. Typically used only for
highly sensitive or critical data files, but they do
represent an important control mechanism that is
available when necessary
18. Output Integrity Control
Output from a system comes in various
forms such as output that is used by
other systems, printed reports, and
data output on computer screens.
The main purpose of it is to ensure
that output arrives at the proper
destination and is correct,
accurate, current, and complete.
19. Destination Control
Ensure that output information is channeled to the
correct person
Systems with good controls printed
destination and routing information on a
report cover page along with the report
Today ,business accomplish the same
function of a control desk by placing
printers in each of the locations that need
printed reports
20. Completeness, Accuracy and
Correctness Control
This are the main function primarily of the
internal processing of the system rather than
any set of controls
To ensure this, printing of control fields on
the output report
Every report must have a date and time
stamp, both for the time the report was
printed and the date of the report is
reprinted due to previous error
21. Completeness, Accuracy and
Correctness Control
The following items are controls that should
be printed on reports:
Date and time of report printing
Date and time of data on the report
Time period covered by the report
Beginning header with report identification and
description
Destination of routing information
Pagination in the form “page-of-”
Control totals and cross footings
“End of Report” trailer
Report version number and version date
22. Design of System Inputs
When designing inputs for the
system, the system developer
must perform four tasks:
o Identify the devices and mechanisms
that will be used to enter inputs
o Identify all system inputs and develop a
list with data content of each
o Design and prototype the electronic
forms(the window the user works with)
and other inputs
23. Design of System Inputs
Identifying Device Mechanism
Often when analysts begin developing a system,
they assume that all input will be entered via
electronic, graphical forms because they are now
so common on a personal computers and
workstations
All data must be error-free, it must be validated;
avoid reentering the information as much as
possible avoid human involvement
24. Identifying device mechanism
Devices that allow data captured without
human keystroking:
Magnetic Card strip readers
Bar Code readers
Optical-character recognition reader and
scanner
Touch screens and devices
Electronic pens and writing surfaces
Digitizers, such as digital cameras and
digital audio devices
25. Developing list of Inputs
and data requirement
Provides check of the quality of analysis
models
It also identify the flows that cross the
system boundary
Analysis Model: Structured approach and
Object Oriented Approach
26. Developing list of Inputs
and data requirement
Structured Approach
The first task is to define the automation
boundary
The point is not all processing done with
computer, However, the input data flows
crossing the boundary are clearly defined,
so the required inputs will be the new order
information data flow
28. Developing list of Inputs
and data requirement
Object Oriented Approach
Sequence diagrams identify each incoming
message, and the Design class diagrams
contain the pseudocode to verify the
characteristic of the input
29. Developing list of Inputs
and data requirement
Object Oriented Approach
Sequence diagram
30. Developing list of Inputs
and data requirement
Object Oriented Approach
Design class diagrams
31. Designing and
Prototyping Input Forms
Good design principles dictate that the
paper form and its electronic
counterpart should have the same
general layout and sequence of data
fields
In other words, this will be use to
enter the information into the system
32. Designing of System Outputs
Determining type of output
Making list of specific reports
based on the application design
Designing and prototyping reports
33. Designing of System Outputs
Determining Type of Output
Detailed Report
Carry out the day-to-day processing of the
business, contain detailed information about the
transaction
Summary Report
Recaps or summarize detailed information over
a period of time or some category
Exception Report
A Report that contains only information about
nonstandard, conditions
Executive Report
A report use for information resources that is
normally used for strategic decisions
34. Designing of System Outputs
Making list of specific report
o The objective is to ensure that each of
the required outputs from the system is
specified correctly
o Whereas the data content of the input
forms must support the needs of the
database, the data content of the
outputs must support the information
requirements of the report users.
35. Designing of System Outputs
Designing and Prototyping Reports
o Key principles during design of output reports:
What is the objective of the report? Who is the
intended audience?
o Designer must decide on the level of detail and
format of the report, they can decide if they know
the objective of the report
o Labels and headings should be used to ensure the
correct interpretation of the report data and
make sure that every report must have a
meaningful title to indicate data content.
36. Output Design Objectives
Output is information delivered to users through
information system by the ways of networks
Some data require extensive processing before they
become suitable output
Output can take many forms; Traditional hard copy
of printed reports and soft copy such as computer
screens, microforms and audio output
To create most useful output possible, system
analyst works closely with the user through an
interactive process until the result is considered to
be satisfactory
37. 6 Objectives for Output Design
Designing output to serve a specific purpose
Making output meaningful to the user
Delivering the appropriate quantity of output
Providing appropriate output distribution
Providing output on time
Choosing the most effective output method
38. Objectives for Output design
Designing output to serve a specific purpose
o Output is designed based on the
purpose that the system analyst find
out during information requirement
determination phase of analysis
39. Objectives for Output design
Designing output to fit the user
o It is more practical to create user-specific or user-
customizable output when designing for a decision
support system or highly interactive applications
such as those mounted on the web
o On the basis of interview, observation, cost
considerations and perhaps prototypes, it will be
possible to design output that addresses what
many, if not all, users need and prefer.
40. Objectives for Output design
Delivering appropriate Quantity of Output
o More is not always better, especially where the
amount of output is concerned. Part of the task of
designing output is deciding what quantity of
output is correct from users
o The Problem with information overload is so
prevalent as to have become a cliché, but it
remains a valid concern
o No one is served if excess information is given
only to flaunt the capabilities of the system
41. Objectives for Output design
Making sure the output is where it is needed
o Output is often produced at one location(for
example, in the data-processing department)
and then distributed to the user
o Appropriate distribution is still an important
objective for the system analyst, to be used
and useful, output must be presented to the
right user
42. Objectives for Output design
Providing output on time
o Many reports are required on a daily basis,
some only monthly, other annually, and others
only by exception
o Using well-publicized Web-based output can
alleviate some problems with the timing of
output distribution as well. Accurate timing of
output can be critical to business operation
43. Objectives for Output design
Choosing the right output method
o Output can come in many forms,
with the movement to online
systems, much output now appears
on display screen, and users have
the option of printing it out with
their own printer.
44. Output Technologies
Printer
Advantages: Affordable in most organization
Flexible in time, location, and capabilities
Handles large volume of outputs
Reaches many inexpensively
Highly reliable with little down time
Disadvantages: May be noisy, Compatibility problems
with computer software, May require special,
expensive supplies, Still requires operator intervention,
Depending on model, may be slow
45. Output Technologies
Display Screen
Advantages: Interactive, Works online, real-
time transmission, Quiet, Takes advantage of
computer capabilities for movement within
databases and files, Good for frequently
accessed
Disadvantages: Require cabling and setup space, Still
may require printed documentation, Can be expensive
if required for many users
46. Output Technologies
Audio Output
Advantages: Good for individual user, Transient
message, worker needs hands free, output is
highly relative
Disadvantages: Expensive to develop, needs dedicated
room where output will not interfere with other tasks,
has limited application
47. Output Technologies
DVD, CD-ROM, and CD-RW
Advantages: Has large capacity, Allow
multimedia output, has speedy retrieval, less
vulnerable to damage
Disadvantages: Expensive to develop, more difficult to
use on a network
48. Output Technologies
Electronic Output (email, faxes, and web pages)
Advantages: Reduces paper, can be updated
very easily, Eliminates “telephone tag”, can be
“broadcast”, can be more interactive
Disadvantages: Has generally lower resolution, Not
conducive to formatting, difficult to convey context of
messages (email), Web sites need diligent maintenance
49. Factors to considered
when choosing output technology
1. Who will use the output(requisite quality)?
2. How many people need the output?
3. Where is the output needed (distribution/ logistics)?
4. What is the purpose of output?
5. What is the speed with which output is needed?
6. How frequently will the output be accessed?
7. How long will(or must) the output be stored?
8. Under what special regulation is the output produced, stored, and
distributed?
9. What are the initial and ongoing costs of maintenance supplies?
10. What are the environmental requirements (noise absorption, controlled
temperature, space for equipment, and cabling) for output technologies?