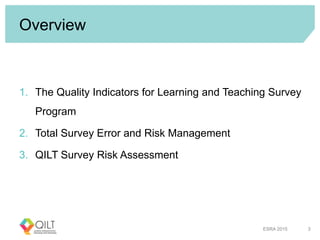
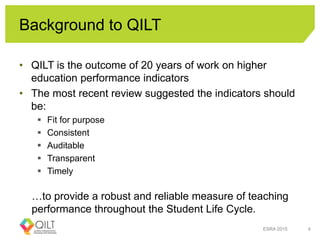
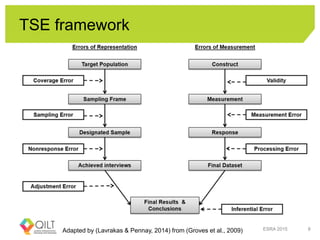
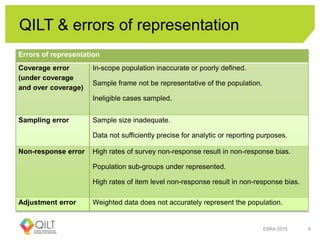
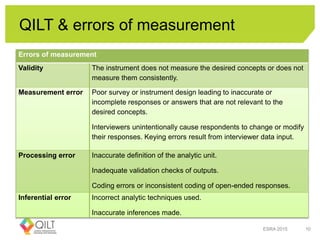
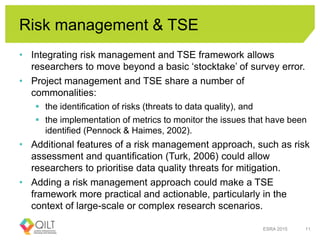
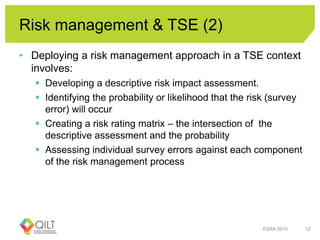
Total Survey Error across a program of three
national surveys:
using a risk management approach to
prioritise error mitigation strategies
Sonia Whiteley
The Australian Centre for Applied Social Research Methods &
The Social Research Centre
European Survey Research Association Conference
Reykjavik, Iceland 2015
About the Australian Centre for Applied
Social Research Methods
• The Australian Centre for Applied Social Research
Methods (AusCen) provides national leadership in social
research methods and training by:
 Building a world-class team of researchers and graduate students
in social research methodology, applications and techniques
 Developing and validating new and cost-effective data collection
methods
 Increasing the availability and access to secondary data for
research across Australia, and
 Producing a more sophisticated Australian skills base via training
and educational activities.
ESRA 2015 2
Overview
1. The Quality Indicators for Learning and Teaching Survey
Program
2. Total Survey Error and Risk Management
3. QILT Survey Risk Assessment
ESRA 2015 3
Background to QILT
• QILT is the outcome of 20 years of work on higher
education performance indicators
• The most recent review suggested the indicators should
be:
 Fit for purpose
 Consistent
 Auditable
 Transparent
 Timely
…to provide a robust and reliable measure of teaching
performance throughout the Student Life Cycle.
ESRA 2015 4
Our role in QILT
• The Social Research Centre was commissioned by the
Department of Education and Training as the independent
administrator of QILT.
This involves:
 Collecting data
 Reporting on survey outcomes
 Creating, monitoring and updating the QILT website.
ESRA 2015 5
What are the QILT surveys?
• The QILT program consists of:
 University Experience Survey (UES) - measuring the engagement
of current students with the higher education system
 Graduate Outcomes Survey (GOS) – examining graduates’ labour
market outcomes, and
 Employer Satisfaction Survey (ESS) – assessing the employer’s
opinion of the graduates’ generic skills and work readiness.
ESRA 2015 6
What are the QILT surveys? (2)
• The QILT survey suite focuses on:
 Commencing and completing undergraduate university students –
University Experience Survey (UES)
 University graduates – Graduate Outcomes Survey (GOS)
 Employers of recent university graduates – Employers Satisfaction
Survey (ESS)
• All are cross sectional, point-in-time surveys except
the GOS, which is longitudinal.
ESRA 2015 7
TSE framework
Adapted by (Lavrakas & Pennay, 2014) from (Groves et al., 2009) ESRA 2015 8
QILT & errors of representation
ESRA 2015 9
Errors of representation
Coverage error
(under coverage
and over coverage)
In-scope population inaccurate or poorly defined.
Sample frame not be representative of the population.
Ineligible cases sampled.
Sampling error Sample size inadequate.
Data not sufficiently precise for analytic or reporting purposes.
Non-response error High rates of survey non-response result in non-response bias.
Population sub-groups under represented.
High rates of item level non-response result in non-response bias.
Adjustment error Weighted data does not accurately represent the population.
QILT & errors of measurement
ESRA 2015 10
Errors of measurement
Validity The instrument does not measure the desired concepts or does not
measure them consistently.
Measurement error Poor survey or instrument design leading to inaccurate or
incomplete responses or answers that are not relevant to the
desired concepts.
Interviewers unintentionally cause respondents to change or modify
their responses. Keying errors result from interviewer data input.
Processing error Inaccurate definition of the analytic unit.
Inadequate validation checks of outputs.
Coding errors or inconsistent coding of open-ended responses.
Inferential error Incorrect analytic techniques used.
Inaccurate inferences made.
Risk management & TSE
• Integrating risk management and TSE framework allows
researchers to move beyond a basic ‘stocktake’ of survey error.
• Project management and TSE share a number of
commonalities:
 the identification of risks (threats to data quality), and
 the implementation of metrics to monitor the issues that have been
identified (Pennock & Haimes, 2002).
• Additional features of a risk management approach, such as risk
assessment and quantification (Turk, 2006) could allow
researchers to prioritise data quality threats for mitigation.
• Adding a risk management approach could make a TSE
framework more practical and actionable, particularly in the
context of large-scale or complex research scenarios.
ESRA 2015 11
Risk management & TSE (2)
• Deploying a risk management approach in a TSE context
involves:
 Developing a descriptive risk impact assessment.
 Identifying the probability or likelihood that the risk (survey
error) will occur
 Creating a risk rating matrix – the intersection of the
descriptive assessment and the probability
 Assessing individual survey errors against each component
of the risk management process
ESRA 2015 12
Descriptive risk impact assessment
ESRA 2015 13
Potential impact Description
Critical A survey error that would compromise data quality to the
point that it was no longer fit for purpose, exceed the
available budget or fail to meet key reporting deadlines.
Serious A survey error that would cause major data quality
problems, budget overruns or timeline increases.
Moderate A survey error that would cause moderate data quality
problems, budget overruns or timeline increases.
Minor A survey error that would cause minor data quality
problems, budget overruns or timeline increases.
Insignificant A survey error that would have no effect on data quality,
the available budget or the timeline.
Likelihood of risk occurrence
ESRA 2015 14
Probability range Likelihood
0-10% Very unlikely to occur
11-40% Unlikely to occur
41-60% Neither unlikely nor likely to occur
61-90% Likely to occur
91-100% Very likely to occur
Issues to consider…
• Subjectivity of the risk assessment & subjectivity of the
likelihood of occurrence
• Development of the risk matrix is ideally a collaborative
exercise
• The purpose is to initiate discussions, uncover
assumptions and prioritise activities rather than provide a
definitive estimate of risk
ESRA 2015 15
QILT Survey Error Risk Rating Matrix
QILT Overview 16
Insignificant Minor Moderate Serious Critical
0-10% Low Low Low Low High
11-40% Low Low Low Medium High
41-60% Low Low Medium Medium High
61-90% Low Medium Medium High High
91-100% Low Medium High High High
Applying the risk matrix
• Each of the QILT surveys is examined individually and
 The nature of each of the survey errors is described
 The impact of the survey error is identified
 The likelihood that the survey error will occur is determined
 A final risk rating is determined from the risk matrix
• Risk rating are created for all of the surveys and
summarised
QILT Overview 17
UES original risk assessment
QILT Overview 18
Source of error Impact Likelihood Risk rating
Errors of representation
Coverage error Moderate 100% High
Sampling error Moderate 95% High
Non-response error Moderate 75% Medium
Adjustment error - - -
Errors of measurement
Validity Serious 10% Low
Measurement error Serious 20% Medium
Processing error Moderate 10% Low
Inferential error Minor 10% Low
UES revised risk assessment
QILT Overview 19
Source of error Impact Likelihood Risk rating
Errors of representation
Coverage error Moderate 10% Low
Sampling error Moderate 20% Low
Non-response error Moderate 50% Medium
Adjustment error - - -
Errors of measurement
Validity Serious 20% Medium
Measurement error Serious 40% Medium
Processing error Moderate 10% Low
Inferential error Minor 10% Low
QILT Survey Program Risk Assessment Matrix
ESRA 2015 20
UES GOS ESS
Errors of representation
Coverage error Low Low High
Sampling error Low Low Low
Non-response error Medium High Medium
Adjustment error - - -
Errors of measurement
Validity Medium Medium Medium
Measurement error Medium Medium Medium
Processing error Low Low Low
Inferential error Low Low Low
Prioritising areas for action
• Examining the risk profiles together suggests:
 Non-response error appears to be the ‘hotspot’ for survey error risk.
Can successful risk mitigation strategies be applied across the
program to save time, effort and expense?
 Errors of measurement, could be relatively cost effective to address
and seem to be a good candidate for mitigation across the surveys.
 The GOS and the ESS require more attention to maximise data
quality than the UES. Research resources should be allocated
accordingly.
 The high risk associated with non-response error for the GOS has
the potential to exacerbate the high risk identified in relation to
coverage error for the ESS.
ESRA 2015 21
Why integrate TSE & risk management?
• While the integration of the TSE framework and a risk
management approach does not provide specific details
about how to minimise survey error, it does offer a means
to:
 Identify which survey errors have the potential to present the
greatest threat to data quality, budget and timelines,
 Prioritise survey error mitigation activities,
 Examine TSE across a larger survey program, and
 Summarise TSE concerns for discussion with non-
researchers.
ESRA 2015 22
To summarise…
Combining a Total Survey Error framework and a risk
management approach has the potential to make TSE more
practical, actionable and easier for non-researchers
(funders!) to understand.
ESRA 2015 23
Thank you for listening!
Questions?
sonia.whiteley@srcentre.com.au
ESRA 2015 24

Total Survey Error across a program of three national surveys: using a risk management approach to prioritise error mitigation strategies

  • 1.
    Total Survey Erroracross a program of three national surveys: using a risk management approach to prioritise error mitigation strategies Sonia Whiteley The Australian Centre for Applied Social Research Methods & The Social Research Centre European Survey Research Association Conference Reykjavik, Iceland 2015
  • 2.
    About the AustralianCentre for Applied Social Research Methods • The Australian Centre for Applied Social Research Methods (AusCen) provides national leadership in social research methods and training by:  Building a world-class team of researchers and graduate students in social research methodology, applications and techniques  Developing and validating new and cost-effective data collection methods  Increasing the availability and access to secondary data for research across Australia, and  Producing a more sophisticated Australian skills base via training and educational activities. ESRA 2015 2
  • 3.
    Overview 1. The QualityIndicators for Learning and Teaching Survey Program 2. Total Survey Error and Risk Management 3. QILT Survey Risk Assessment ESRA 2015 3
  • 4.
    Background to QILT •QILT is the outcome of 20 years of work on higher education performance indicators • The most recent review suggested the indicators should be:  Fit for purpose  Consistent  Auditable  Transparent  Timely …to provide a robust and reliable measure of teaching performance throughout the Student Life Cycle. ESRA 2015 4
  • 5.
    Our role inQILT • The Social Research Centre was commissioned by the Department of Education and Training as the independent administrator of QILT. This involves:  Collecting data  Reporting on survey outcomes  Creating, monitoring and updating the QILT website. ESRA 2015 5
  • 6.
    What are theQILT surveys? • The QILT program consists of:  University Experience Survey (UES) - measuring the engagement of current students with the higher education system  Graduate Outcomes Survey (GOS) – examining graduates’ labour market outcomes, and  Employer Satisfaction Survey (ESS) – assessing the employer’s opinion of the graduates’ generic skills and work readiness. ESRA 2015 6
  • 7.
    What are theQILT surveys? (2) • The QILT survey suite focuses on:  Commencing and completing undergraduate university students – University Experience Survey (UES)  University graduates – Graduate Outcomes Survey (GOS)  Employers of recent university graduates – Employers Satisfaction Survey (ESS) • All are cross sectional, point-in-time surveys except the GOS, which is longitudinal. ESRA 2015 7
  • 8.
    TSE framework Adapted by(Lavrakas & Pennay, 2014) from (Groves et al., 2009) ESRA 2015 8
  • 9.
    QILT & errorsof representation ESRA 2015 9 Errors of representation Coverage error (under coverage and over coverage) In-scope population inaccurate or poorly defined. Sample frame not be representative of the population. Ineligible cases sampled. Sampling error Sample size inadequate. Data not sufficiently precise for analytic or reporting purposes. Non-response error High rates of survey non-response result in non-response bias. Population sub-groups under represented. High rates of item level non-response result in non-response bias. Adjustment error Weighted data does not accurately represent the population.
  • 10.
    QILT & errorsof measurement ESRA 2015 10 Errors of measurement Validity The instrument does not measure the desired concepts or does not measure them consistently. Measurement error Poor survey or instrument design leading to inaccurate or incomplete responses or answers that are not relevant to the desired concepts. Interviewers unintentionally cause respondents to change or modify their responses. Keying errors result from interviewer data input. Processing error Inaccurate definition of the analytic unit. Inadequate validation checks of outputs. Coding errors or inconsistent coding of open-ended responses. Inferential error Incorrect analytic techniques used. Inaccurate inferences made.
  • 11.
    Risk management &TSE • Integrating risk management and TSE framework allows researchers to move beyond a basic ‘stocktake’ of survey error. • Project management and TSE share a number of commonalities:  the identification of risks (threats to data quality), and  the implementation of metrics to monitor the issues that have been identified (Pennock & Haimes, 2002). • Additional features of a risk management approach, such as risk assessment and quantification (Turk, 2006) could allow researchers to prioritise data quality threats for mitigation. • Adding a risk management approach could make a TSE framework more practical and actionable, particularly in the context of large-scale or complex research scenarios. ESRA 2015 11
  • 12.
    Risk management &TSE (2) • Deploying a risk management approach in a TSE context involves:  Developing a descriptive risk impact assessment.  Identifying the probability or likelihood that the risk (survey error) will occur  Creating a risk rating matrix – the intersection of the descriptive assessment and the probability  Assessing individual survey errors against each component of the risk management process ESRA 2015 12
  • 13.
    Descriptive risk impactassessment ESRA 2015 13 Potential impact Description Critical A survey error that would compromise data quality to the point that it was no longer fit for purpose, exceed the available budget or fail to meet key reporting deadlines. Serious A survey error that would cause major data quality problems, budget overruns or timeline increases. Moderate A survey error that would cause moderate data quality problems, budget overruns or timeline increases. Minor A survey error that would cause minor data quality problems, budget overruns or timeline increases. Insignificant A survey error that would have no effect on data quality, the available budget or the timeline.
  • 14.
    Likelihood of riskoccurrence ESRA 2015 14 Probability range Likelihood 0-10% Very unlikely to occur 11-40% Unlikely to occur 41-60% Neither unlikely nor likely to occur 61-90% Likely to occur 91-100% Very likely to occur
  • 15.
    Issues to consider… •Subjectivity of the risk assessment & subjectivity of the likelihood of occurrence • Development of the risk matrix is ideally a collaborative exercise • The purpose is to initiate discussions, uncover assumptions and prioritise activities rather than provide a definitive estimate of risk ESRA 2015 15
  • 16.
    QILT Survey ErrorRisk Rating Matrix QILT Overview 16 Insignificant Minor Moderate Serious Critical 0-10% Low Low Low Low High 11-40% Low Low Low Medium High 41-60% Low Low Medium Medium High 61-90% Low Medium Medium High High 91-100% Low Medium High High High
  • 17.
    Applying the riskmatrix • Each of the QILT surveys is examined individually and  The nature of each of the survey errors is described  The impact of the survey error is identified  The likelihood that the survey error will occur is determined  A final risk rating is determined from the risk matrix • Risk rating are created for all of the surveys and summarised QILT Overview 17
  • 18.
    UES original riskassessment QILT Overview 18 Source of error Impact Likelihood Risk rating Errors of representation Coverage error Moderate 100% High Sampling error Moderate 95% High Non-response error Moderate 75% Medium Adjustment error - - - Errors of measurement Validity Serious 10% Low Measurement error Serious 20% Medium Processing error Moderate 10% Low Inferential error Minor 10% Low
  • 19.
    UES revised riskassessment QILT Overview 19 Source of error Impact Likelihood Risk rating Errors of representation Coverage error Moderate 10% Low Sampling error Moderate 20% Low Non-response error Moderate 50% Medium Adjustment error - - - Errors of measurement Validity Serious 20% Medium Measurement error Serious 40% Medium Processing error Moderate 10% Low Inferential error Minor 10% Low
  • 20.
    QILT Survey ProgramRisk Assessment Matrix ESRA 2015 20 UES GOS ESS Errors of representation Coverage error Low Low High Sampling error Low Low Low Non-response error Medium High Medium Adjustment error - - - Errors of measurement Validity Medium Medium Medium Measurement error Medium Medium Medium Processing error Low Low Low Inferential error Low Low Low
  • 21.
    Prioritising areas foraction • Examining the risk profiles together suggests:  Non-response error appears to be the ‘hotspot’ for survey error risk. Can successful risk mitigation strategies be applied across the program to save time, effort and expense?  Errors of measurement, could be relatively cost effective to address and seem to be a good candidate for mitigation across the surveys.  The GOS and the ESS require more attention to maximise data quality than the UES. Research resources should be allocated accordingly.  The high risk associated with non-response error for the GOS has the potential to exacerbate the high risk identified in relation to coverage error for the ESS. ESRA 2015 21
  • 22.
    Why integrate TSE& risk management? • While the integration of the TSE framework and a risk management approach does not provide specific details about how to minimise survey error, it does offer a means to:  Identify which survey errors have the potential to present the greatest threat to data quality, budget and timelines,  Prioritise survey error mitigation activities,  Examine TSE across a larger survey program, and  Summarise TSE concerns for discussion with non- researchers. ESRA 2015 22
  • 23.
    To summarise… Combining aTotal Survey Error framework and a risk management approach has the potential to make TSE more practical, actionable and easier for non-researchers (funders!) to understand. ESRA 2015 23
  • 24.
    Thank you forlistening! Questions? sonia.whiteley@srcentre.com.au ESRA 2015 24