This document is the second quarter 2005 shareholders' report for Erie Indemnity Company. Some key points:
- Net income increased 33.7% to $76.2 million compared to $57 million in the second quarter of 2004.
- Management fee revenue decreased slightly to $254.4 million.
- The statutory combined ratio for the property and casualty group improved to 87.9% from 93.2% in the second quarter of 2004.
- Average premiums per policy increased by 3.7% overall and the private passenger auto average increased by 2.4%.
erie insurance group 2005-first-quarter-reportfinance49
This document summarizes the first quarter 2005 financial results of Erie Indemnity Company. Key points include:
- Net income increased 16.5% to $57.8 million, up from $49.6 million in first quarter 2004.
- Management fee revenue grew 3.9% to $230.4 million.
- The Property and Casualty Group's direct written premium increased 1.2% to $971.8 million.
- Net investment income increased 17.9% to $22.8 million due to higher realized gains and equity earnings.
erie insurance group 2006-third-quarter-reportfinance49
- Erie Indemnity Company reported positive third quarter 2006 results, with net income increasing slightly and net operating income per share increasing 12.2% year-over-year.
- Direct written premiums for Erie's property/casualty subsidiaries decreased 4.2% due to rate reductions, however the policy retention ratio improved.
- The GAAP combined ratio for Erie's insurance underwriting operations improved significantly to 89.2% due to favorable development on prior year loss reserves.
erie insurance group 2006-second-quarter-reportfinance49
Erie Indemnity Company reported financial results for the second quarter of 2006. Net income decreased 26.1% to $56.3 million due to lower investment income and higher catastrophe losses. Direct written premiums decreased 4.5% to $1.0 billion due to rate decreases and shifts to lower premium policies. The combined ratio for the Property and Casualty Group increased to 92.3% from higher catastrophe losses. Management will continue monitoring market conditions and implementing rate reductions through 2006.
erie insurance group 2005-third-quarter-reportfinance49
Erie Indemnity Company reported financial results for the third quarter of 2005. Net income decreased 9.5% to $53 million compared to the same period in 2004. Management fee revenue, which Erie receives from providing services to its property and casualty subsidiaries, decreased 2.9% due to lower direct written premiums and a slightly lower management fee rate. The property and casualty subsidiaries reported a higher combined ratio of 85.9% compared to 83% in the prior year, as favorable reserve adjustments in prior periods were not repeated. However, the company did not experience any losses from Hurricanes Katrina and Rita. Erie will continue efforts to enhance its competitive positioning and profitability.
erie insurance group 2007-third-quarter-reportfinance49
- Erie Indemnity delivered good third quarter results driven by strong underwriting and investment performances. Direct written premium remained flat due to increases in policies in force and retention rate, despite rate reductions.
- Net income increased 1.3% to $53.5 million compared to the same period last year. However, results were affected by $8 million in charges.
- The property and casualty insurance group seeks to insure standard risks through independent agencies in several midwestern and mid-atlantic states. Management fee revenue increased slightly while gross margins from management operations decreased.
erie insurance group 2007-second-quarter-reportfinance49
- Erie Indemnity Company reported strong financial results for the second quarter of 2007, with net income increasing 25.3% over the prior year.
- Management fee revenue grew 2.1% and direct written premiums for the Property and Casualty Group increased 0.9%.
- Underwriting results improved significantly, with the combined ratio decreasing from 99.4% to 84.8% due to favorable development of prior year loss reserves.
erie insurance group 2006-first-quarter-reportfinance49
The Erie Indemnity Company reported lower net income in the first quarter of 2006 compared to the same period in 2005, due to growth in management fee revenue being outpaced by growth in management operation costs. Direct written premiums for the Property and Casualty Group declined slightly while new written premium increased. The combined ratio for the Property and Casualty Group improved slightly. Investment income declined due to lower realized gains, while the Company continued share repurchases and dividend payments to shareholders in the quarter.
erie insurance group 2007-first-quarter-reportfinance49
The document summarizes Erie Indemnity Company's financial performance for the first quarter of 2007. Key points include:
- Net income increased nearly 14% year-over-year to $56.4 million. Management fee revenue declined slightly but margins remained steady.
- Property and Casualty Group policies in force grew 1.3% year-over-year and retention rates improved. However, direct written premiums declined due to rate reductions.
- Investment operations saw a 45% increase in net revenue due to strong limited partnership returns. However, net investment income declined slightly.
- The combined ratio was 89.2% compared to 86.5% in the prior year, impacted by
The document summarizes key concepts related to business, tax, and financial environments. It discusses the four main forms of business organization in the US - sole proprietorships, partnerships, corporations, and limited liability companies. It also covers topics like corporate and personal income taxes, depreciation, losses and gains. Additionally, it describes the financial markets and how funds flow in the economy through financial intermediaries and brokers. Key factors that influence expected security returns like risk, marketability, default risk, taxability, maturity, inflation and embedded options are also summarized.
This document provides an overview of the 10 Reasons Why endorsement that is automatically included on every Philadelphia Insurance Companies account. It includes limits of $50,000 each for various benefits, including business travel accident, donation assurance, and identity theft expense. It also includes a $25,000 limit for crisis management emergency response expenses. The document then summarizes 10 reasons for fitness studios to choose Philadelphia Insurance Companies, including general and professional liability coverage up to $1,000,000 per occurrence, coverage for contracted professionals, and property coverage for automatic external defibrillators up to $5,000.
Captives are insurance companies owned by their insureds that provide tailored coverage and help stabilize insurance costs. Forming a captive can reduce operating costs through eliminating normal insurer overhead and realizing investment income. The key advantages are reduced costs, investment income, broader coverage, pricing stability, and increased control over the risk management process. However, captives also require capitalization and ongoing administrative costs to operate successfully.
Active Capital Reinsurance Ltd commenced operations in 2007, mainly providing credit-related reinsurance solutions to financial institutions in Latin America, and it has a general insurance and reinsurance license issued in Barbados.
The document discusses various alternative risk financing strategies such as captive insurance, outlining key factors to consider when selecting a strategy, how captives are formed and structured, regulatory requirements for different captive types, and the multi-step process for establishing a captive insurance company.
The document discusses captives, which are special purpose insurance companies that insure the risks of their owners. It provides an overview of what captives are, their history and growth, types of captives, benefits of using a captive compared to commercial insurance, considerations for utilizing a captive such as ownership structure and domicile selection, and functions related to managing a captive.
Captive insurance companies allow businesses to insure their own risks. There are tax benefits to using a captive insurance company, including deducting premium payments and not paying tax on investment income up to certain thresholds. For example, a company formed a captive insurance company owned by shareholders to provide employee medical and disability insurance. This allowed a tax deduction for premiums and no tax on the captive's investment income up to $1.2 million in annual premiums. Captive insurance companies can retain profits for businesses and provide coverage otherwise unavailable if structured properly with legal and tax advisors.
In this risk retention piece, we provide updates to how the final rule under Dodd-Frank applies to CLOs. We cover the permissible forms of risk retention and financing options for the risk retention obligation among other things.
The document outlines strategies for captive insurance for high net-worth clients, including an overview of captive insurance structures and domiciles. It discusses pure captives, group captives, rent-a-captives and protected cell captives. Key considerations for captive insurance include tax strategies under IRS revenue rulings and using captives for estate planning.
This document summarizes a presentation on SMSFs and real property applications. The presentation discusses how SMSFs have become a preferred vehicle for holding real estate, replacing the traditional family trust model. It describes how real estate can be held in an SMSF, with the SMSF leasing the property to a related business. This allows the business to deduct rent and the SMSF to accumulate wealth for retirement with favorable tax treatment compared to a family trust. The presentation focuses on various real estate arrangements involving SMSFs and the superannuation regulations governing related party transactions.
FiNsure 360 Insurance For Start Up Investment Advisors/Financial Institutionsldag32
A guide to both required and elective lines of insurance and risk management products for start-up Investment Advisors, Hedge & Private Equity Funds
The document discusses life insurance and general insurance accounts. It describes statutory books such as registers of policies and claims. It also discusses the revenue account format for life insurance which debits claims, annuities, surrenders and expenses, and credits the life assurance fund with premiums, consideration for annuities, interest, and reinsurance. The balance sheet format lists assets such as investments and amounts receivable, and liabilities such as share capital and fund balances.
InKnowVision September 2013 Captive Insurance PowerpointInKnowVision
After completing this course, you will be able to:
- Identify the benefits of Captive Insurance companies
- Differentiate which clients would be ideal for a Captive
- List the necessary steps to form a Captive
- Define and address Captive tax issues
- Apply all of the processes to form a successful Captive Insurance company
allstate Quarterly Investor Information Earnings Press Release 2004 3rdfinance7
Allstate reported financial results for Q3 2004. While underlying business remained strong with increased premiums and policies in force, catastrophe losses from Hurricanes Charley, Frances, Ivan and Jeanne totaling $1.71 billion resulted in a net loss of $56 million compared to a $691 million profit in Q3 2003. Premiums and deposits for Allstate Financial increased to $4.02 billion for the quarter. Allstate revised its 2004 annual operating income per share guidance downward due to higher than expected catastrophe losses.
Insurance companies-Accounting and statutory requirementJyoti Singh
This document provides an overview of insurance concepts including the key elements of an insurance contract, different types of insurance like life, fire, marine, and general insurance. It discusses concepts like reinsurance, provisions for unexpired risks, and formats for the revenue account and balance sheet. The document is presented by Jyoti Singh and covers topics such as the definition of life and general insurance, explanations of fire and marine insurance, details about reinsurance accepted and ceded, the provision calculation for unexpired risks, and the structure of the revenue account and balance sheet that insurance companies use.
The document provides an introduction to captive insurance, outlining who should form a captive based on risk profile and financial resources, the types of companies that typically benefit from captives, and the benefits such as custom policies, tax advantages, and negotiating leverage. It also describes the key steps to forming a captive including performing a feasibility study, applying to the jurisdiction, and requirements around capital and surplus as well as ongoing requirements like using a domicile manager.
The document summarizes the benefits of establishing a Captive Insurance Company (CIC). It notes that a CIC allows businesses to lower insurance costs, expand coverage, ensure continuity of coverage, retain underwriting income, increase asset liquidity, control investment decisions, and enjoy significant tax benefits. Specifically, premiums paid to a CIC are tax deductible, underwriting income up to $1.2M is excluded from tax, and earnings can grow tax-deferred and may eventually be taxed at lower capital gains rates upon distribution. Overall, a CIC can improve cash flow, profits, and risk management for small businesses.
The document summarizes key information about timely claim reporting and includes the following points:
1) Claims reported more than 24 hours after occurrence are 33% more costly. Timely reporting is important for a company's risk performance scorecard.
2) Timely reporting allows for early relationships with injured parties to ensure claims are handled properly, and allows adjusters to investigate claims when events are freshest in minds of injured employees and witnesses.
3) Faster reporting means better care for injured parties, faster claim resolution and payments, and ultimately lower costs for employers.
Spectra Energy reported second quarter 2007 net income of $196 million, down from $320 million in the second quarter of 2006. Ongoing net income, which excludes special items, was $192 million compared to $264 million in the prior year. Earnings were lower due to decreased results in the Western Canada Transmission & Processing and Field Services segments, which faced planned maintenance and power outages. However, the company remains on track to achieve its 2007 financial goals due to strong ongoing operations and continued progress on its $3 billion capital expansion program.
The document discusses who pays for mobile devices used in schools, outlining three main models: the school pays fully; the school provides a subsidy with parents contributing; or devices are provided by parents (BYOD/BYOT). Traditionally, schools provided devices but allowed home devices to be used at school. More recently, 1:1 schemes involve schools or subsidies, while BYOD/BYOT means devices are parent-provided but used at school. The document gives examples of these different payment models for mobile devices in schools.
1. The document discusses the Schome Park project which explored using virtual worlds for education over multiple phases from 2007 to 2009.
2. It describes the number of students and staff involved in each phase, and challenges around recruitment, retention and complexity.
3. Quotes from participants discuss issues like bureaucracy causing friction, a lack of clear purpose in the virtual world, and difficulties integrating new members.
Twining 2009 Ov Ws And Transformative Educational Research 09 07 23Peter Twining
The document discusses the Schome Initiative, an open virtual world project exploring innovative approaches to education. It provides context on disruptive innovation theory and examines Schome's implementation over three phases involving student and teacher participation. Key aspects included curriculum areas, student-led activities, and extensive participation tracked through wiki page views and forum posts. The document also evaluates different participant observer roles and includes positive student feedback on Schome breaking down barriers between teachers and students.
This document is PetSmart's 2005 annual report which summarizes the company's financial and operational performance for the year. Key highlights include:
- Net sales increased 11.8% to $3.76 billion
- Comparable store sales grew 4.2%
- The company opened 100 new stores, ending with a total of 826 stores
- Services sales, including grooming, training, and Petshotels grew 24.2% to $298.9 million
- Net income increased 16% to $182.49 million
- The company aims to continue growing by opening an additional 90 stores in 2006 and ultimately reaching 1,400 stores total.
erie insurance group 2004-second-quarter-reportfinance49
This document is the 2nd quarter report from Erie Indemnity Company to its shareholders. It discusses the company's financial performance for the 2nd quarter and first half of 2004.
Key points:
- Net income for the 2nd quarter increased 5.1% to $57.0 million compared to the same period in 2003.
- Net income for the first 6 months of 2004 increased 6.1% to $106.5 million.
- Management fee revenue, which the company earns from Erie Insurance Group, increased 10% for the 2nd quarter due to a 10.7% increase in Erie Insurance Group's direct written premiums.
- However, income from management operations
erie insurance group 2004-first-quarter-reportfinance49
- Erie Indemnity Company reported a net income increase of 8.1% to $49.6 million for Q1 2004 compared to $45.9 million for Q1 2003.
- Management fee revenue increased 7.1% to $221.9 million for Q1 2004, while income from management operations decreased 5.3% to $56.2 million for the same period.
- Insurance underwriting operations reported an underwriting loss of $1.5 million for Q1 2004, an improvement from a $5.7 million loss in Q1 2003, as rate increases and underwriting initiatives began realizing benefits.
This document brings together a set of latest data points and publicly available information relevant for Insurance. We are very excited to share this content and believe that readers will benefit immensely from this periodic publication immensely.
The document discusses key property and casualty (P&C) insurance metrics including the combined ratio, loss ratio, and expense ratio. The combined ratio measures total claims expenses and administrative costs relative to premiums earned, and a ratio over 100% indicates losses. The loss ratio and expense ratio are components of the combined ratio. Other metrics discussed include investment returns, average claim settlement time, and how fraud impacts various ratios by increasing costs. Historical industry averages for ratios are provided for context.
Here are the key points about shareholdings from the information provided:
- The company has an authorized share capital of RM100 million and issued/paid-up share capital of RM69.7 million.
- The shares are ordinary shares of RM0.50 each with one vote per share.
- In terms of distribution by size of shareholdings, the majority (59.34%) hold between 1,001-10,000 shares. Individual and institutional shareholders each hold over 17% of shares.
- The largest shareholder is Tan Sri Dato' Seri Vincent Tan Chee Yioun who holds 46.7% of shares (over 32 million shares).
- The next 25 largest shareholders
Selective Insurance Group reported financial results for the first quarter of 2009. Net loss was $0.25 per share compared to net income of $0.38 per share in 2008 due to lower investment income and realized losses. Operating income was $0.05 per share. While insurance operations performed well, investment results were challenged by losses from alternative investments and impairments. The company also announced a quarterly dividend of $0.13 per share.
Omega Insurance Brokers was established in 2003 in Dubai to provide competitive insurance services. It has grown to over 100 employees and 4000 clients. The intern was assigned to assist the accounting department by calculating sales commissions, making payments to insurance companies, and reconciling bank statements. These tasks will help keep the accounting work up to date and ensure payments are accurate.
allstate Quarterly Investor Information Earnings Press Release 2004 1stfinance7
Allstate reported strong financial results for the first quarter of 2004, with a 43% increase in net income and 52% increase in operating income per share compared to the first quarter of 2003. Operating income reached $1 billion for the first quarter, driven by higher premiums earned in Property-Liability and higher realized capital gains. Property-Liability underwriting income increased 109% due to higher premiums, favorable loss trends, and lower catastrophes. Allstate Financial also saw increases in premiums and deposits as well as operating income. As a result of the strong performance, Allstate increased its full-year 2004 operating income per share guidance.
This document provides a summary of an enhanced reporting presentation by Ameriprise Financial on December 4, 2007. It discusses the new segments that Ameriprise will report, including Advice & Wealth Management, Asset Management, Annuities, Protection, and Corporate & Other. The presentation aims to increase transparency and link metrics and financial results to demonstrate how the businesses create economic value. It provides an overview of the segments and discusses transfer pricing between segments. The majority of the presentation focuses on reviewing the income statements of each new segment.
This is an Assignment done on normal understanding of Operating Leverage, Financial Leverage & Total Leverage, and the relevant calculation formulas and implications.
Northwestern Mutual operates as a mutual company focused on policyholders' interests. It has a conservative investment strategy focused on fixed income and maintains a diversified portfolio and strong financial position despite market volatility in 2008. The document discusses Northwestern Mutual's investment objectives, strategies for managing risk, and performance over the past year.
- Ameriprise Financial reported income before discontinued operations of $111 million for Q4 2005, down from $226 million in Q4 2004, primarily due to one-time separation costs.
- Adjusted earnings, which exclude one-time items, decreased 4% to $193 million compared to $202 million in Q4 2004, due to a lower tax provision in 2004. Revenues grew 5% to $1.9 billion.
- Key highlights included a 6% increase in mass affluent clients, higher advisor productivity, improved investment performance, and a 5% increase in owned, managed, and administered assets to over $428 billion.
allstate Quarterly Investor Information Earnings Press Release 2005 2ndfinance7
Allstate reported a 16.3% increase in net income per share and a 12.9% increase in operating income per share for Q2 2005 compared to Q2 2004. Property-Liability premiums written grew 3.7% driven by increases in auto and homeowners premiums. Underwriting income increased 11.9% to $994 million due to higher premiums earned and favorable loss trends. Catastrophe losses were lower than the prior year. Allstate Financial operating income grew 8.7% to $137 million. Based on strong year-to-date results, Allstate increased its full-year operating income per share guidance to a range of $6.00 to $6.40.
The document provides financial results for Ameriprise Financial for Q3 2006. Key points:
- Net income was $174M, up 39% from prior year. Adjusted earnings excluding one-time costs were $231M, up 29%.
- Revenues grew 6% to $2B driven by higher fees from increased assets in wrap accounts and variable annuities.
- Expenses grew slower than revenues. Compensation increased due to business growth and incentives. Interest expenses fell due to lower fixed annuity balances.
- Assets under management grew 5% to $440B despite selling its recordkeeping business. Strong flows continued in wrap accounts and variable annuities.
erie insurance group 2004-third-quarter-reportfinance49
This document is the third quarter report for Erie Indemnity Company shareholders. It discusses the company's financial results for Q3 2004 compared to Q3 2003. Some key points:
- Net income per share increased 5.3% to $0.83 in Q3 2004 compared to $0.79 in Q3 2003. Net income for the nine months increased 5.4% to $165.1 million.
- Management fee revenue, which is based on Erie Insurance Group's premiums, increased 6.3% in Q3 2004 due to growth in average premiums and high policy retention rates.
- Cost of management operations increased 10.7% in Q3 2004 due to higher commission
This annual report summarizes the operations and financial results of Erie Indemnity Company for 2007. Some key points:
- Erie Indemnity Company manages operations for Erie Insurance Exchange and its subsidiaries. It aims to provide property/casualty and life insurance primarily to individuals.
- In 2007, net income was up 4.4% to $212.9 million and net income per share increased 9.6% to $3.43. Underwriting income increased 84.5% while management fee revenue rose slightly.
- The report discusses Erie's regional focus, commitment to independent agents, and goals for quality growth, underwriting profitability, superior customer service and control of expenses.
This document provides key financial data and an analysis of ACE Limited, a property and casualty insurer. It highlights that ACE has a strong record of pricing risk, is expanding globally to spread risk more widely, and has high earnings per share. The analyst recommends an overweight position and believes the stock remains undervalued relative to its fundamentals. Risks include potential weakness in emerging markets or from natural disasters.
The document provides an overview of Northwestern Mutual's investment strategy and performance in 2008. It summarizes that Northwestern Mutual maintained its focus on traditional insurance products and conservative approach, which helped it withstand market declines better than competitors. While its portfolio experienced losses, its diversification, surplus levels, and avoidance of risky products allowed it to fulfill its commitments to policyholders. It adapted its strategy by increasing liquidity and reducing equity exposure for stability in volatile times.
This document discusses a sample selection and data sources for a study analyzing the effect of capital structure on corporate value for automobile firms listed on Chinese stock exchanges. The sample includes A-share listed automobile companies from 2011-2014 to allow for a four year period in the analysis. Firms are excluded if they are special treatment (ST) or particular transfer (PT) listed, have losses for more than two years, or listed after 2011. The financial data is obtained from the CSMAR Database.
This document discusses key concepts around a company's financing decision of whether to issue debt or equity. It covers factors to consider like taxes, financial distress, signaling effects, and how financial leverage can increase expected returns but also amplify risk for shareholders. Examples and equations are provided to illustrate how different financing options like debt versus equity impact returns and financial ratios.
Similar to erie insurance group 2005-second-quarter-report (20)
This investor presentation provides an overview of Jarden Corporation. In 3 sentences: Jarden is a diversified global consumer products company with a portfolio of over 100 brands across multiple segments. It has established processes for continuous improvement to drive organic growth and integrate acquisitions. The presentation discusses Jarden's strategy, brand strengths, growth approach, operating culture, and framework for ongoing process improvement.
This investor presentation provides an overview of Jarden Corporation. In 3 sentences: Jarden is a diversified global consumer products company with a portfolio of over 100 brands across multiple segments. It has established resilient business platforms and market-leading brands. Jarden's growth strategy focuses on organic growth through increased investment and acquisitions of core, tuck-in businesses that strategically fit with its international focus.
Alltrista Corporation is a leading provider of niche consumer products used for home food preservation. In 2001, Alltrista undertook strategic initiatives to focus on its core consumer products business, including the divestiture of non-core businesses. As a result, Alltrista reported a net loss of $85.4 million for 2001 due to special charges associated with divestitures and restructuring costs. However, the divestitures and restructuring positioned Alltrista to focus on growing its consumer products business through the planned acquisition of Tilia International, which would make Alltrista the market leader in home vacuum packaging systems.
Alltrista sold off non-core businesses in 2001 to focus on consumer products, especially those related to home food preservation. This included brands for canning and vacuum packaging. The divestitures removed financial burdens and generated tax refunds. Alltrista also closed an office to reduce costs. Going forward, the strategy is to leverage leadership in niche consumer product markets to drive growth, with an acquisition of Tilia planned to expand into vacuum packaging.
This document is Jarden Corporation's 2002 Annual Report. It provides an overview of the company's performance in 2002 including financial highlights and summaries of its main business segments: branded consumables, home vacuum packaging, plastic consumables, and other. It discusses the company's acquisition of Tilia and strategic direction to build a world-class consumer products company with leading market shares in niche branded consumable products.
The 2003 annual report summarizes Jarden Corporation's financial and operating results for the year. It discusses record financial performance with revenues surpassing $500 million and cash flow from operations exceeding $70 million. It also highlights the acquisitions of Diamond Brands and Lehigh Consumer Products, which added over $250 million in annual revenue. The Chairman expresses optimism that 2004 will be another record year as the company continues executing its strategy of building a portfolio of market-leading consumer brands.
The 2003 annual report summarizes Jarden Corporation's financial and operating results for the year. It discusses record financial performance with revenues surpassing $500 million and cash flow from operations exceeding $70 million. It also highlights the acquisitions of Diamond Brands and Lehigh Consumer Products, which added over $250 million in annual revenue. The Chairman expresses optimism that this is just the beginning and that Jarden will continue executing its strategy to deliver strong growth.
The document summarizes Jarden Corporation's 2004 annual report. It discusses record financial results in 2004, including 5% organic sales growth and 18% EBITDA margins. It also highlights acquisitions of The United States Playing Card Company and American Household, Inc., owner of brands like Coleman and Sunbeam. The acquisition of American Household tripled Jarden's revenue base and provides opportunities for margin expansion and earnings growth.
The document is Jarden Corporation's 2004 annual report. It discusses Jarden's record financial results in 2004, including organic sales growth of 5% and EBITDA margins of 18% excluding non-cash charges. It also summarizes two acquisitions completed in 2004 - The United States Playing Card Company and American Household, Inc. - and how they will help Jarden expand its business and drive margin improvement towards a target of 15% over five years. The report highlights the company's focus on innovation through new product introductions and maintaining financial flexibility.
This annual report summarizes Jarden Corporation's financial performance in 2005. It discusses the company's acquisition of American Household and The Holmes Group, which expanded its consumer solutions segment. It also highlights initiatives across its various business segments, including new product introductions, employee programs, and efforts to improve operations. The Chairman expresses pride in the company's strong growth and record results in 2005, with revenues reaching $3.2 billion, nearly halfway to its goal of doubling EPS within 3 to 5 years.
Jarden Corporation reported record financial performance in 2006, with net sales increasing 21% to $3.85 billion and consolidated segment earnings growing 23% to $442 million. The annual report provides an overview of the company's three business segments - Branded Consumables, Consumer Solutions, and Outdoor Solutions - and their financial contributions. It also highlights new products, operational efficiencies, and initiatives around veterans hiring, outdoor recreation, and sustainability. Chairman Martin Franklin expressed confidence that the company is on track to double adjusted earnings per share within three to five years.
Chiquita Brands experienced a difficult year in 1999 due to severe banana price declines in Europe resulting from an overallocation of EU banana import licenses. Weak economies in Eastern Europe and Russia also negatively impacted pricing. Operating income declined compared to 1998. However, the company's Processed Foods business saw improved earnings. Chiquita completed a workforce reduction to streamline operations and generate annual savings. The EU banana import regime remains in noncompliance with international trade laws and continues to be challenged at the WTO.
Chiquita Brands International announced a proposed restructuring of $862 million in publicly-held debt discussed in the annual report. If successful, the restructuring would convert a significant portion of the debt into common equity, diluting existing shareholders. The restructuring process is still in the early stages and will continue past the customary May date for the annual shareholder meeting, which has been rescheduled for September 12, 2001. Shareholders will receive proxy materials in advance of the September meeting. The company's website and SEC filings provide information on the restructuring, operations, and other developments.
This document provides an update on Chiquita's progress against its three-year strategic plan to focus on its core banana business, drive better performance through cost reductions, and strengthen its balance sheet. Some key updates include selling non-core assets to focus on bananas, implementing cost saving programs with a target of $70 million in annual savings by 2005, reducing debt by over $100 million in 2002, and plans to invest cash flow into new growth opportunities once debt targets are met.
This document is Chiquita Brands International's 2003 annual report. It summarizes the company's financial performance and operational highlights for 2003. The key points are:
- Operating income doubled to $140 million compared to previous periods, due in part to asset sales. Debt was reduced by $122 million, achieving a $400 million target early.
- Productivity increased 12% on owned banana farms and a new fresh cut fruit business was successfully launched. Labor and food safety certifications were also earned.
- The company aims to leverage its brand and expand into higher-margin fruit businesses, targeting 30% of revenues from new businesses in 5 years. Transformation will include a focus on marketing and new talent.
Chiquita Brands International is a leading marketer and producer of bananas and other fresh produce. In 2004, the company achieved several financial and operational goals including 18% sales growth to $3.1 billion, a 23% increase in operating cash flow to $92 million, and an 11% reduction in total debt. The CEO discusses the company's strategy to strengthen its core banana business, pursue profitable growth through new acquisitions and segments, build a high-performance organization, and improve profitability in North America. Key goals for 2005 include completing the acquisition of Fresh Express to diversify product offerings and integrating the new leadership team to execute the long-term strategy.
This document is Chiquita Brands International's 2005 Annual Report. Some key highlights include:
- Net sales grew 27% to a record $3.9 billion in 2005. Operating income increased 66% to $188 million and net income grew 138% to $131 million.
- The company continued strengthening its management team and board. It also acquired Fresh Express, the US market leader in value-added salads.
- In Europe, Chiquita reinforced its brand leadership in the face of a controversial new EU banana import regime. In North America, it achieved its first meaningful increase in banana pricing in over 15 years.
- Fresh Express accelerated its market leadership in retail value-added salads to a
Seminar: Gender Board Diversity through Ownership NetworksGRAPE
Seminar on gender diversity spillovers through ownership networks at FAME|GRAPE. Presenting novel research. Studies in economics and management using econometrics methods.
1. Elemental Economics - Introduction to mining.pdfNeal Brewster
After this first you should: Understand the nature of mining; have an awareness of the industry’s boundaries, corporate structure and size; appreciation the complex motivations and objectives of the industries’ various participants; know how mineral reserves are defined and estimated, and how they evolve over time.
Solution Manual For Financial Accounting, 8th Canadian Edition 2024, by Libby...Donc Test
Solution Manual For Financial Accounting, 8th Canadian Edition 2024, by Libby, Hodge, Verified Chapters 1 - 13, Complete Newest Version Solution Manual For Financial Accounting, 8th Canadian Edition by Libby, Hodge, Verified Chapters 1 - 13, Complete Newest Version Solution Manual For Financial Accounting 8th Canadian Edition Pdf Chapters Download Stuvia Solution Manual For Financial Accounting 8th Canadian Edition Ebook Download Stuvia Solution Manual For Financial Accounting 8th Canadian Edition Pdf Solution Manual For Financial Accounting 8th Canadian Edition Pdf Download Stuvia Financial Accounting 8th Canadian Edition Pdf Chapters Download Stuvia Financial Accounting 8th Canadian Edition Ebook Download Stuvia Financial Accounting 8th Canadian Edition Pdf Financial Accounting 8th Canadian Edition Pdf Download Stuvia
5 Tips for Creating Standard Financial ReportsEasyReports
Well-crafted financial reports serve as vital tools for decision-making and transparency within an organization. By following the undermentioned tips, you can create standardized financial reports that effectively communicate your company's financial health and performance to stakeholders.
Lecture slide titled Fraud Risk Mitigation, Webinar Lecture Delivered at the Society for West African Internal Audit Practitioners (SWAIAP) on Wednesday, November 8, 2023.
What price will pi network be listed on exchangesDOT TECH
The rate at which pi will be listed is practically unknown. But due to speculations surrounding it the predicted rate is tends to be from 30$ — 50$.
So if you are interested in selling your pi network coins at a high rate tho. Or you can't wait till the mainnet launch in 2026. You can easily trade your pi coins with a merchant.
A merchant is someone who buys pi coins from miners and resell them to Investors looking forward to hold massive quantities till mainnet launch.
I will leave the what's app number of my personal pi vendor to trade with.
+12349014282
Turin Startup Ecosystem 2024 - Ricerca sulle Startup e il Sistema dell'Innov...Quotidiano Piemontese
Turin Startup Ecosystem 2024
Una ricerca de il Club degli Investitori, in collaborazione con ToTeM Torino Tech Map e con il supporto della ESCP Business School e di Growth Capital
^%$Zone1:+971)581248768’][* Legit & Safe #Abortion #Pills #For #Sale In #Duba...mayaclinic18
Whatsapp (+971581248768) Buy Abortion Pills In Dubai/ Qatar/Kuwait/Doha/Abu Dhabi/Alain/RAK City/Satwa/Al Ain/Abortion Pills For Sale In Qatar, Doha. Abu az Zuluf. Abu Thaylah. Ad Dawhah al Jadidah. Al Arish, Al Bida ash Sharqiyah, Al Ghanim, Al Ghuwariyah, Qatari, Abu Dhabi, Dubai.. WHATSAPP +971)581248768 Abortion Pills / Cytotec Tablets Available in Dubai, Sharjah, Abudhabi, Ajman, Alain, Fujeira, Ras Al Khaima, Umm Al Quwain., UAE, buy cytotec in Dubai– Where I can buy abortion pills in Dubai,+971582071918where I can buy abortion pills in Abudhabi +971)581248768 , where I can buy abortion pills in Sharjah,+97158207191 8where I can buy abortion pills in Ajman, +971)581248768 where I can buy abortion pills in Umm al Quwain +971)581248768 , where I can buy abortion pills in Fujairah +971)581248768 , where I can buy abortion pills in Ras al Khaimah +971)581248768 , where I can buy abortion pills in Alain+971)581248768 , where I can buy abortion pills in UAE +971)581248768 we are providing cytotec 200mg abortion pill in dubai, uae.Medication abortion offers an alternative to Surgical Abortion for women in the early weeks of pregnancy. Zone1:+971)581248768’][* Legit & Safe #Abortion #Pills #For #Sale In #Dubai Abu Dhabi Sharjah Deira Ajman Fujairah Ras Al Khaimah%^^%$Zone1:+971)581248768’][* Legit & Safe #Abortion #Pills #For #Sale In #Dubai Abu Dhabi Sharjah Deira Ajman Fujairah Ras Al Khaimah%^^%$Zone1:+971)581248768’][* Legit & Safe #Abortion #Pills #For #Sale In #Dubai Abu Dhabi Sharjah Deira Ajman Fujairah Ras Al Khaimah%^^%$Zone1:+971)581248768’][* Legit & Safe #Abortion #Pills #For #Sale In #Dubai Abu Dhabi Sharjah Deira Ajman Fujairah Ras Al Khaimah%^^%$Zone1:+971)581248768’][* Legit & Safe #Abortion #Pills #For #Sale In #Dubai Abu Dhabi Sharjah Deira Ajman Fujairah Ras Al Khaimah%^^%$Zone1:+971)581248768’][* Legit & Safe #Abortion #Pills #For #Sale In #Dubai Abu Dhabi Sharjah Deira Ajman Fujairah Ras Al Khaimah%^^%$Zone1:+971)581248768’][* Legit & Safe #Abortion #Pills #For #Sale In #Dubai Abu Dhabi Sharjah Deira Ajman Fujairah Ras Al Khaimah%^^%$Zone1:+971)581248768’][* Legit & Safe #Abortion #Pills #For #Sale In #Dubai Abu Dhabi Sharjah Deira Ajman Fujairah Ras Al Khaimah%^^%$Zone1:+971)581248768’][* Legit & Safe #Abortion #Pills #For #Sale In #Dubai Abu Dhabi Sharjah Deira Ajman Fujairah Ras Al Khaimah%^^%$Zone1:+971)581248768’][* Legit & Safe #Abortion #Pills #For #Sale In #Dubai Abu Dhabi Sharjah Deira Ajman Fujairah Ras Al Khaimah%^^%$Zone1:+971)581248768’][* Legit & Safe #Abortion #Pills #For #Sale In #Dubai Abu Dhabi Sharjah Deira Ajman Fujairah Ras Al Khaimah%^^%$Zone1:+971)581248768’][* Legit & Safe #Abortion #Pills #For #Sale In #Dubai Abu Dhabi Sharjah Deira Ajman Fujairah Ras Al Khaimah%^^%$Zone1:+971)581248768’][* Legit & Safe #Abortion #Pills #For #Sale In #Dubai Abu Dhabi Sharjah Deira Ajman Fujairah Ras Al Khaimah%^^%$Zone1:+971)581248768’][* Legit & Safe #Abortion #Pills #For #Sale In #Dubai Abu Dhabi Sharjah Deira Ajman
Role of Information Technology in Revenue - Prof Oyedokun.pptx
erie insurance group 2005-second-quarter-report
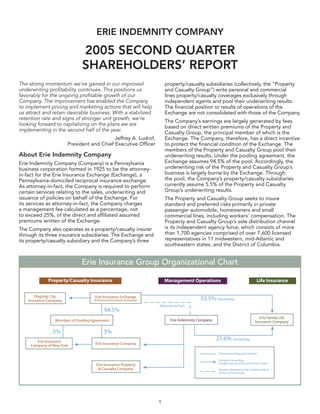
1. ERIE INDEMNITY COMPANY
2005 SECOND QUARTER
SHAREHOLDERS’ REPORT
The strong momentum we’ve gained in our improved property/casualty subsidiaries (collectively, the “Property
underwriting profitability continues. This positions us and Casualty Group”) write personal and commercial
favorably for the ongoing profitable growth of our lines property/casualty coverages exclusively through
Company. The improvement has enabled the Company independent agents and pool their underwriting results.
to implement pricing and marketing actions that will help The financial position or results of operations of the
us attract and retain desirable business. With a stabilized Exchange are not consolidated with those of the Company.
retention rate and signs of stronger unit growth, we’re
The Company’s earnings are largely generated by fees
looking forward to capitalizing on the plans we are
based on direct written premiums of the Property and
implementing in the second half of the year.
Casualty Group, the principal member of which is the
Jeffrey A. Ludrof, Exchange. The Company, therefore, has a direct incentive
President and Chief Executive Officer to protect the financial condition of the Exchange. The
members of the Property and Casualty Group pool their
About Erie Indemnity Company underwriting results. Under the pooling agreement, the
Exchange assumes 94.5% of the pool. Accordingly, the
Erie Indemnity Company (Company) is a Pennsylvania
underwriting risk of the Property and Casualty Group’s
business corporation formed in 1925 to be the attorney-
business is largely borne by the Exchange. Through
in-fact for the Erie Insurance Exchange (Exchange), a
the pool, the Company’s property/casualty subsidiaries
Pennsylvania-domiciled reciprocal insurance exchange.
currently assume 5.5% of the Property and Casualty
As attorney-in-fact, the Company is required to perform
Group’s underwriting results.
certain services relating to the sales, underwriting and
issuance of policies on behalf of the Exchange. For The Property and Casualty Group seeks to insure
its services as attorney-in-fact, the Company charges standard and preferred risks primarily in private
a management fee calculated as a percentage, not passenger automobile, homeowners and small
to exceed 25%, of the direct and affiliated assumed commercial lines, including workers’ compensation. The
premiums written of the Exchange. Property and Casualty Group’s sole distribution channel
is its independent agency force, which consists of more
The Company also operates as a property/casualty insurer
than 1,700 agencies comprised of over 7,600 licensed
through its three insurance subsidiaries. The Exchange and
representatives in 11 midwestern, mid-Atlantic and
its property/casualty subsidiary and the Company’s three
southeastern states, and the District of Columbia.
Erie Insurance Group Organizational Chart
1
2. Corporate Information
Financial Information Stock Transfer Agent
The Erie Indemnity Company submits a quarterly report American Stock Transfer & Trust Company
to the Securities and Exchange Commission on Form 59 Maiden Lane
10-Q. Shareholders may obtain a copy of the Form 10-Q Plaza Level
report without charge by writing to: Chief Financial New York, NY 10038
Officer, Erie Indemnity Company, 100 Erie Insurance (800) 937-5449
Place, Erie, PA, 16530 or by visiting the Company’s Web
Corporate Headquarters
site at www.erieinsurance.com.
100 Erie Insurance Place
Common Stock Information Erie, PA 16530
The Erie Indemnity Company’s Class A, non-voting (814) 870-2000
common stock is traded on the NASDAQ Stock Market
Internet Address
under the symbol “ERIE.” Quotations are available via
major financial news sources. Financial statement filings, shareholder information, press
releases and general news about the Company may also
be accessed at: www.erieinsurance.com.
Erie Indemnity Company Second Quarter 2005 Results
Highlights of the second quarter 2005 results of the Erie The average premium per policy increased 3.7 percent
Indemnity Company are as follows: to $1,061 for the 12 months ended June 30, 2005, from
$1,022 for the 12 months ended June 30, 2004. The
• Net income increased by 33.7 percent to $76.2 million,
average premium per personal lines policy increased
up from $57.0 million at June 30, 2004.
3.3 percent while commercial lines average premiums
• Net income per share increased by 36.0 percent to increased 4.2 percent for the 12 months ended June 30,
$1.10 per share, compared to $.81 per share in the 2005. The private passenger auto average premium per
comparable quarter for 2004. policy increased 2.4 percent to $1,186 for the 12 months
ended June 30, 2005, from $1,158 for the 12 months
• Net income, excluding net realized gains or losses
ended June 30, 2004.
on investments and related federal income taxes,
increased by 27.7 percent to $70.2 million, or $1.01 Management fees are returned to the Exchange when
per share, up from $55.0 million, or $.78 per share, for policies are cancelled mid-term and unearned premiums
the same period one year ago. are refunded. The Company records an estimated
allowance for management fees returned on mid-term
• Management fee revenue decreased less than one
policy cancellations. Management fee revenues were
percent to $254.4 million, from $256.1 million for the
increased by $1.1 million and $2.8 million in the second
same period one year ago.
quarters of 2005 and 2004, respectively, due to changes
• The reported statutory combined ratio for the Property (decreases) in the allowance. The 2005 allowance
and Casualty Group decreased to 87.9 for the second adjustment reflects a leveling off of cancellations
quarter of 2005, compared to 93.2 in the same period evidenced by policy retention ratios of 88.3 percent
in 2004. at both June 30, 2005, and March 31, 2005, and 88.4
percent at December 31, 2004.
• The GAAP combined ratio for the Company was 90.9
in the second quarter 2005 compared to 109.5 for the Rate increases filed by the Property and Casualty Group
same period in 2004. for certain lines of business in various states were sought
to offset growing loss costs in those lines in 2003 and
Management Operations 2004. The effect of rate increases attained in 2004 offset
by 2005 pricing actions approved, filed, awaiting approval
Management fee revenue totaled $254.4 million for
or contemplated through June 30, 2005, is anticipated
the quarter ended June 30, 2005, compared to $256.1
to result in a net decrease in written premiums of $10.1
million for the same period one year ago. Direct written
million in 2005. The Company’s improving loss experience
premiums of the Property and Casualty Group, upon
has resulted in a moderation in pricing, which is expected
which the management fee is based, decreased 1.1
to continue through the second half of 2005. This should
percent in the second quarter of 2005 to $1.1 billion. This
further enhance the Company’s competitive position in all
decline is a result of the anticipated reduction in policies
markets. In 2006, the Company anticipates implementing
in force as part of the Company’s reunderwriting program
additional rate interactions in personal auto and home.
conducted over the past two years. While the Company’s
total number of policies in force is down slightly, the The cost of management operations increased 2.8 percent
decline has moderated, and since the end of the first for the second quarter of 2005 to $198.1 million from
quarter of 2005, the Company has recognized policy $192.7 million during the second quarter of 2004, primarily
growth in both personal and commercial lines of business.
2
3. due to increases in personnel costs and insurance scoring Property and Casualty Group, amounted to $.2 million
costs. For the six months ended June 30, 2005, the cost and $1.2 million, respectively, and contributed .4 points
of management operations grew by 3.3 percent to $375.8 and 2.3 points to the GAAP combined ratio, respectively.
million compared to $364.0 million for the same period
Investment Operations
a year ago. Commissions to independent agents, which
are the largest component of the cost of management Net revenue from investment operations increased
operations, were impacted by the 1.1 percent decrease in 71.3 percent to $70.2 million from $41.0 million for the
the direct written premiums of the Property and Casualty first six months of 2005 and 2004, respectively. The
Group in the second quarter of 2005 and the reduction in increase in earnings was primarily a result of a $14.2
certain commercial commission rates. million adjustment made to record a limited partnership
market value adjustment to equity in earnings of
Insurance Underwriting Operations limited partnerships, of which $9.4 million, or $.09 per
The Property and Casualty Group’s reported statutory share-diluted related to 2004 and prior years. These
combined ratio was 87.9 percent and 93.2 percent for market value adjustments were previously recorded as
the second quarters of 2005 and 2004, respectively. The a component of shareholders’ equity, and resulted in
reported statutory combined ratio of the Property and an increase in net income of $.13 per share-diluted in
Casualty Group was 87.4 percent and 96.7 percent for the the second quarter of 2005. Sales of common equity
six months ended June 30, 2005 and 2004, respectively. securities in the second quarter of 2005 drove the $6.2
The improvement in 2005 underwriting results reflects million increase in net realized gains on investments.
the impact of the underwriting profitability initiatives There were impairment charges of $1.0 million included
implemented in 2003 and 2004 to help offset severity in net realized gains or losses on equity investments in
increases and manage exposure growth. the second quarter of 2005 primarily related to equity
Prior to the third quarter 2004, reserve estimates investments in the consumer products industry. There
were reviewed quarterly but seasonal fluctuations in were no impairment charges on fixed maturities in the
loss reserves were recognized over the balance of the second quarter of 2005. For the six months ended
year. Since then, seasonal fluctuations in the Property June 30, 2005, there were impairment charges of $1.5
and Casualty Group’s underwriting results have been million on fixed maturities and $1.1 million on equity
recognized in the quarterly results in which they occurred. securities. There were no impairment charges on fixed
Generally, the second quarter of the fiscal year has higher maturity or equity securities in the first half of 2004.
non-catastrophe claim volume than the first quarter, Equity in earnings of limited partnerships totaled $20.6
which is typically the lowest claim volume of the year. million in the second quarter of 2005, compared to equity
As underwriting losses are seasonally higher in the in earnings of limited partnerships of $1.5 million in the
second and fourth quarters, the Property and Casualty second quarter of 2004. Private equity and fixed income
Group’s combined ratio generally increases as the year limited partnerships generated earnings of $12.9 million
progresses. The seasonal increase in claim volume in in the second quarter of 2005, compared to earnings of
the second quarter of 2005 contributed 4.3 points to $0.1 million in the second quarter of 2004. Real estate
the statutory combined ratio. The impact of seasonal
limited partnerships reflected earnings of $7.7 million and
fluctuations was offset by positive development of prior $1.4 million in the second quarters of 2005 and 2004,
accident year losses, which improved the Property and respectively.
Casualty Group’s statutory combined ratio by 3.1 points in
The Company’s earnings from its 21.6 percent equity
the second quarter of 2005 (excluding the effects of prior
ownership of EFL increased 4.3 percent to $1.5 million for
year salvage and subrogation collected). Catastrophe
the second quarter of 2005.
losses incurred by the Property and Casualty Group have
not been significant in 2005. The positive development During the second quarter of 2005, the Company
of prior accident years and lower catastrophe losses, repurchased 223,930 shares of its outstanding Class A
coupled with improving underwriting, resulted in lower common stock in conjunction with the stock repurchase
losses at June 30, 2005, compared to June 30, 2004. plan that was authorized in December 2003. The
shares were purchased at a total cost of $11.6 million,
The GAAP combined ratio for the Erie Indemnity
or an average price per share of $51.64. The plan
Company was 90.9 in the second quarter 2005 compared
allows the Company to repurchase up to $250 million
to 109.5 for the same period in 2004. The Company’s
of its outstanding Class A common stock through
insurance underwriting operations recorded an
December 31, 2006. Since the inception of the stock
underwriting gain of $4.9 million in the second quarter
repurchase plan in January 2004, the Company has
of 2005, compared to a $4.9 million underwriting loss in
repurchased 1,654,423 shares at a total price of $80.2
the second quarter of 2004. For the first six months of
million or an average price of $48.50 per share.
2005, the Company’s insurance underwriting operations
generated income of $11.2 million, compared to Erie Indemnity Company provides management services
underwriting losses of $6.4 million for the six months to the member companies of the Erie Insurance Group,
ended June 30, 2004. The improvement in underwriting which includes the Erie Insurance Exchange, Flagship
operations is a result of the initiatives implemented City Insurance Company, Erie Insurance Company, Erie
to focus on underwriting profitability, low catastrophe Insurance Property and Casualty Company, Erie Insurance
losses and favorable development of prior accident year Company of New York and Erie Family Life Insurance
losses. During the second quarters 2005 and 2004, the Company.
Company’s share of catastrophe losses, as defined by the
3
4. According to A.M. Best Company, Erie Insurance Group, “Safe Harbor” Statement Under the Private Securities
Litigation Reform Act of 1995: Certain forward-looking
based in Erie, Pennsylvania, is the 14th largest automobile
statements contained herein involve risks and uncertainties. These
insurer in the United States based on direct premiums
statements include certain discussions relating to management
written and the 22nd largest property/casualty insurer
fee revenue, cost of management operations, underwriting,
in the United States based on total lines net premium
premium and investment income volume, business strategies,
written. The Group, rated A+ (Superior) by A.M. Best profitability and business relationships and the Company’s other
Company, has almost 3.8 million policies in force and business activities during 2005 and beyond. In some cases,
operates in 11 states and the District of Columbia. Erie you can identify forward-looking statements by terms such as
Insurance Group ranked 425 on the FORTUNE 500 and “may,” “will,” “should,” “could,” “would,” “expect,” “plan,”
Erie Indemnity Company is included in Forbes Magazine’s “intend,” “anticipate,” “believe,” “contemplate,” “estimate,”
PLATINUM 400 list of the best-managed companies in “project,” “predict,” “potential” and similar expressions. These
forward-looking statements reflect the Company’s current
America.
views about future events, are based on assumptions and are
News releases and more information about Erie Insurance subject to known and unknown risks and uncertainties that may
Group are available at www.erieinsurance.com. cause results to differ materially from those anticipated in those
statements. Many of the factors that will determine future events
or achievements are beyond our ability to control or predict.
CONSOLIDATED STATEMENTS OF OPERATIONS
(Amounts in thousands, except per share data)
Three months ended Six months ended
June 30 June 30
2005 2004 2005 2004
(unaudited) (unaudited)
Operating revenue
Management fee revenue—net $ 240,390 $ 242,037 $ 458,126 $ 451,702
Premiums earned 54,166 51,065 107,814 101,714
Service agreement revenue 5,359 5,224 10,146 10,823
Total operating revenue 299,915 298,326 576,086 564,239
Operating expenses
Cost of management operations 187,232 182,120 355,172 343,941
Losses and loss adjustment expenses incurred 33,785 40,002 66,462 78,040
Policy acquisition and other underwriting expenses 12,356 12,434 24,200 23,752
Total operating expenses 233,373 234,556 445,834 445,733
Investment income—unaffiliated
Investment income, net of expenses 15,934 15,605 30,402 30,291
Net realized gains on investments 9,196 3,030 14,693 5,883
Equity in earnings of limited partnerships 20,645 1,465 22,756 1,883
Total investment income—unaffiliated 45,775 20,100 67,851 38,057
Income before income taxes and equity in earnings of
Erie Family Life Insurance Company 112,317 83,870 198,103 156,563
Provision for income taxes 37,581 28,289 66,310 52,724
Equity in earnings of Erie Family Life Insurance
Company, net of tax 1,432 1,374 2,146 2,688
Net income $ 76,168 $ 56,955 $ 133,939 $ 106,527
Net income per share—Class A basic $ 1.21 $ 0.89 $ 2.12 $ 1.66
Net income per share—Class B basic $ 183.89 $ 135.81 $ 322.67 $ 253.68
Net income per share—diluted $ 1.10 $ 0.81 $ 1.92 $ 1.50
Weighted average shares outstanding—diluted 69,525 70,698 69,688 70,860
Dividends declared per share
Class A common stock $ 0.325 $ 0.215 $ 0.650 $ 0.430
Class B common stock $ 48.75 $ 32.25 $ 97.50 $ 64.50
4
5. CONSOLIDATED STATEMENTS OF OPERATIONS—SEGMENT BASIS
(Amounts in thousands, except per share data)
Three months ended Six months ended
June 30 June 30
2005 2004 2005 2004
(unaudited) (unaudited)
Management operations
Management fee revenue $ 254,381 $ 256,124 $ 484,790 $ 477,991
Service agreement revenue 5,359 5,224 10,146 10,823
Total revenue from management operations 259,740 261,348 494,936 488,814
Cost of management operations 198,129 192,719 375,844 363,958
Income from management operations 61,611 68,629 119,092 124,856
Insurance underwriting operations
Premiums earned 54,166 51,065 107,814 101,714
Losses and loss adjustment expenses incurred 33,786 40,002 66,462 78,040
Policy acquisition and other underwriting expenses 15,450 15,922 30,192 30,024
Total losses and expenses 49,236 55,924 96,654 108,064
Underwriting gain (loss) 4,930 ( 4,859) 11,160 ( 6,350)
Investment operations
Net investment income 15,934 15,605 30,402 30,291
Net realized gains on investments 9,196 3,030 14,693 5,883
Equity in earnings of limited partnerships 20,645 1,465 22,756 1,883
Equity in earnings of Erie Family Life Insurance Company 1,541 1,477 2,308 2,891
Net revenue from investment operations 47,316 21,577 70,159 40,948
Income before income taxes 113,857 85,347 200,411 159,454
Provision for income taxes 37,689 28,392 66,472 52,927
Net income $ 76,168 $ 56,955 $ 133,939 $ 106,527
Net income per share—diluted $ 1.10 $ 0.81 $ 1.92 $ 1.50
Amounts presented on a segment basis are presented gross of intercompany/intersegment items
5
6. RECONCILIATION OF OPERATING INCOME TO NET INCOME
Definition of Non-GAAP and Operating The Company uses operating income to evaluate the
Measures results of operations. It reveals trends in the Company’s
management services, insurance underwriting and
Management believes that investors’ understanding
investment operations that may be obscured by
of the Company’s performance is enhanced by the
the net effects of realized capital gains and losses.
disclosure of the following non-GAAP financial measure.
Realized capital gains and losses may vary significantly
The Company’s method of calculating this measure may
between periods and are generally driven by business
differ from those used by other companies and therefore
decisions and economic developments such as capital
comparability may be limited.
market condition, the timing of which is unrelated to
Operating income is net income excluding realized management services and the insurance underwriting
capital gains and losses and related federal income processes of the Company. The Company believes it
taxes. Equity in earnings or losses of Erie Family Life is useful for investors to evaluate these components
Insurance Company and equity in earnings or losses of separately and in the aggregate when reviewing the
limited partnerships are not excluded from the calculation Company’s performance. The Company is aware that the
of operating income. Both of these categories include price to earnings multiple commonly used by investors
the respective investment’s realized capital gains and as a forward-looking valuation technique uses operating
losses, as well as unrealized gains and losses, as these income as the denominator. Operating income should
investments are accounted for under the equity method. not be considered as a substitute for net income and
does not reflect the overall profitability of the Company’s
Net income is the GAAP measure that is most directly
business.
comparable to operating income.
The following table reconciles operating income and net
income for the periods ended June 30, 2005 and 2004.
Three months ended Six months ended
June 30 June 30
2005 2004 2005 2004
(in thousands) (unaudited) (unaudited)
Operating income $ 70,191 $ 54,985 $ 124,389 $ 102,703
Net realized gains on investments 9,196 3,030 14,693 5,883
Income tax expense on realized gains ( 3,219) ( 1,060) ( 5,143) ( 2,059)
Realized gains net of income tax expense 5,977 1,970 9,550 3,824
Net income $ 76,168 $ 56,955 $ 133,939 $ 106,527
Three months ended Six months ended
June 30 June 30
2005 2004 2005 2004
(per share information—diluted) (unaudited) (unaudited)
Operating income $ 1.01 $ 0.78 $ 1.79 $ 1.45
Net realized gains on investments 0.13 0.04 0.21 0.08
Income tax expense on realized gains ( 0.04) ( 0.01) ( 0.08) ( 0.03)
Realized gains net of income tax expense 0.09 0.03 0.13 0.05
Net income $ 1.10 $ 0.81 $ 1.92 $ 1.50
6
7. CONSOLIDATED STATEMENTS OF FINANCIAL POSITION
(Amounts in thousands, except per share data)
June 30 December 31
2005 2004
(unaudited)
Assets
Investments
Fixed maturities $ 987,637 $ 974,512
Equity securities
Preferred stock 159,022 143,851
Common stock 73,678 58,843
Other invested assets 141,329 135,508
Total investments 1,361,666 1,312,714
Cash and cash equivalents 33,271 50,061
Equity in Erie Family Life Insurance Company 60,149 58,728
Premiums receivable from policyholders 286,820 275,721
Receivables from affiliates 1,159,214 1,145,238
Other assets 174,488 137,282
Total assets $ 3,075,608 $ 2,979,744
Liabilities and shareholders’ equity
Liabilities
Unpaid losses and loss adjustment expenses $ 955,487 $ 943,034
Unearned premiums 478,643 472,553
Other liabilities 330,342 297,276
Total liabilities 1,764,472 1,712,863
Total shareholders’ equity 1,311,136 1,266,881
Total liabilities and shareholders’ equity $ 3,075,608 $ 2,979,744
Book value per share $ 18.91 $ 18.14
Shares outstanding 69,343 69,852
7