Download to read offline

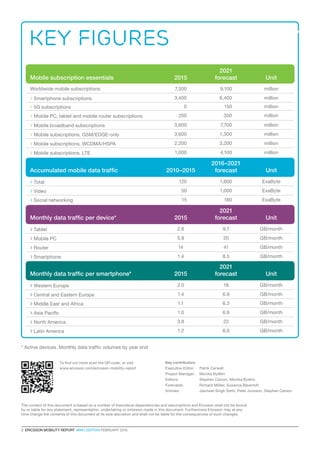
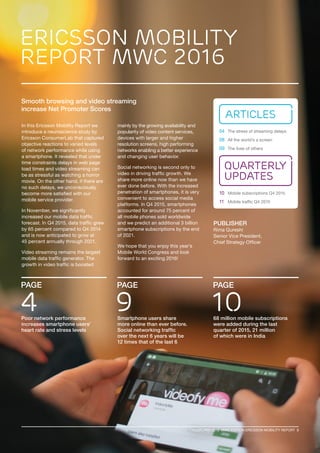
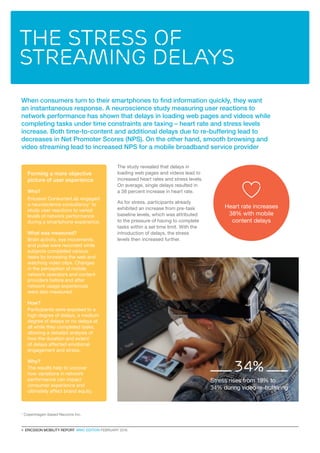
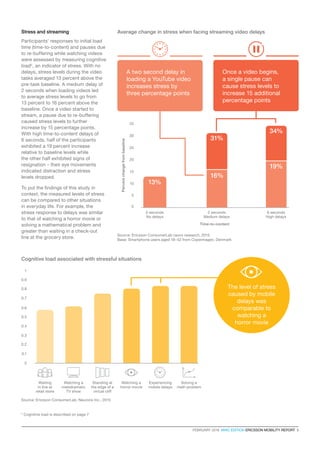
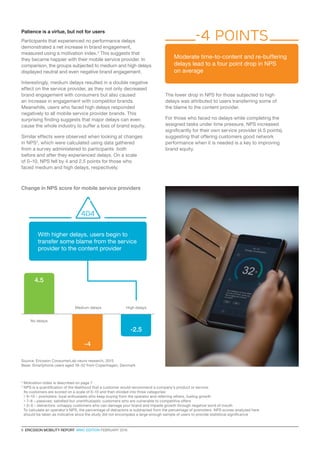
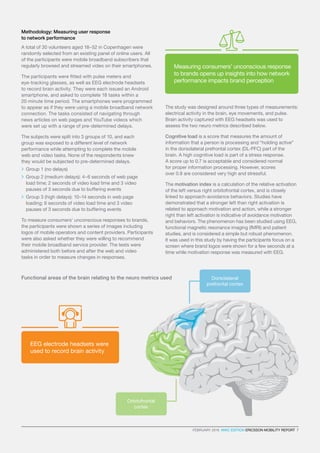
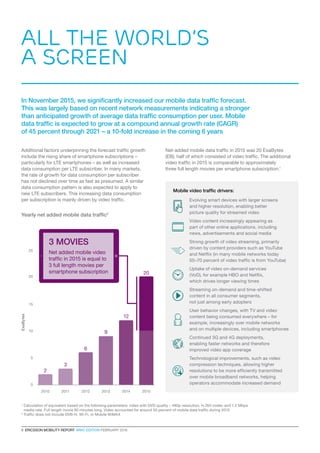

The Ericsson Mobility Report for February 2016 forecasts significant growth in mobile subscriptions and data traffic, predicting mobile subscriptions to reach 9.1 billion and mobile data traffic to increase to 1,600 exabytes by 2021, primarily driven by video streaming. A neuroscience study highlighted that delays in mobile network performance can increase user stress and negatively impact brand perception, with smooth service leading to higher customer satisfaction. The report emphasizes the importance of network quality in improving net promoter scores (NPS) and overall user experience.


