Download to read offline

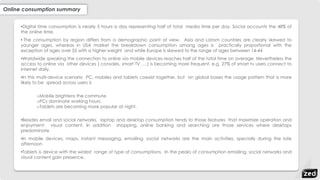
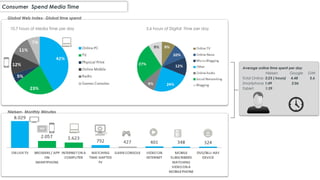
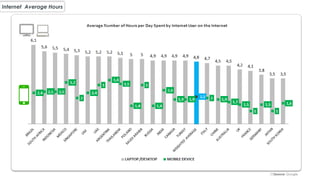
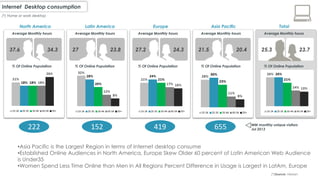
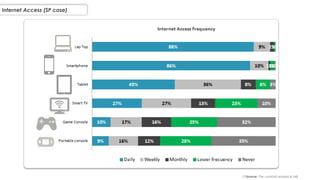
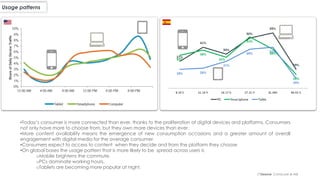
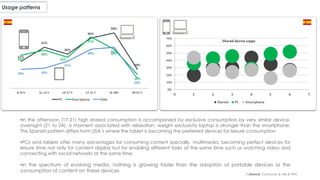
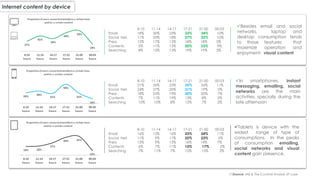
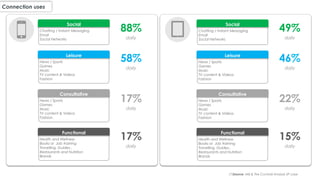
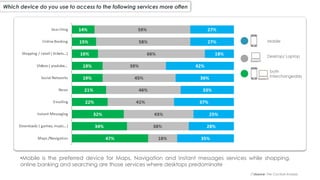
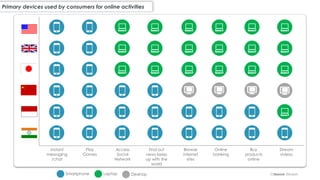

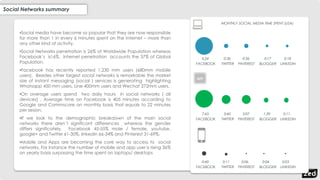
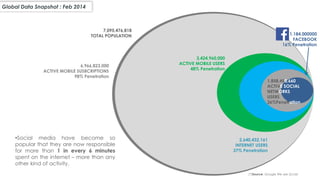
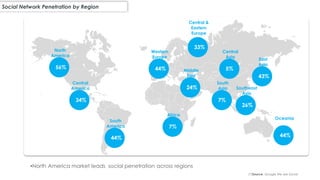
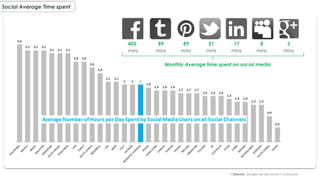
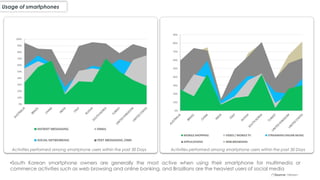
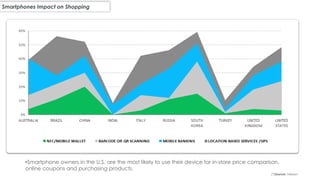
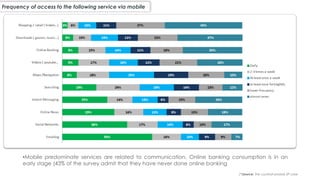


The document provides an extensive analysis of global digital consumption patterns, highlighting that users spend nearly 5 hours on digital media daily, with social networks accounting for almost half of that time. It outlines regional differences in consumption, the rise of mobile devices for accessing online content, and a significant engagement with social media across various demographics. Additionally, it emphasizes the growing importance of apps in mobile usage and the effectiveness of different devices for specific activities.