Download to read offline

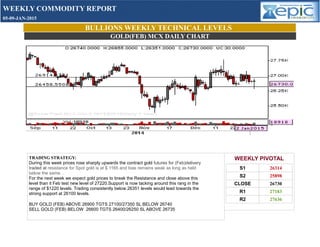
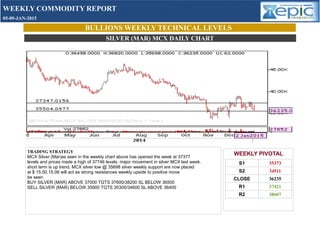
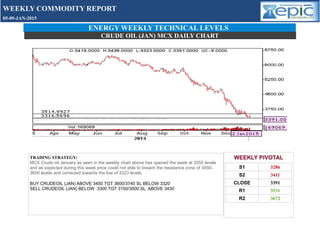
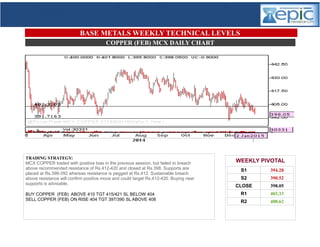

The weekly commodity report for January 5-9, 2015, provides technical insights for gold, silver, crude oil, and copper, with specific trading strategies and pivotal levels outlined for each. Gold is anticipated to break resistance and test new levels, while silver shows an upward trend with strategic buying and selling points provided. Crude oil struggled to breach resistance levels, and copper is recommended for buying near support with clear targets set in each case.


![Letteratura - Enciclopedia einaudi [1982]](https://cdn.slidesharecdn.com/ss_thumbnails/32letteratura-enciclopediaeinaudi1982-ocr-150103171416-conversion-gate01-thumbnail.jpg?width=640&height=640&fit=bounds)


