Download to read offline
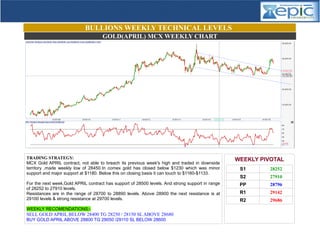


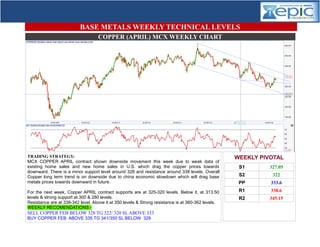

The weekly commodity report provides technical analysis and trading recommendations for gold, silver, crude oil, and copper futures contracts on the MCX exchange for the weeks of March 28th to 31st 2016 and June 22nd to 27th 2015. Key support and resistance levels are given for each commodity contract, along with analysis of recent price movements and trading strategies. Recommendations are made to sell below or buy above specific price levels for potential price targets and stop losses.


