Download to read offline

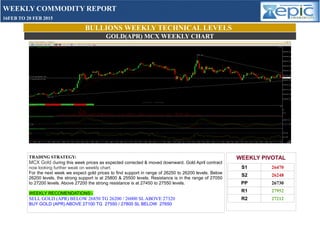
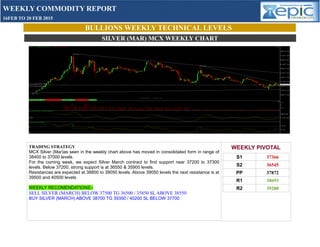
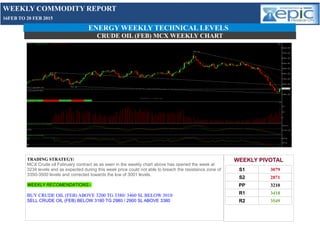
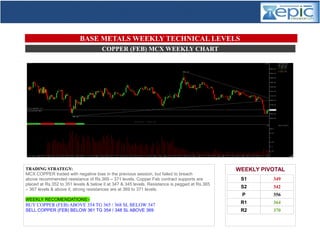


The weekly commodity report (16-20 Feb 2015) outlines market strategies for gold, silver, crude oil, and copper. Gold prices are expected to find support around 26250 to 26200 levels, while silver near 37200 to 37300 levels; both metals have recommended trading strategies based on various pivot levels. Crude oil is predicted to range around 3200 and 3350-3500 levels, and copper shows support at 352-351 levels with a resistance ceiling at 369-371 levels.


