Download as PDF, PPTX

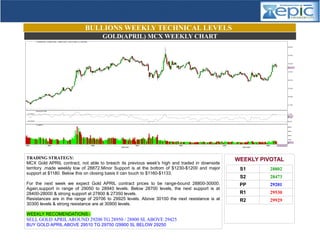
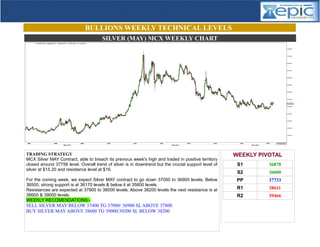
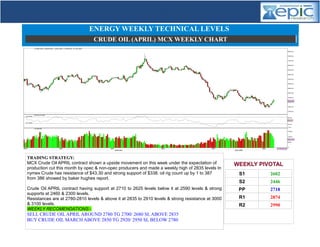


The weekly commodity report provides technical analysis and trading recommendations for gold, silver, and crude oil contracts. Gold is expected to trade within a range of 28800-30000 with resistances above 30100, while silver shows a downtrend with resistance at $16 and strong support at $15.20. Crude oil prices are anticipated to fluctuate under production cut expectations, with key support levels at 2710 and resistances at 2780-2810.


