Download to read offline

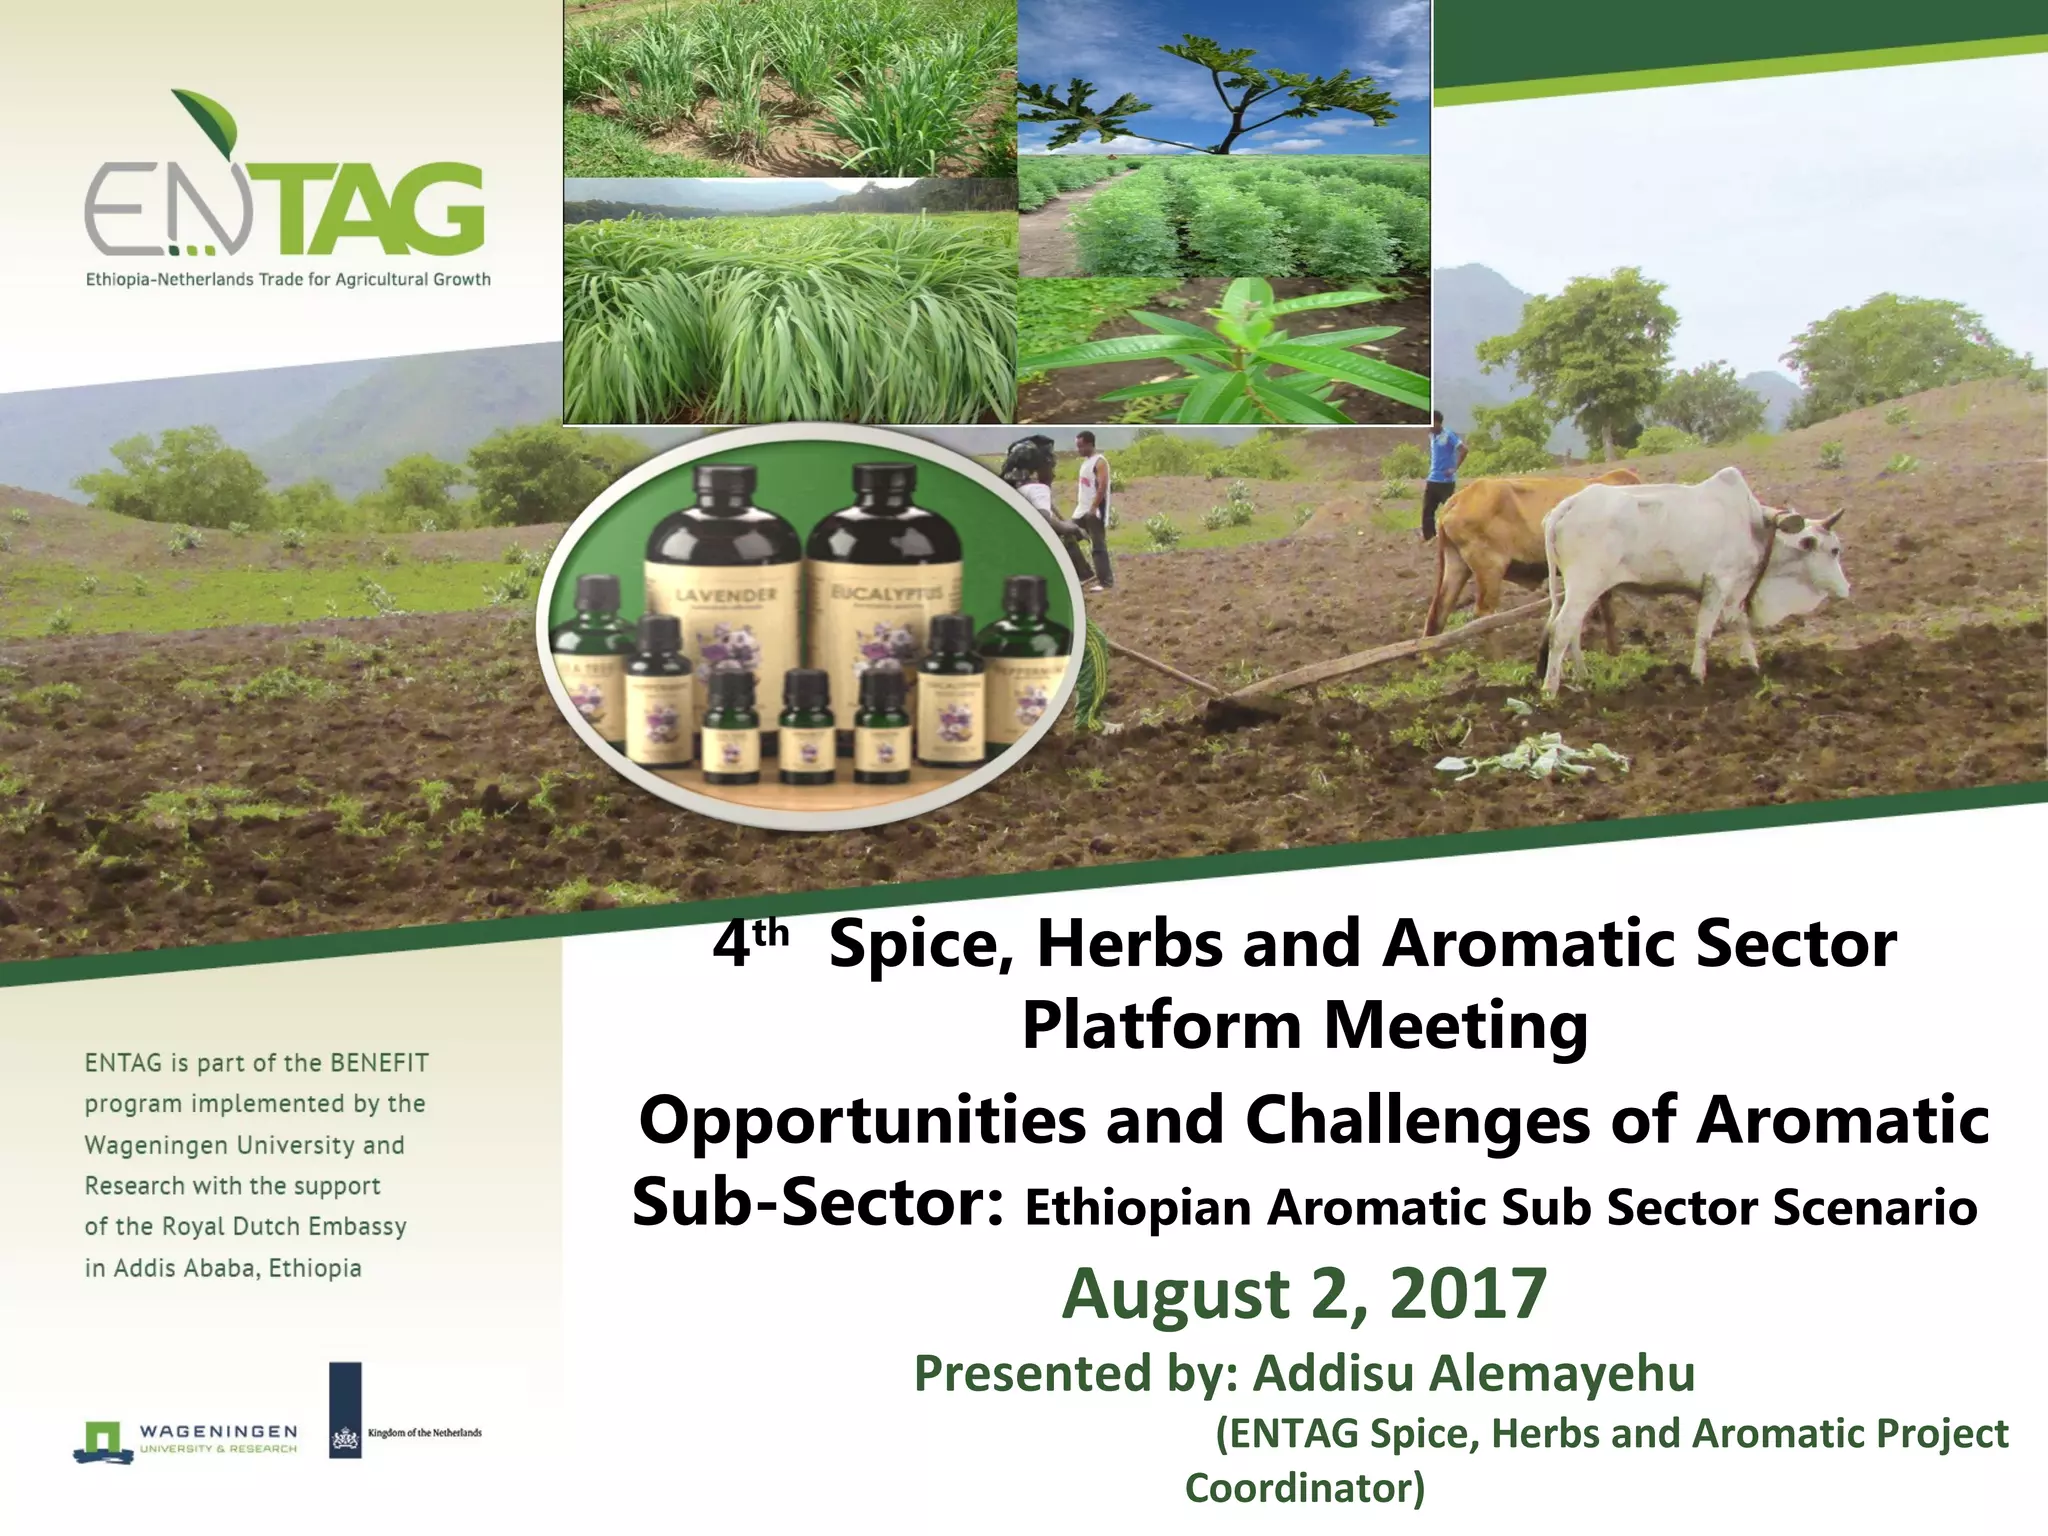
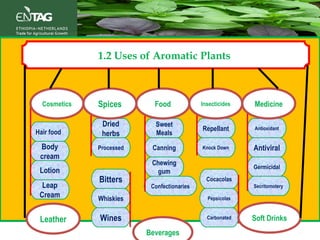
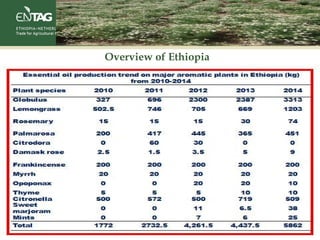
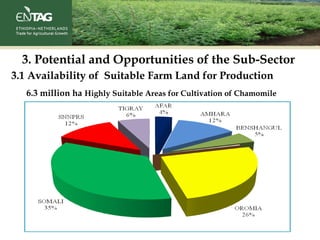
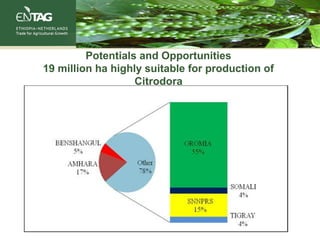
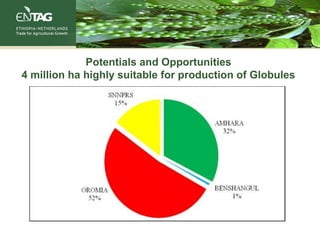
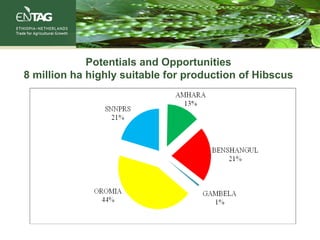
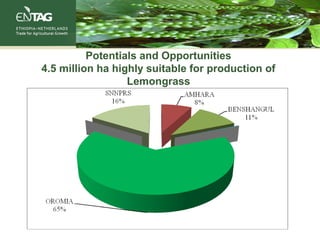
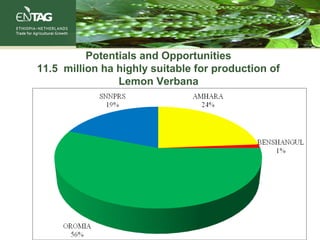
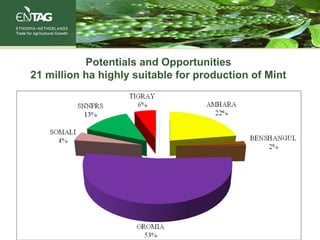
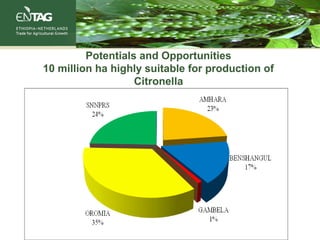
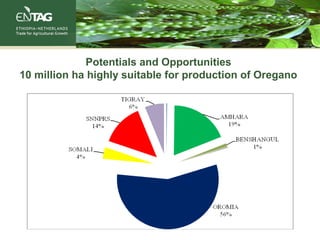
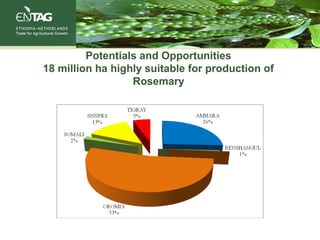
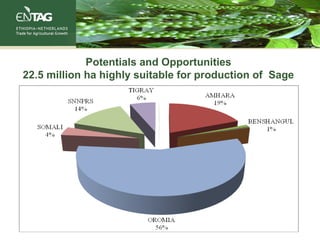
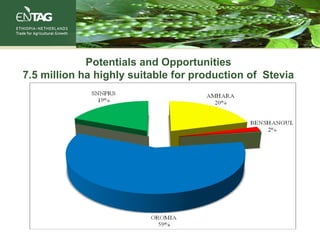
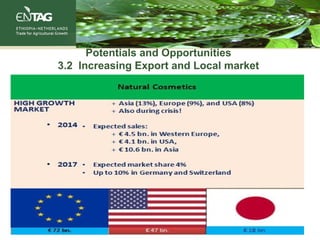
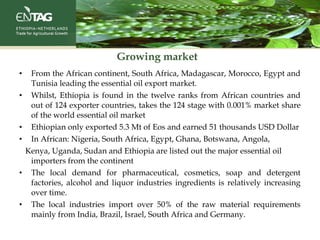


This document summarizes the opportunities and challenges facing Ethiopia's aromatic sub-sector. It outlines Ethiopia's large potential for aromatic plant production due to suitable land availability. Export and local markets are growing, with room for Ethiopia to expand exports. Research has yielded varieties and production technologies for many aromatic plants. However, the sub-sector faces challenges around financing, technology access, and lack of processing facilities.