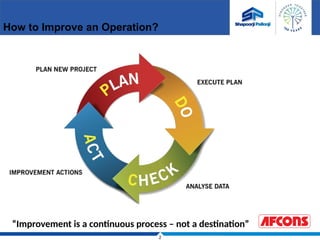
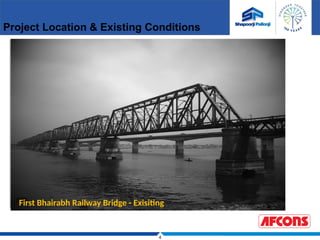
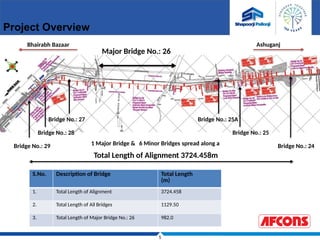
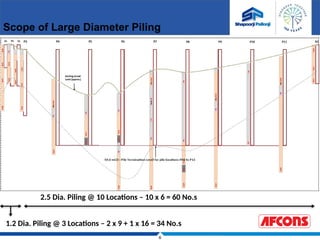
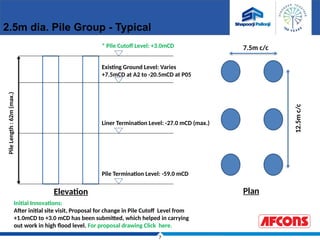
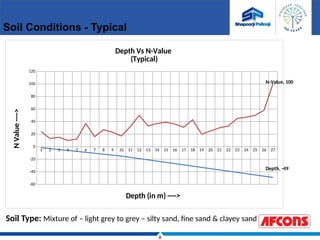
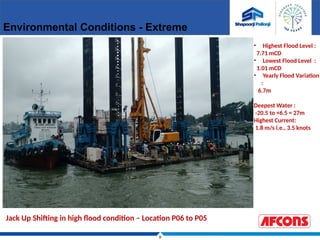
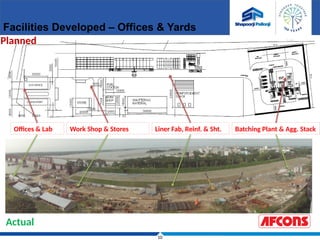
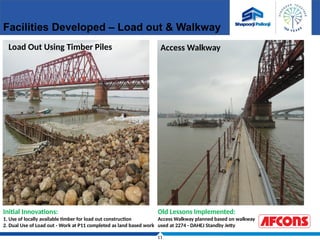
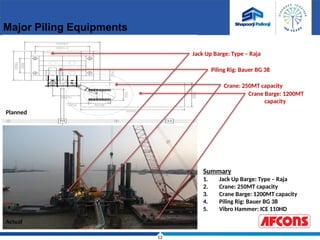
A Case Study Based on Large Diameter Piling at 6265 – Bangladesh Project
Achieved Productivity Analysis -
An Approach to Identify Areas of Improvement &
Implement Operational Excellence
Srinivas. V. Mallick
CPMG, HO
2
How to Improve an Operation?
“Improvement is a continuous process – not a destination”
3
Introduction to the Project Under Study –
6265 – Bangladesh Project
4
Project Location & Existing Conditions
First Bhairabh Railway Bridge - Exisiting
5
Bridge No.: 29
Bridge No.: 28
Bridge No.: 27
Major Bridge No.: 26
Bridge No.: 25A
Bridge No.: 25
Bridge No.: 24
S.No. Description of Bridge Total Length
(m)
1. Total Length of Alignment 3724.458
2. Total Length of All Bridges 1129.50
3. Total Length of Major Bridge No.: 26 982.0
Total Length of Alignment 3724.458m
1 Major Bridge & 6 Minor Bridges spread along a
Bhairabh Bazaar Ashuganj
Project Overview
6
1.2 Dia. Piling @ 3 Locations – 2 x 9 + 1 x 16 = 34 No.s
2.5 Dia. Piling @ 10 Locations – 10 x 6 = 60 No.s
Scope of Large Diameter Piling
7
* Pile Cutoff Level: +3.0mCD
Existing Ground Level: Varies
+7.5mCD at A2 to -20.5mCD at P05
Pile Termination Level: -59.0 mCD
Pile
Length
:
62m
(max.)
Elevation
Liner Termination Level: -27.0 mCD (max.)
7.5m c/c
12.5m
c/c
Plan
Initial Innovations:
After initial site visit, Proposal for change in Pile Cutoff Level from
+1.0mCD to +3.0 mCD has been submitted, which helped in carrying
out work in high flood level. For proposal drawing Click here.
2.5m dia. Pile Group - Typical
8
1 2 3 4 5 6 7 8 9 10 11 12 13 14 15 16 17 18 19 20 21 22 23 24 25 26 27
-60
-40
-20
0
20
40
60
80
100
120
Depth, -49
N-Value, 100
Depth Vs N-Value
(Typical)
Depth (in m) ---->
N
Value
---->
Soil Type: Mixture of – light grey to grey – silty sand, fine sand & clayey sand
Soil Conditions - Typical
9
Environmental Conditions - Extreme
Jack Up Shifting in high flood condition – Location P06 to P05
• Highest Flood Level :
7.71 mCD
• Lowest Flood Level :
1.01 mCD
• Yearly Flood Variation
:
6.7m
Deepest Water :
-20.5 to +6.5 = 27m
Highest Current:
1.8 m/s i.e., 3.5 knots
10
Planned
Actual
Offices & Lab Work Shop & Stores Liner Fab, Reinf. & Sht. Batching Plant & Agg. Stack
Facilities Developed – Offices & Yards
11
Facilities Developed – Load out & Walkway
Load Out Using Timber Piles Access Walkway
Initial Innovations:
1. Use of locally available timber for load out construction
2. Dual Use of Load out - Work at P11 completed as land based work
Old Lessons Implemented:
Access Walkway planned based on walkway
used at 2274 - DAHEJ Standby Jetty
12
Major Piling Equipments
Summary
1. Jack Up Barge: Type – Raja
2. Crane: 250MT capacity
3. Crane Barge: 1200MT capacity
4. Piling Rig: Bauer BG 38
5. Vibro Hammer: ICE 110HD
Actual
Planned
Jack Up Barge: Type – Raja
Crane: 250MT capacity
Crane Barge: 1200MT
capacity
Piling Rig: Bauer BG 38
13
Large Diameter Piling – Overview Video
14
Data Collection
Duration of every activity of every individual pile has been carefully collected and the
reasons for early completion/ Delay has been carefully noted and the same is as follows:
S.No.
Pile
Location
Start Time Finish Time
Time b/w locations
(Finish of Previous
Pile to Start of Next
Pile in hrs)
Reason for Dealy/ Early Work
0 Planned 01-Sep-14 18-Jun-15
1
A02-1 22-10-14 09:00:00 23-10-14 08:20:00
Initial Dealy - mobilisation of
Rig, Polymer Pump etc
2 A02-6 25-10-14 12:00:00 26-10-14 00:30:00 51.67 Learning Curve
3 A02-2 28-10-14 00:25:00 28-10-14 18:45:00 47.92 Learning Curve
4 A02-5 30-10-14 22:00:00 31-10-14 18:45:00 51.25 Learning Curve
5 A02-3 1-11-14 03:20:00 1-11-14 18:40:00 8.58 Learning Curve
6 P03-1 19-11-14 00:25:00 20-11-14 03:25:00 437.75 Rig shifting - to Ashuganj side
7 P03-3 21-11-14 20:40:00 23-11-14 03:35:00 41.25 Learning Curve
8 P03-6 23-11-14 23:00:00 25-11-14 08:05:00 19.42 Rig Positioning & Survey & Liner Driving
9 P03-4 25-11-14 16:15:00 27-11-14 02:30:00 8.17 Rig Positioning & Survey & Liner Driving
10 P03-2 27-11-14 18:25:00 29-11-14 01:30:00 15.92 Rig Positioning & Survey & Liner Driving
11
P04-3 17-12-14 13:00:00 22-12-14 03:00:00 443.50
Client Related - finalisation of Pile depth
12
P03-5 2-1-15 00:05:00 3-1-15 13:00:00 261.08
Non availabilty - 250MT crane, O-Cell
13 P04-1 3-1-15 20:00:00 7-1-15 00:40:00 7.00 Rig Positioning & Survey & Liner Driving
14 P04-6 7-1-15 23:15:00 10-1-15 22:00:00 22.58 Rig Positioning & Survey & Liner Driving
15 P04-4 11-1-15 07:00:00 14-1-15 01:00:00 9.00 Non availabilty - Reinforcement Cage
16 P04-2 15-1-15 04:00:00 17-1-15 18:48:00 27.00 Non availabilty - Cage
17 P04-5 1-2-15 21:15:00 5-2-15 04:30:00 362.45 Non availabilty - O-Cell
18 P11-5 11-2-15 10:30:00 14-2-15 09:55:00 150.00 Rig shifting - to Bhairabh side
19 A02-4 14-2-15 13:00:00 14-2-15 21:30:00 0.00 No Delay & parallel work
20
P11-4 16-2-15 18:30:00 19-2-15 17:30:00 45.00
Learning Curve - Liner driving with twin
vibro
21 P11-3 22-2-15 02:00:00 24-2-15 18:05:00 56.50 Break Down - Crane
22 P11-1 23-2-15 15:00:00 26-2-15 18:05:00 0.00 No Delay & parallel work
23 P11-6 26-2-15 23:00:00 1-3-15 18:20:00 4.92 Rig Positioning & Survey & Liner Driving
24 P11-2 28-2-15 04:45:00 3-3-15 23:55:00 0.00 Rig Positioning & Survey & Liner Driving
25 P10-6 23-3-15 21:15:00 26-3-15 05:50:00 481.33 Non availabilty - 110hd vibro
26 P10-1 28-3-15 06:30:00 30-3-15 06:05:00 48.67 Learning Curve - marine piling
27
P10-2 31-3-15 14:25:00 2-4-15 19:40:00 32.33
Jack Up shifting& Rig Positioning&
Survey& Liner Driving
28 P10-5 1-4-15 12:30:00 3-4-15 19:10:00 0.00 No Delay & parallel work
29
P10-4 4-4-15 23:50:00 7-4-15 14:28:00 28.67
Jack Up shifting& Rig Positioning&
Survey& Liner Driving
30 P10-3 5-4-15 17:22:00 8-4-15 19:04:00 0.00 No Delay & parallel work
31
P09-6 10-4-15 11:15:00 13-4-15 08:09:00 31.25
Jack Up shifting& Rig Positioning&
Survey& Liner Driving
32 P09-1 11-4-15 05:00:00 16-4-15 04:15:00 0.00 No Delay & parallel work
33
P09-5 17-4-15 10:00:00 22-4-15 09:52:00 29.75
Jack Up shifting& Rig Positioning&
Survey& Liner Driving
34 P09-2 18-4-15 22:15:00 23-4-15 16:42:00 0.00 No Delay & parallel work
35
P09-4 25-4-15 00:15:00 27-4-15 18:40:00 35.55
Jack Up shifting& Rig Positioning&
Survey& Liner Driving
36 P09-3 26-4-15 03:00:00 30-4-15 00:37:00 0.00 No Delay & parallel work
37
P08-6 1-5-15 18:00:00 4-5-15 04:30:00 41.38
Jack Up shifting& Rig Positioning&
Survey& Liner Driving
38 P08-1 2-5-15 17:00:00 5-5-15 04:30:00 0.00 No Delay & parallel work
39
P08-5 6-5-15 06:45:00 8-5-15 06:40:00 14.25
Jack Up shifting& Rig Positioning&
Survey& Liner Driving
40 P08-2 7-5-15 06:02:00 9-5-15 19:20:00 0.00 No Delay & parallel work
41
P07-6 11-5-15 19:00:00 13-5-15 21:20:00 47.67
Jack Up shifting& Rig Positioning&
Survey& Liner Driving
42 P07-1 12-5-15 18:40:00 14-5-15 23:08:00 0.00 No Delay & parallel work
43
P08-4 16-5-15 22:00:00 19-5-15 22:00:00 46.87
Jack Up shifting& Rig Positioning&
Survey& Liner Driving
44 P08-3 17-5-15 19:00:00 20-5-15 20:30:00 0.00 Non availabilty - O - Cell
45
P07-5 22-5-15 10:10:00 24-5-15 10:35:00 35.67
Jack Up shifting& Rig Positioning&
Survey& Liner Driving
46 P07-2 23-5-15 03:30:00 25-5-15 18:09:00 0.00 No Delay & parallel work
47
P07-4 26-5-15 18:09:00 29-5-15 03:20:00 24.00
Jack Up shifting& Rig Positioning&
Survey& Liner Driving
48 P07-3 27-5-15 09:10:00 29-5-15 10:15:00 0.00 No Delay & parallel work
49
P06-6 5-6-15 05:00:00 7-6-15 06:15:00 162.75
Jack Up shifting& Rig Positioning&
Survey& Liner Driving
50 P06-1 6-6-15 13:00:00 8-6-15 17:47:00 0.00 No Delay & parallel work
51
P06-5 10-6-15 18:15:00 13-6-15 22:20:00 48.47
Jack Up shifting& Rig Positioning&
Survey& Liner Driving
52 P06-2 15-6-15 00:10:00 17-6-15 07:20:00 25.83 Non availabilty - Liner
53
P06-3 18-6-15 17:00:00 21-6-15 01:35:00 33.67
Jack Up shifting& Rig Positioning&
Survey& Liner Driving
54 P06-4 19-6-15 16:00:00 22-6-15 18:25:00 0.00 No Delay & parallel work
55
P05-1 25-6-15 20:00:00 28-6-15 18:31:00 73.58
Jack Up shifting& Rig Positioning&
Survey& Liner Driving
56 P05-6 27-6-15 14:00:00 30-6-15 16:30:00 0.00 No Delay & parallel work
57 P05-5 1-7-15 20:00:00 3-7-15 17:05:00 27.50 Non availabilty - Liner
58 P05-2 2-7-15 17:00:00 5-7-15 02:35:00 0.00 No Delay & parallel work
59 P05-3 6-7-15 01:00:00 14-7-15 17:10:00 22.42 Break Down - Rig - Wire rope broken
60 P05-4 13-7-15 11:00:00 15-7-15 12:40:00 0.00 No Delay & parallel work
“Not visible?”
– Un utilized/ Data without analysis is as good as invisible data!
15
Achieved Productivity Analysis
Note:
In all the individual comparisons of time cycles carried out here in the analysis,
extreme deviations caused due to reasons like equipment break down are not considered, as it will
effect the average adversely.
The same has been added in the total duration comparison.
16
Planned Time Cycles & Durations
A2 P3 P4, P11
20m 40m 62m Odd Even
No.s of Piles at the location No.s 6 6 12 18 18
A Pre- Boring Activities hrs 1.00 2.50 4.50 18.50 4.50 8.15
1 Survey and positioning of Barge Hrs 10.00
2 Guide Fixing Hrs 4.00
3 Liner Lowering Hrs 0.50 2.00 4.00 4.00 4.00
4 Rig Positioning Hrs 0.50 0.50 0.50 0.50 0.50
B Boring Depth m 20.00 40.00 42.00 42.00 42.00 39.60
5 In Soil m 20 27 27 27 27
6 In Compacted Sand m 0 13 15 15 15
C Boring Productivity m/hr 4.00 3.02 2.95 2.95 2.95 3.06
7 In Soil m/hr 4 4 4 4 4
8 In Compacted Sand m/hr 2 2 2 2 2
D Boring hrs 5.00 13.25 14.25 14.25 14.25 13.23
E Checking & Cage Lowering hrs 5.00 20.50 30.50 30.50 30.50 26.95
9 Sounding checking Hrs 0.5 0.5 0.5 0.5 0.5
10 Cage lowering Hrs 4 20 30 30 30
F Tremie lowering hrs 0.50 1.00 1.30 1.30 1.30 1.19
G Flushing & Concreting hrs 5.00 9.10 13.67 13.67 13.67 12.35
H Totals
11 Total -1 hrs 16.50 46.35 64.22 78.22 64.22 61.86
12 Addnl. 13% for idle and Miscellaneous hrs 2.15 6.03 8.35 10.17 8.35
13 Total -2 hrs 18.65 52.38 72.57 88.39 72.57 69.90
14 Waiting before start of adjacent pile hrs 0.00 0.00 0.00 0.00 24.00
15 Grand Total hrs 18.65 52.38 72.57 88.39 96.57 77.10
I
Total Time of Piling
(Considering 20 hrs/ day)
days 0.94 2.62 3.63 4.42 4.83 3.86
Unit
Description
P-10,9,8,7,6,5
Time Cycle - Single Pile
Avg.
Planned
S.No
This was not followed during
execution, after due consultation
with client.
Hence for comparison,
(24hrs x 18No.s)/ (20 hrs/day)
= 22 days
is reduced from the total planned
duration
Note:
24 hrs. waiting time is added to every
alternate pile in marine location to
meet the requirements of technical
specification.
i.e,
Start : 01/Sep/ 2014
Finish : 18/ Jun/ 2015
Duration = 290 days
Reduce 22 days
Duration of Piling = 268 days
17
Minimum & Maximum Achieved Time Cycle
Vs Planned Time cycle
Inferences
1. Achieved time cycles < planned time cycles & max. reduction is as high as 50%.
2. Overall average of all the large diameter piles is 2.55 days/pile < 3.86 days/pile (avg. planned time).
Description Location Pile Boring
Depth
Total
Working
Planned Durations - Land
(no idling) 42 59.72
Minimum Achieved Time Cycle - Single Pile on land - Pile dia. 2.5m and depth 62m
(Only Activity Durations Considered in both planned & actual)
Actual
P11-05
62.99 30.75
% Difference
(Actual - Planned)
48.51
Maximum Achieved Time Cycle - Single Pile on land - Pile dia. 2.5m and depth 62m
(Only Activity Durations Considered in both planned & actual)
P04-06 63.63 67.50
% Difference
(Actual - Planned) -13.03%
Planned Durations - Land
(13% idling and Miscellaneous added)
42 72.57
Minimum Achieved Time Cycle - Single Pile on Land - Pile dia. 2.5m and depth 62m
(Miscellaneous added in case of planned cycle & idling between activities added in case of actual)
P11-05 62.99 35.42
% Difference
(Actual - Planned)
51.20
Maximum Achieved Time Cycle - Single Pile on Land - Pile dia. 2.5m and depth 62m
(Miscellaneous added in case of planned cycle & idling between activities added in case of actual)
P04-06 63.63 71.08
% Difference
(Actual - Planned)
2.05%
Planned Durations - Marine
(no idling)
42 64.22
Minimum Achieved Time Cycle - Single Pile - Marine - Pile dia. 2.5m and depth 62m
(Only Activity Durations Considered in both planned & actual)
P05-05 41.56 40.90
% Difference
(Actual - Planned)
36.31%
Maximum Achieved Time Cycle - Single Pile - Marine - Pile dia. 2.5m and depth 62m
(Only Activity Durations Considered in both planned & actual)
P09-05 48.95 45.70
% Difference
(Actual - Planned)
28.84%
Planned Durations - Marine
(13% idling and Miscellaneous added)
42 72.57
Minimum Achieved Time Cycle - Single Pile Marine- Pile dia. 2.5m and depth 62m
(Miscellaneous added in case of planned cycle & idling between activities added in case of actual) waiting period not added
P05-05 41.56 44.98
% Difference
(Actual - Planned)
38.01%
Maximum Achieved Time Cycle - Single Pile Marine- Pile dia. 2.5m and depth 62m
(Miscellaneous added in case of planned cycle & idling between activities added in case of actual) waiting period not added
P09-05 48.95 95.87
% Difference
(Actual - Planned) -32.11%
18
S.No. Description Location
Pile Boring
Depth
Total
Working
A-2 Minimum - Land - Without idle time
Actual
P11-05 62.99 30.75
A-4 Maximum - Land - Without idle time P04-06 63.63 67.50
% Difference
(A4-A2) / A4
1.00% 54.44%
B-2 Minimum - Land - With idle time P11-05 62.99 35.42
B-4 Maximum - Land - With idle time P04-06 63.63 71.08
% Difference
(B4-B2) / B4 1.00% 50.18%
C-2 Minimum - Marine - Without idle time P05-05 41.56 40.90
C-4 Maximum - Marine - Without idle time P09-05 48.95 45.70
% Difference
(C4-C2) / C4 15.10% 10.50%
D-2 Minimum - Marine - With idle time P05-05 41.56 44.98
D-4 Maximum - Marine - With idle time P09-05 48.95 95.87
% Difference
(D4-D2) / D4
15.10% 53.08%
Minimum Vs Maximum Achieved Time Cycle
Inferences
Difference between maximum and minimum
achieved time cycles in all the cases is more
than 50%; which is considerably high.
In both land and marine conditions
Maximum time - first pile in the sequence &
Minimum time - last pile in the sequence
Hence a part of the significant difference can
be attributed as learning curve .
This shall be the first area of improvement in
the activity :
– Shows that the personnel deployed are
either inexperienced in the type of activity/
are not exposed to similar work conditions.
– Pre- Training shall be imparted to everyone
on the activity to ensure that all are ready to
take up the work.
- Measures like, carrying out trail run of the
entire activity prior to its actual start shall be
taken up to reduce the learning curve.
19
Actual Working Time Vs Total Working time
Inferences
Clearly, apart from learning curve,
The idle time between activities has also majorly contributed
(as high as 50% - case 4 above)
to the difference between best achieved time cycle and least possible time cycle.
Hence, this shall be the second area of improvement in the activity :
1. Less coordination between various teams involved in an activity have attributed to the difference.
2. Various teams should be coordinated and controlled uniformly throughout the entire activity.
20
Analysis of Averages
Note:
Avg. Working Time:
Planned - Avg. Duration
planned for each activity.
Actual - Avg. time taken by
the activities of all 60 No’s of
piles, without considering the
idle time, between activities.
Total Working Time:
Planned - Avg. Planned time
along with 13% extra for
idle, misc. and weather
conditions.
Actual - Avg. time taken by
the activities of all 60 No’s of
piles, after considering the
idle time, between activities.
Inferences
The difference between planned and actual durations
1. Is almost 50% at peak
2. It is reduced 25% on average.
3. Difference is further reduced from 25% to 21%
(if idle time b/w activities is added to the actual activity working time).
21
Total Duration Analysis/ Date Analysis
S.No.
Description Start Finish Duration Waiting Time Net Duration
1 2 3 4 = (3 - 2) 5 6 = (4-5)
1 Planned 1-Sep-14 18-Jun-15 290 22 268
2 Actual 22-Oct-14 15-Jul-15 266 0 266
3
Difference
3 = (2-1)
51 27 -24 -21.6 -0.89%
4 Remarks Late Start Late Finish
High Reduction
in actual
duration
Not Considered
during execution
Negligible
reduction in
actual duration
Inferences
The difference between planned and actual durations
1. Is further reduced from 21% to almost nil.
2. Considerably high time is lost in non-value adding activities – Hence a delay analysis is required
22
Inferences
Overall duration lapsed during Piling in
other than actual piling activities can be
broadly classified into the following five
categories
1. Client Related issues
2. Learning Curve
3. Location shifting, positioning & liner
driving
4. Equipment breakdown
5. Non – Availability of materials
S.No. Description of delay
Duration
Remarks
hrs days
A Client Related 443.50 18.48 External
B Learning Curve 294.33 12.26
1Initial - Land 200.67 8.36 Part of Work
2Intitial - Marine 48.67 2.03 Part of Work
3Twin vibro Driving 45.00 1.88 Part of Work
C
Location Shifting,
Positioning & Liner driving 1351.60 56.32
1Land 587.75 24.49 Part of Work
2Marine 763.85 31.83 Part of Work
D Equipment Break down 224.50 9.35
1Crane 56.50 2.35 Could have been avoided
2Rig 168.00 7.00 Could have been avoided
E Non Availability 1194.20 49.76
1O-Cell 362.45 15.10 Mix of external & Internal
2Crane 261.08 10.88 Mix of external & Internal
3Vibro 481.33 20.06 Mix of external & Internal
4Reinforcement Cage 36.00 1.50 Could have been Avoided
5Liner 53.33 2.22 Could have been Avoided
F Grand Total 3508.13 146.17
Good Work Done - Could
have been less by min. 50
days
(Sum of E)
Delay Analysis - Summary
23
Distribution of Total Time - Planned
S.No. Description Days
1
Location Shifting of Jackup & Rig,
Positioning & Liner driving
31.30
2 Boring 50.78
3 Checking & Cage Lowering 103.49
4 Tremie lowering 4.57
5 Flushing & Concreting 47.41
6 Addnl. for Idle and Miscellaneous 30.88
Total Duration 268
24
Distribution of Total Time - Actual
S.No. Description Days
1 Client Related Issues 18.48
2 Learning Curve 12.26
3 Actual Working Time of Activities 98.20
4
Location Shifting of Jackup & Rig,
Positioning & Liner driving
56.32
5 Ilding Time b/w Activities 22.50
6 Equipment Break down Time 9.35
7 Non Availability of various materials 49.76
Total Duration 266
25
Summary of Inferences from the Case Study
From analysis of achieved time cycles the following can be inferred
1. The least achieved time cycle is 50% less than planned time cycle.
2. Considering overall average - Planned time Vs Actual Time reduced from 50% to 25%.
3. Considering idle time between various activities with in construction of a single pile further
reduced the difference from 25% to 21%.
4. Lag between piling groups further narrowed the gap and made it almost nil (0.89%).
From Delay analysis the following can be inferred
5. Actual activity duration taken is only 58% (37% - Working + 21% - Shifting).
6. Of the remaining 42%, 15% (5%+ 7%+ 3%) can be attributed to learning curve, client related
issues and equipment down time respectively.
7. Remaining 27% (19% + 8%) is caused due to non-availability of materials in time and idling time
between activities within construction of a single pile respectively.
26
Conclusions from the Case Study
Planning
1. Planning has been carried out
carefully.
2. Due consideration has been
given to the expected
deviations, delays and non
working activities.
3. As per the above analysis, in
the planning stage, along with
following the client time line,
it is to be ensured that an
additional buffer time of 15%
(min.) to 42 % (max.) is
provided to each critical
activity to account for all the
unforeseen conditions.
Execution
1. Execution has been carried out
very well in the given time.
2. Initial delay in start of the
activity could have been
avoided.
3. “Waiting period before start of
next pile” – clause has been
logically negotiated with
client, which helped in
reducing the overall duration
of piling.
4. Additional measures like
providing 2 polymer lines,
working round the clock, and
shifting jack up barge location
in high flood helped in
carrying out the activities
within the given time.
Execution Excellence
1. A detailed analysis of the
achieved duration shows that
execution time could have
been reduced by as high as
27% (72 days approx.), if
related activities and teams
were coordinated in a better
way.
2. A further reduction up to 15%
(40 days approx.) is also
possible if carried out very
carefully.
Finally
It can be concluded that, if 2.5m diameter piles of 62m length are to be constructed in similar environmental &
soil conditions again, a planned duration of 268 days shall be allotted.
But at the same time it can be completed in as low as 190 days – 150 days.
27
Conclusions
From the above case study it can be concluded that
“a detailed achieved productivity analysis of an activity gives a
clear picture of how the activity has been carried out and helps in
identifying the areas of improvement which make the activity
from a mere good activity to an excellent activity”.
Similar analysis when carried out on all the activities carried out
for all the activities in a project will make the future projects
excellent.
Thus analysis of achieved duration is one of the best ways to
implement operational excellence and take AFCONS to level next.
28
Acknowledgements
G Mathisekharan, HOD, CPMG
AK Guru, Project Controller, 6265 – Bangladesh
Ajit Penkar, Chief Construction Manager, 6265 – Bangladesh
Bimal Kumar, Dy. Project Manager, 6265 – Bangladesh
Navdeep Singh, Planning Engineer, 6265 – Bangladesh
Suraj Itankar, Project Coordinator, 6265 – Bangladesh
Saravana Kumar M, CPMG, HO
& entire CPMG Team
Team EDCC
Thank You
Queries Please?

Engineers Day -2015 September Revision.pptx

  • 1.
    A Case StudyBased on Large Diameter Piling at 6265 – Bangladesh Project Achieved Productivity Analysis - An Approach to Identify Areas of Improvement & Implement Operational Excellence Srinivas. V. Mallick CPMG, HO
  • 2.
    2 How to Improvean Operation? “Improvement is a continuous process – not a destination”
  • 3.
    3 Introduction to theProject Under Study – 6265 – Bangladesh Project
  • 4.
    4 Project Location &Existing Conditions First Bhairabh Railway Bridge - Exisiting
  • 5.
    5 Bridge No.: 29 BridgeNo.: 28 Bridge No.: 27 Major Bridge No.: 26 Bridge No.: 25A Bridge No.: 25 Bridge No.: 24 S.No. Description of Bridge Total Length (m) 1. Total Length of Alignment 3724.458 2. Total Length of All Bridges 1129.50 3. Total Length of Major Bridge No.: 26 982.0 Total Length of Alignment 3724.458m 1 Major Bridge & 6 Minor Bridges spread along a Bhairabh Bazaar Ashuganj Project Overview
  • 6.
    6 1.2 Dia. Piling@ 3 Locations – 2 x 9 + 1 x 16 = 34 No.s 2.5 Dia. Piling @ 10 Locations – 10 x 6 = 60 No.s Scope of Large Diameter Piling
  • 7.
    7 * Pile CutoffLevel: +3.0mCD Existing Ground Level: Varies +7.5mCD at A2 to -20.5mCD at P05 Pile Termination Level: -59.0 mCD Pile Length : 62m (max.) Elevation Liner Termination Level: -27.0 mCD (max.) 7.5m c/c 12.5m c/c Plan Initial Innovations: After initial site visit, Proposal for change in Pile Cutoff Level from +1.0mCD to +3.0 mCD has been submitted, which helped in carrying out work in high flood level. For proposal drawing Click here. 2.5m dia. Pile Group - Typical
  • 8.
    8 1 2 34 5 6 7 8 9 10 11 12 13 14 15 16 17 18 19 20 21 22 23 24 25 26 27 -60 -40 -20 0 20 40 60 80 100 120 Depth, -49 N-Value, 100 Depth Vs N-Value (Typical) Depth (in m) ----> N Value ----> Soil Type: Mixture of – light grey to grey – silty sand, fine sand & clayey sand Soil Conditions - Typical
  • 9.
    9 Environmental Conditions -Extreme Jack Up Shifting in high flood condition – Location P06 to P05 • Highest Flood Level : 7.71 mCD • Lowest Flood Level : 1.01 mCD • Yearly Flood Variation : 6.7m Deepest Water : -20.5 to +6.5 = 27m Highest Current: 1.8 m/s i.e., 3.5 knots
  • 10.
    10 Planned Actual Offices & LabWork Shop & Stores Liner Fab, Reinf. & Sht. Batching Plant & Agg. Stack Facilities Developed – Offices & Yards
  • 11.
    11 Facilities Developed –Load out & Walkway Load Out Using Timber Piles Access Walkway Initial Innovations: 1. Use of locally available timber for load out construction 2. Dual Use of Load out - Work at P11 completed as land based work Old Lessons Implemented: Access Walkway planned based on walkway used at 2274 - DAHEJ Standby Jetty
  • 12.
    12 Major Piling Equipments Summary 1.Jack Up Barge: Type – Raja 2. Crane: 250MT capacity 3. Crane Barge: 1200MT capacity 4. Piling Rig: Bauer BG 38 5. Vibro Hammer: ICE 110HD Actual Planned Jack Up Barge: Type – Raja Crane: 250MT capacity Crane Barge: 1200MT capacity Piling Rig: Bauer BG 38
  • 13.
    13 Large Diameter Piling– Overview Video
  • 14.
    14 Data Collection Duration ofevery activity of every individual pile has been carefully collected and the reasons for early completion/ Delay has been carefully noted and the same is as follows: S.No. Pile Location Start Time Finish Time Time b/w locations (Finish of Previous Pile to Start of Next Pile in hrs) Reason for Dealy/ Early Work 0 Planned 01-Sep-14 18-Jun-15 1 A02-1 22-10-14 09:00:00 23-10-14 08:20:00 Initial Dealy - mobilisation of Rig, Polymer Pump etc 2 A02-6 25-10-14 12:00:00 26-10-14 00:30:00 51.67 Learning Curve 3 A02-2 28-10-14 00:25:00 28-10-14 18:45:00 47.92 Learning Curve 4 A02-5 30-10-14 22:00:00 31-10-14 18:45:00 51.25 Learning Curve 5 A02-3 1-11-14 03:20:00 1-11-14 18:40:00 8.58 Learning Curve 6 P03-1 19-11-14 00:25:00 20-11-14 03:25:00 437.75 Rig shifting - to Ashuganj side 7 P03-3 21-11-14 20:40:00 23-11-14 03:35:00 41.25 Learning Curve 8 P03-6 23-11-14 23:00:00 25-11-14 08:05:00 19.42 Rig Positioning & Survey & Liner Driving 9 P03-4 25-11-14 16:15:00 27-11-14 02:30:00 8.17 Rig Positioning & Survey & Liner Driving 10 P03-2 27-11-14 18:25:00 29-11-14 01:30:00 15.92 Rig Positioning & Survey & Liner Driving 11 P04-3 17-12-14 13:00:00 22-12-14 03:00:00 443.50 Client Related - finalisation of Pile depth 12 P03-5 2-1-15 00:05:00 3-1-15 13:00:00 261.08 Non availabilty - 250MT crane, O-Cell 13 P04-1 3-1-15 20:00:00 7-1-15 00:40:00 7.00 Rig Positioning & Survey & Liner Driving 14 P04-6 7-1-15 23:15:00 10-1-15 22:00:00 22.58 Rig Positioning & Survey & Liner Driving 15 P04-4 11-1-15 07:00:00 14-1-15 01:00:00 9.00 Non availabilty - Reinforcement Cage 16 P04-2 15-1-15 04:00:00 17-1-15 18:48:00 27.00 Non availabilty - Cage 17 P04-5 1-2-15 21:15:00 5-2-15 04:30:00 362.45 Non availabilty - O-Cell 18 P11-5 11-2-15 10:30:00 14-2-15 09:55:00 150.00 Rig shifting - to Bhairabh side 19 A02-4 14-2-15 13:00:00 14-2-15 21:30:00 0.00 No Delay & parallel work 20 P11-4 16-2-15 18:30:00 19-2-15 17:30:00 45.00 Learning Curve - Liner driving with twin vibro 21 P11-3 22-2-15 02:00:00 24-2-15 18:05:00 56.50 Break Down - Crane 22 P11-1 23-2-15 15:00:00 26-2-15 18:05:00 0.00 No Delay & parallel work 23 P11-6 26-2-15 23:00:00 1-3-15 18:20:00 4.92 Rig Positioning & Survey & Liner Driving 24 P11-2 28-2-15 04:45:00 3-3-15 23:55:00 0.00 Rig Positioning & Survey & Liner Driving 25 P10-6 23-3-15 21:15:00 26-3-15 05:50:00 481.33 Non availabilty - 110hd vibro 26 P10-1 28-3-15 06:30:00 30-3-15 06:05:00 48.67 Learning Curve - marine piling 27 P10-2 31-3-15 14:25:00 2-4-15 19:40:00 32.33 Jack Up shifting& Rig Positioning& Survey& Liner Driving 28 P10-5 1-4-15 12:30:00 3-4-15 19:10:00 0.00 No Delay & parallel work 29 P10-4 4-4-15 23:50:00 7-4-15 14:28:00 28.67 Jack Up shifting& Rig Positioning& Survey& Liner Driving 30 P10-3 5-4-15 17:22:00 8-4-15 19:04:00 0.00 No Delay & parallel work 31 P09-6 10-4-15 11:15:00 13-4-15 08:09:00 31.25 Jack Up shifting& Rig Positioning& Survey& Liner Driving 32 P09-1 11-4-15 05:00:00 16-4-15 04:15:00 0.00 No Delay & parallel work 33 P09-5 17-4-15 10:00:00 22-4-15 09:52:00 29.75 Jack Up shifting& Rig Positioning& Survey& Liner Driving 34 P09-2 18-4-15 22:15:00 23-4-15 16:42:00 0.00 No Delay & parallel work 35 P09-4 25-4-15 00:15:00 27-4-15 18:40:00 35.55 Jack Up shifting& Rig Positioning& Survey& Liner Driving 36 P09-3 26-4-15 03:00:00 30-4-15 00:37:00 0.00 No Delay & parallel work 37 P08-6 1-5-15 18:00:00 4-5-15 04:30:00 41.38 Jack Up shifting& Rig Positioning& Survey& Liner Driving 38 P08-1 2-5-15 17:00:00 5-5-15 04:30:00 0.00 No Delay & parallel work 39 P08-5 6-5-15 06:45:00 8-5-15 06:40:00 14.25 Jack Up shifting& Rig Positioning& Survey& Liner Driving 40 P08-2 7-5-15 06:02:00 9-5-15 19:20:00 0.00 No Delay & parallel work 41 P07-6 11-5-15 19:00:00 13-5-15 21:20:00 47.67 Jack Up shifting& Rig Positioning& Survey& Liner Driving 42 P07-1 12-5-15 18:40:00 14-5-15 23:08:00 0.00 No Delay & parallel work 43 P08-4 16-5-15 22:00:00 19-5-15 22:00:00 46.87 Jack Up shifting& Rig Positioning& Survey& Liner Driving 44 P08-3 17-5-15 19:00:00 20-5-15 20:30:00 0.00 Non availabilty - O - Cell 45 P07-5 22-5-15 10:10:00 24-5-15 10:35:00 35.67 Jack Up shifting& Rig Positioning& Survey& Liner Driving 46 P07-2 23-5-15 03:30:00 25-5-15 18:09:00 0.00 No Delay & parallel work 47 P07-4 26-5-15 18:09:00 29-5-15 03:20:00 24.00 Jack Up shifting& Rig Positioning& Survey& Liner Driving 48 P07-3 27-5-15 09:10:00 29-5-15 10:15:00 0.00 No Delay & parallel work 49 P06-6 5-6-15 05:00:00 7-6-15 06:15:00 162.75 Jack Up shifting& Rig Positioning& Survey& Liner Driving 50 P06-1 6-6-15 13:00:00 8-6-15 17:47:00 0.00 No Delay & parallel work 51 P06-5 10-6-15 18:15:00 13-6-15 22:20:00 48.47 Jack Up shifting& Rig Positioning& Survey& Liner Driving 52 P06-2 15-6-15 00:10:00 17-6-15 07:20:00 25.83 Non availabilty - Liner 53 P06-3 18-6-15 17:00:00 21-6-15 01:35:00 33.67 Jack Up shifting& Rig Positioning& Survey& Liner Driving 54 P06-4 19-6-15 16:00:00 22-6-15 18:25:00 0.00 No Delay & parallel work 55 P05-1 25-6-15 20:00:00 28-6-15 18:31:00 73.58 Jack Up shifting& Rig Positioning& Survey& Liner Driving 56 P05-6 27-6-15 14:00:00 30-6-15 16:30:00 0.00 No Delay & parallel work 57 P05-5 1-7-15 20:00:00 3-7-15 17:05:00 27.50 Non availabilty - Liner 58 P05-2 2-7-15 17:00:00 5-7-15 02:35:00 0.00 No Delay & parallel work 59 P05-3 6-7-15 01:00:00 14-7-15 17:10:00 22.42 Break Down - Rig - Wire rope broken 60 P05-4 13-7-15 11:00:00 15-7-15 12:40:00 0.00 No Delay & parallel work “Not visible?” – Un utilized/ Data without analysis is as good as invisible data!
  • 15.
    15 Achieved Productivity Analysis Note: Inall the individual comparisons of time cycles carried out here in the analysis, extreme deviations caused due to reasons like equipment break down are not considered, as it will effect the average adversely. The same has been added in the total duration comparison.
  • 16.
    16 Planned Time Cycles& Durations A2 P3 P4, P11 20m 40m 62m Odd Even No.s of Piles at the location No.s 6 6 12 18 18 A Pre- Boring Activities hrs 1.00 2.50 4.50 18.50 4.50 8.15 1 Survey and positioning of Barge Hrs 10.00 2 Guide Fixing Hrs 4.00 3 Liner Lowering Hrs 0.50 2.00 4.00 4.00 4.00 4 Rig Positioning Hrs 0.50 0.50 0.50 0.50 0.50 B Boring Depth m 20.00 40.00 42.00 42.00 42.00 39.60 5 In Soil m 20 27 27 27 27 6 In Compacted Sand m 0 13 15 15 15 C Boring Productivity m/hr 4.00 3.02 2.95 2.95 2.95 3.06 7 In Soil m/hr 4 4 4 4 4 8 In Compacted Sand m/hr 2 2 2 2 2 D Boring hrs 5.00 13.25 14.25 14.25 14.25 13.23 E Checking & Cage Lowering hrs 5.00 20.50 30.50 30.50 30.50 26.95 9 Sounding checking Hrs 0.5 0.5 0.5 0.5 0.5 10 Cage lowering Hrs 4 20 30 30 30 F Tremie lowering hrs 0.50 1.00 1.30 1.30 1.30 1.19 G Flushing & Concreting hrs 5.00 9.10 13.67 13.67 13.67 12.35 H Totals 11 Total -1 hrs 16.50 46.35 64.22 78.22 64.22 61.86 12 Addnl. 13% for idle and Miscellaneous hrs 2.15 6.03 8.35 10.17 8.35 13 Total -2 hrs 18.65 52.38 72.57 88.39 72.57 69.90 14 Waiting before start of adjacent pile hrs 0.00 0.00 0.00 0.00 24.00 15 Grand Total hrs 18.65 52.38 72.57 88.39 96.57 77.10 I Total Time of Piling (Considering 20 hrs/ day) days 0.94 2.62 3.63 4.42 4.83 3.86 Unit Description P-10,9,8,7,6,5 Time Cycle - Single Pile Avg. Planned S.No This was not followed during execution, after due consultation with client. Hence for comparison, (24hrs x 18No.s)/ (20 hrs/day) = 22 days is reduced from the total planned duration Note: 24 hrs. waiting time is added to every alternate pile in marine location to meet the requirements of technical specification. i.e, Start : 01/Sep/ 2014 Finish : 18/ Jun/ 2015 Duration = 290 days Reduce 22 days Duration of Piling = 268 days
  • 17.
    17 Minimum & MaximumAchieved Time Cycle Vs Planned Time cycle Inferences 1. Achieved time cycles < planned time cycles & max. reduction is as high as 50%. 2. Overall average of all the large diameter piles is 2.55 days/pile < 3.86 days/pile (avg. planned time). Description Location Pile Boring Depth Total Working Planned Durations - Land (no idling) 42 59.72 Minimum Achieved Time Cycle - Single Pile on land - Pile dia. 2.5m and depth 62m (Only Activity Durations Considered in both planned & actual) Actual P11-05 62.99 30.75 % Difference (Actual - Planned) 48.51 Maximum Achieved Time Cycle - Single Pile on land - Pile dia. 2.5m and depth 62m (Only Activity Durations Considered in both planned & actual) P04-06 63.63 67.50 % Difference (Actual - Planned) -13.03% Planned Durations - Land (13% idling and Miscellaneous added) 42 72.57 Minimum Achieved Time Cycle - Single Pile on Land - Pile dia. 2.5m and depth 62m (Miscellaneous added in case of planned cycle & idling between activities added in case of actual) P11-05 62.99 35.42 % Difference (Actual - Planned) 51.20 Maximum Achieved Time Cycle - Single Pile on Land - Pile dia. 2.5m and depth 62m (Miscellaneous added in case of planned cycle & idling between activities added in case of actual) P04-06 63.63 71.08 % Difference (Actual - Planned) 2.05% Planned Durations - Marine (no idling) 42 64.22 Minimum Achieved Time Cycle - Single Pile - Marine - Pile dia. 2.5m and depth 62m (Only Activity Durations Considered in both planned & actual) P05-05 41.56 40.90 % Difference (Actual - Planned) 36.31% Maximum Achieved Time Cycle - Single Pile - Marine - Pile dia. 2.5m and depth 62m (Only Activity Durations Considered in both planned & actual) P09-05 48.95 45.70 % Difference (Actual - Planned) 28.84% Planned Durations - Marine (13% idling and Miscellaneous added) 42 72.57 Minimum Achieved Time Cycle - Single Pile Marine- Pile dia. 2.5m and depth 62m (Miscellaneous added in case of planned cycle & idling between activities added in case of actual) waiting period not added P05-05 41.56 44.98 % Difference (Actual - Planned) 38.01% Maximum Achieved Time Cycle - Single Pile Marine- Pile dia. 2.5m and depth 62m (Miscellaneous added in case of planned cycle & idling between activities added in case of actual) waiting period not added P09-05 48.95 95.87 % Difference (Actual - Planned) -32.11%
  • 18.
    18 S.No. Description Location PileBoring Depth Total Working A-2 Minimum - Land - Without idle time Actual P11-05 62.99 30.75 A-4 Maximum - Land - Without idle time P04-06 63.63 67.50 % Difference (A4-A2) / A4 1.00% 54.44% B-2 Minimum - Land - With idle time P11-05 62.99 35.42 B-4 Maximum - Land - With idle time P04-06 63.63 71.08 % Difference (B4-B2) / B4 1.00% 50.18% C-2 Minimum - Marine - Without idle time P05-05 41.56 40.90 C-4 Maximum - Marine - Without idle time P09-05 48.95 45.70 % Difference (C4-C2) / C4 15.10% 10.50% D-2 Minimum - Marine - With idle time P05-05 41.56 44.98 D-4 Maximum - Marine - With idle time P09-05 48.95 95.87 % Difference (D4-D2) / D4 15.10% 53.08% Minimum Vs Maximum Achieved Time Cycle Inferences Difference between maximum and minimum achieved time cycles in all the cases is more than 50%; which is considerably high. In both land and marine conditions Maximum time - first pile in the sequence & Minimum time - last pile in the sequence Hence a part of the significant difference can be attributed as learning curve . This shall be the first area of improvement in the activity : – Shows that the personnel deployed are either inexperienced in the type of activity/ are not exposed to similar work conditions. – Pre- Training shall be imparted to everyone on the activity to ensure that all are ready to take up the work. - Measures like, carrying out trail run of the entire activity prior to its actual start shall be taken up to reduce the learning curve.
  • 19.
    19 Actual Working TimeVs Total Working time Inferences Clearly, apart from learning curve, The idle time between activities has also majorly contributed (as high as 50% - case 4 above) to the difference between best achieved time cycle and least possible time cycle. Hence, this shall be the second area of improvement in the activity : 1. Less coordination between various teams involved in an activity have attributed to the difference. 2. Various teams should be coordinated and controlled uniformly throughout the entire activity.
  • 20.
    20 Analysis of Averages Note: Avg.Working Time: Planned - Avg. Duration planned for each activity. Actual - Avg. time taken by the activities of all 60 No’s of piles, without considering the idle time, between activities. Total Working Time: Planned - Avg. Planned time along with 13% extra for idle, misc. and weather conditions. Actual - Avg. time taken by the activities of all 60 No’s of piles, after considering the idle time, between activities. Inferences The difference between planned and actual durations 1. Is almost 50% at peak 2. It is reduced 25% on average. 3. Difference is further reduced from 25% to 21% (if idle time b/w activities is added to the actual activity working time).
  • 21.
    21 Total Duration Analysis/Date Analysis S.No. Description Start Finish Duration Waiting Time Net Duration 1 2 3 4 = (3 - 2) 5 6 = (4-5) 1 Planned 1-Sep-14 18-Jun-15 290 22 268 2 Actual 22-Oct-14 15-Jul-15 266 0 266 3 Difference 3 = (2-1) 51 27 -24 -21.6 -0.89% 4 Remarks Late Start Late Finish High Reduction in actual duration Not Considered during execution Negligible reduction in actual duration Inferences The difference between planned and actual durations 1. Is further reduced from 21% to almost nil. 2. Considerably high time is lost in non-value adding activities – Hence a delay analysis is required
  • 22.
    22 Inferences Overall duration lapsedduring Piling in other than actual piling activities can be broadly classified into the following five categories 1. Client Related issues 2. Learning Curve 3. Location shifting, positioning & liner driving 4. Equipment breakdown 5. Non – Availability of materials S.No. Description of delay Duration Remarks hrs days A Client Related 443.50 18.48 External B Learning Curve 294.33 12.26 1Initial - Land 200.67 8.36 Part of Work 2Intitial - Marine 48.67 2.03 Part of Work 3Twin vibro Driving 45.00 1.88 Part of Work C Location Shifting, Positioning & Liner driving 1351.60 56.32 1Land 587.75 24.49 Part of Work 2Marine 763.85 31.83 Part of Work D Equipment Break down 224.50 9.35 1Crane 56.50 2.35 Could have been avoided 2Rig 168.00 7.00 Could have been avoided E Non Availability 1194.20 49.76 1O-Cell 362.45 15.10 Mix of external & Internal 2Crane 261.08 10.88 Mix of external & Internal 3Vibro 481.33 20.06 Mix of external & Internal 4Reinforcement Cage 36.00 1.50 Could have been Avoided 5Liner 53.33 2.22 Could have been Avoided F Grand Total 3508.13 146.17 Good Work Done - Could have been less by min. 50 days (Sum of E) Delay Analysis - Summary
  • 23.
    23 Distribution of TotalTime - Planned S.No. Description Days 1 Location Shifting of Jackup & Rig, Positioning & Liner driving 31.30 2 Boring 50.78 3 Checking & Cage Lowering 103.49 4 Tremie lowering 4.57 5 Flushing & Concreting 47.41 6 Addnl. for Idle and Miscellaneous 30.88 Total Duration 268
  • 24.
    24 Distribution of TotalTime - Actual S.No. Description Days 1 Client Related Issues 18.48 2 Learning Curve 12.26 3 Actual Working Time of Activities 98.20 4 Location Shifting of Jackup & Rig, Positioning & Liner driving 56.32 5 Ilding Time b/w Activities 22.50 6 Equipment Break down Time 9.35 7 Non Availability of various materials 49.76 Total Duration 266
  • 25.
    25 Summary of Inferencesfrom the Case Study From analysis of achieved time cycles the following can be inferred 1. The least achieved time cycle is 50% less than planned time cycle. 2. Considering overall average - Planned time Vs Actual Time reduced from 50% to 25%. 3. Considering idle time between various activities with in construction of a single pile further reduced the difference from 25% to 21%. 4. Lag between piling groups further narrowed the gap and made it almost nil (0.89%). From Delay analysis the following can be inferred 5. Actual activity duration taken is only 58% (37% - Working + 21% - Shifting). 6. Of the remaining 42%, 15% (5%+ 7%+ 3%) can be attributed to learning curve, client related issues and equipment down time respectively. 7. Remaining 27% (19% + 8%) is caused due to non-availability of materials in time and idling time between activities within construction of a single pile respectively.
  • 26.
    26 Conclusions from theCase Study Planning 1. Planning has been carried out carefully. 2. Due consideration has been given to the expected deviations, delays and non working activities. 3. As per the above analysis, in the planning stage, along with following the client time line, it is to be ensured that an additional buffer time of 15% (min.) to 42 % (max.) is provided to each critical activity to account for all the unforeseen conditions. Execution 1. Execution has been carried out very well in the given time. 2. Initial delay in start of the activity could have been avoided. 3. “Waiting period before start of next pile” – clause has been logically negotiated with client, which helped in reducing the overall duration of piling. 4. Additional measures like providing 2 polymer lines, working round the clock, and shifting jack up barge location in high flood helped in carrying out the activities within the given time. Execution Excellence 1. A detailed analysis of the achieved duration shows that execution time could have been reduced by as high as 27% (72 days approx.), if related activities and teams were coordinated in a better way. 2. A further reduction up to 15% (40 days approx.) is also possible if carried out very carefully. Finally It can be concluded that, if 2.5m diameter piles of 62m length are to be constructed in similar environmental & soil conditions again, a planned duration of 268 days shall be allotted. But at the same time it can be completed in as low as 190 days – 150 days.
  • 27.
    27 Conclusions From the abovecase study it can be concluded that “a detailed achieved productivity analysis of an activity gives a clear picture of how the activity has been carried out and helps in identifying the areas of improvement which make the activity from a mere good activity to an excellent activity”. Similar analysis when carried out on all the activities carried out for all the activities in a project will make the future projects excellent. Thus analysis of achieved duration is one of the best ways to implement operational excellence and take AFCONS to level next.
  • 28.
    28 Acknowledgements G Mathisekharan, HOD,CPMG AK Guru, Project Controller, 6265 – Bangladesh Ajit Penkar, Chief Construction Manager, 6265 – Bangladesh Bimal Kumar, Dy. Project Manager, 6265 – Bangladesh Navdeep Singh, Planning Engineer, 6265 – Bangladesh Suraj Itankar, Project Coordinator, 6265 – Bangladesh Saravana Kumar M, CPMG, HO & entire CPMG Team Team EDCC
  • 29.