This document summarizes an experiment conducted in a wind tunnel to analyze drag forces on various objects. Seven objects were tested - a sphere, streamlined shape, hemispheres, disk, and spheres. Graphs of drag vs velocity and Reynolds number were created from the data. The sphere had the most turbulent boundary layer flow, while streamlined shapes had the least. Dimples on a sphere reduced drag by creating turbulence. Testing objects in a wind tunnel before production was recommended to optimize design.
ME438 Aerodynamics is offered by Dr. Bilal Siddiqui to senior mechanical engineeing undergraduates at DHA Suffa University. This lecture set deals with thin airfoil theory.
ME 438 Aerodynamics is a course taught by Dr. Bilal Siddiqui at DHA Suffa University. This set of lectures start from the basic and all the way to aerodynamic coefficients and center of pressure variations with angle of attack.
Analysis of Ground Effect on a Symmetrical AirfoilIJERA Editor
A Detailed Study and Computational Fluid Dynamics investigation was conducted to ascertain and highlight the
different ways in which ground effect phenomena are present around a symmetrical aerofoil-NACA 0015- when
in close proximity to the ground. The trends in force and flow field behaviour were observed at various ground
clearances, for different angle of attack. The analysis was carried out by varying the angle of attack from 00 to
100 and ground clearance of the trailing edge from minimum possible value to one chord length. It was found
that high values of pressure coefficient are obtained on the lower surface when the airfoil is close to the ground.
This region of high pressure extended almost over the entire lower surface for higher angles of attack. As a
result, higher values of lift coefficient are obtained when the airfoil is close to the ground. The flow accelerates
over the airfoil due to flow diversion from the lower side and higher mean velocity is observed near the suction
peak location. The pressure distribution on the upper surface did not change significantly with ground clearance
for higher angles of attack. The lift was found to drop at lower angles of attack at some values of ground
clearance due to suction effect on the lower surface as the result of formation of a convergent–divergent passage
between the airfoil and the ground plate. The values of drag coefficient were also noted for different ground
clearance, which is found to be decreasing as the airfoil is approaching to a closer ground clearance. This ground
effect is analyzed using FLUENT 5/6 code.
To evaluate the influence of the entry speed to flow field above the water surface on an object
high-speed entering into water, the flow field was measured experimentally by using an optical visualization
method. The entry speed was ranging from 0.2 to 1.5 km/s. In case that the entry speed was higher than the
sound speed of gas above the water surface, the vertical velocity of the tip of a water splash was linear to the
vertical location of the tip. The ratio between the initial vertical velocity of a water splash and the entry speed
was independent from the entry speed and was constant.A shock wave was driven above the water surface by the
entry even thoughthe entry speed was lower than the sound speed of gas above the water surface.A scaling law
for the propagation of a shock wave driven by explosion of an explosive was applicable to the propagation of
the shock wave driven by the water entry by using the kinetic energy of the entry object instead of the explosive
energy.
AIR POLLUTION CONTROL course material by Prof S S JAHAGIRDAR,NKOCET,SOLAPUR for BE (CIVIL ) students of Solapur university. Content will be also useful for SHIVAJI and PUNE university students
PPT on Bernoulli's Theorem ,with Application,Derivation, Bernoulli's Equation,Definition,About The Scientist ,Solved Example,Video Lecture,Solved Problem(Video),Dimensions.
If you liked it don't forget to follow me-
Instagram-yadavgaurav251
Facebook-www.facebook.com/yadavgaurav251
The slam induced loads on two-dimensional bodies have been studied by applying an explicit
finite element code which is based on a multi-material arbitrary Lagrangian-Eulerian
formulation and penalty coupling method. This work focuses on the assessment of total
vertical slamming force, pressure distributions at different time instances and pressure
histories on the wetted surfaces of typical rigid bodies. Meanwhile, the simulation technique
involved in the two-dimensional slamming problem is discussed through related parameter
study.
EAGES Proceedings - K. V. Rozhdestvenskii 2Stephan Aubin
In 2001 Euroavia Toulouse organized a symposium on ground effect. We invited most of the Russian and German actors, and some experts from Holland, UK or France for a week of science around the subject of ekranoplans / flying boats. This was dedicated to students. A book was issued... and now that all copies have been sold for a while I am sharing this on LinkedIn for everyone.
Enjoy.
Stéphan AUBIN
Effect of Gap between Airfoil and Embedded Rotating Cylinder on the Airfoil A...CrimsonPublishersRDMS
Effect of Gap between Airfoil and Embedded Rotating Cylinder on the Airfoil Aerodynamic Performance by Najdat Nashat Abdulla* in Crimson Publishers: Peer Reviewed Material Science Journals
Numerical investigation of fluid flow and aerodynamic performance on a 2D NAC...editorijrei
The performance of an aircraft wing mostly depends on the aerodynamic characteristics i.e. lift force, drag force, pressure distribution, the ratio of lift to drag etc. In this paper, the influence of aerodynamic performance on two dimensional NACA 4412 airfoil is investigated. The computational method consist of steady state, incompressible, finite volume method, spalart-allmaras turbulence model. The flow has been studied with the help of Navier-Stroke and continuity equations. Numerical simulations were performed at Reynolds number (1x10⁶, 2x10⁶, 3x10⁶, and 4x10⁶) at a different angle of attack (00, 30,60, and 90). The results give the satisfactory measure of confidence of fidelity of the simulation. Aerodynamic forces are calculated with different Reynolds number and angle of attack, after analyzing the data it is found that the higher lift coefficient was obtain in Re-4x10⁶ at an angle of attack 9 whereas low drag coefficient obtained in Re-1x10⁶ at AOA-0.
Effect of Turbulence Model in Numerical Simulation of Single Round Jet at Low...ijceronline
Single axi-symmetric round jet flow was analyzed using computational techniques and validated with experimental results to establish the suitable turbulence model for simulation of low Reynolds number jets exiting from fully developed pipe. This work is performed as an initial study before computationally simulating multiple impinging jets. To this end a single round jet at Reynolds number of 7500 exiting from a fully developed pipe and entering into stationary air was modeled. Velocity and turbulence profiles were extracted from the simulation and validated with in-house experimental results. It was observed that although all the four turbulence models studied were able to closely predict the mean velocity field, they were not able to accurately predict the turbulence intensity distributions. From the models studied, it was concluded that SST k- ω model was the best turbulence model for simulating low Reynolds number jet flow exiting from fully developed pipe.
CFD and EXPERIMENTAL ANALYSIS of VORTEX SHEDDING BEHIND D-SHAPED CYLINDERAM Publications
The flow around bluff bodies is an area of great research of scientists for several years. Vortex shedding is
one of the most challenging phenomenon in turbulent flows. This phenomenon was first studied by Strouhal. Many
researchers have modeled the various objects as cylinders with different cross-sections among which square and
circular cylinders were the most interested sections to study the vortex shedding phenomenon. The Vortex Shedding
frequency depends on different aspects of the flow field such as the end conditions, blockage ratio of the flow passage,
and width to height ratio. This case studies the wave development behind a D-Shaped cylinder, at different Reynolds
numbers, for which we expect a vortex street in the wake of the D-Shaped cylinder, the well known as von Kármán
Street. This body typically serves some vital operational function in aerodynamic. In circular cylinder flow separation
point changes with Reynolds number but in D-Shaped cylinder there is fix flow separation point. So there is more
wake steadiness in D-Shaped cylinder as compared to Circular cylinder and drag reduction because of wake
steadiness.In the present work CFD simulation is carried out for flow past a D-Shaped cylinder to see the wake
behavior. The Reynolds number regime currently studied corresponds to low Reynolds number, laminar and
nominally two-dimensional wake. The fluid domain is a two-dimensional plane with a D-Shaped cylinder of
dimensions B=90mm, H=80mm and L=200mm. CFD calculations of the 2-D flow past the D-Shaped cylinder are
presented and results are validated by comparing with Experimental results of pressure distribution on cylinder
surface. The experimentation is carried out using small open type wind tunnel. The flow visualization is done by
smoke visualization technique. Results are presented for various B/H ratios and Reynolds numbers. The variation of
Strouhal number with Reynolds number is found from the analysis. The focus of the present research is on reducing
the wake unsteadiness.
1. 1 | P a g e
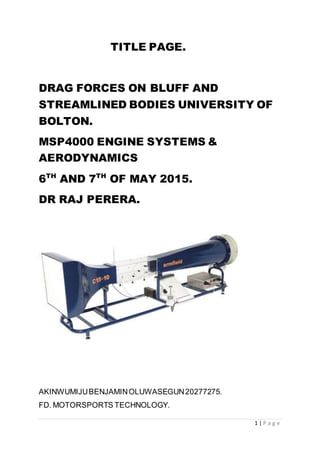
TITLE PAGE.
DRAG FORCES ON BLUFF AND
STREAMLINED BODIES UNIVERSITY OF
BOLTON.
MSP4000 ENGINE SYSTEMS &
AERODYNAMICS
6TH
AND 7TH
OF MAY 2015.
DR RAJ PERERA.
AKINWUMIJUBENJAMINOLUWASEGUN20277275.
FD. MOTORSPORTS TECHNOLOGY.
2. 2 | P a g e
ABSTRACT.
1.1 Title page.
1.2 Table of Content.
1.3 Introduction.
1.4 Main Body.
1.5 - 1.7 Table of Values.
1.8 - 4.2 Graph Table for each object used.
4.3 – 4.7 Comparisons of Each object used.
4.8 Recommendation.
4.9 Evaluation.
5.0 Appendices and References.
3. 3 | P a g e
TABLE OF CONTENT.
(1) INTRODUCTION. (Page 4).
(2) THE MAIN BODY. (Page 5 to 43).
(3) RECOMMENDATION. (Page 44).
(4) EVALUATION. (Page 45).
(5) APPENDICES. (Page 46 - 48).
(6) REFERENCES. (Page 49).
4. 4 | P a g e
INTRODUCTION.
A wind tunnel is a device used in aerodynamic research to study the effects of air
moving around a solid object, in order to know how such an object can withstand the
flow of air when it is moving through it. This test is carried out by placing or
suspending the object in the middle of the tunnel. Air is made to move past the object
by powerful fan system in other to know how the forces of air affects the object.
While this is done a careful measurement of the forces of the air is taken so as to
understand and improve on the performance of the very object before the final
production. Tunnels are designed for different purposes and speed ranges differs.
There are various forms of wind tunnels for example;
1. Subsonic, Closed Return.
2. Water Tunnel.
3. Subsonic Open Return Full Scale.
4. Supersonic Closed Return Propulsion.
5. Subsonic Open Return Smoke Tunnels.
5. 5 | P a g e
THE MAIN BODY.
This is the report of the exercise carried out at the University of Bolton, the exercise
was carried out on a wind tunnel device in order to know and understand the
theories of aerodynamics, the effects of drag forces on bluff and streamlined bodies.
To achieve this we need to take a look at the drag and lift, side forces and how
Bernoulli’s equation for pressure is applied to aerodynamics. Before the activity was
carried out here are few of the equipment used for the experiment; (1) C15-10 Wind
Tunnel with IFD7 (2) PC running system software. (3) C15-22 Drag Models. (4) C15-
13 Lift and Drag balance. (5)C15-15 Wake Survey Rake. The wind tunnel still need a
fan and bell mouth in order to work.
The wind tunnel is operated by a fan which is connected to one end of the tunnel.
What the fan does is to help in sucking air into the tunnel from the Bellmouth, the air
drawn in by the fan exits the tunnel into the room then the air will be recirculated
back into the Bellmouth. The recirculation helps in keeping the flow of air in
uniformity order during the test section. The fan is turned by a large electrically
powered drive motor. The Bellmouth is the other end of the wind tunnel where air
flows through into the tunnel, the Bellmouth has an air straight liners which are built
in the form of honeycomb, what this does is to help in straitening up of the air in the
tunnel. When all this are in place then one can go straight into the text section.
The wind tunnel that was used in carrying out the exercise was a computer
controlled subsonic wind tunnel. I started by making sure that the fan is set to zero
and also all other manometer readings are on zero velocity, then follow by selecting
the percentage to start the experiment from, select the body fitted to drag balance in
the selection box. Then the experiment can take place by increasing the fan rotation
according to the instructions given.
The following bodies were used in carrying out the experiment;
(1) Circular Disk.
(2) Concave Hemisphere.
(3) Convex Hemisphere.
(4) Small Dimpled shape.
(5) Small Plain Sphere.
(6) Small Smooth Sphere.
(7) Streamlined Shape.
After testing each of the above named objects different values were obtained for
them all as we have them on the table below.
6. 6 | P a g e
(1)CIRCULARDISK.
(2)CONVEXHEMISPHERE.
8. 8 | P a g e
(4)SMALL DIMPLED SPHERE.
(6)SMALL PLANESPHERE.
9. 9 | P a g e
(7)SPHERE.
Then after completing the testing on each of the objects, then i have to compare
each of the object in order to know the rate of flow of air around each of the objects
and also to know the velocity of flow at which the boundary layer behaviour changes
on each of the objects with the help of a graph.
Below are the results and graph of how each of the object behave in the wind tunnel
by plotting the graph of;
(1) Drag against Tunnel Velocity for each object.
(2) Drag against Reynolds Number for each object.
(3) Pressure 1-10 wake survey rake against Reynolds Number for each object.
10. 10 | P a g e
DRAG VS. TUNNEL VELOCITY (1.1) SPHERE.
37. 37 | P a g e
Below are the list of the of the various objects used for the experiment;
(1) Small Plain Sphere.
(2) Small Dimpled Sphere.
38. 38 | P a g e
(3) Convex Hemisphere.
(4) Circular Disk.
(5) Small Smooth Sphere.
(6) Streamlined Shape.
(7) Concave Hemisphere.
On each of the above models mounted inside the wind tunnel they all have different
boundry layer transition which transfers from a laminar flow to a turbulent flow. After
completing the experiment the following observations were noted on each of the
models.
(A)STREAMLINED.
The boundary layer of a streamlined shape was more turbulent and has the highest
turbulent flow on the boundry layer.
(B)Convex Hemisphre
Then folow by convex hemisphere shape which is next to the streamlined body in
terms of turbulence, though with very little difference in their boundary layer.
39. 39 | P a g e
(C)SPHERE.
Amont all other objects the sphere has the highest turbulent air flow in its boundry
layer compare to the two above mentioned models, (Streamlined & Hemisphere
Shape) and every other objects used.
(D) SMALL SMOOTH
After the ones above is the small smooth sphere which has less turbulent in its
boundry layer compare to the two above mentioned models, (Streamlined, Convex
Hemisphere & Sphere Shape).
40. 40 | P a g e
(E)SMALL DIMPLED.
The small dimpled sphere has a lesser turbulent flow of air around its boundary layer
though very close to that of the small smooth sphere.
(F)CIRCULAR DISK.
The cirular Disk has close result of turbulent flow of air with the convex in bounbary
layer compare to the other mounted objects above.
41. 41 | P a g e
Below is the list of the objects mounted according to how turbulent the air flow
around them is.
(1) . The Sphere Shape, which is the object with the highest turbulent air flow
around its boudary layer
(2) The Streamlined Shape.
(3) The convex Hemisphere.
(4) The circular Disk
(5) Concave Hemisphere.
(6) The Small Dimpled Sphere.
(7) The Small Smooth Sphere.
The boundary layer is the immeidate surrounding part of the object in which the
laminar and the turbulent air flowing around the object can be viewed whenever they
are undergoing any form of layer transition. Laminar flow is a streamlined air that
flows in a parallel layer, when the air is travelling at low velocity around the object,
there will not be lateral mixing of air in the flow like swirls or vortex.
Turbulent flow. In this case the turbulent air flowing are not going to be in an orderly
manner but very rough air flow with lateral mixing of vortexes which can be viewed
behind the body in which the air is travelling around. Whenever the Renolyds
number of any flow is less that 2000, it is a laminar flow and when the flow is higher
than 4000, it is a turbulent flow.
The Bernoulis equation is used in calculating the lift on an aerofoil weather tehre is a
high or a low pressure on a surface. Which is given by; NR =
𝑉𝐷𝑒
𝑛
=
𝑉𝐷
𝑉
42. 42 | P a g e
NR = RENOLDS NUMBER.
V = VELOCITY OF FLOW (m/s).
D = DIAMETER OF PIPE (m).
e = DENSITY OF WATER (kg/𝑚3
).
n = DYNAMIC VISCOCITY (kg/m.s).
V = KINEMATIC VISCOCITY (𝑚2
/s).
After all this was done, I could see that as the flow rate of air increases, a vortex is
created in which swirling air creates a heavy drag on most of the objects used due to
their shapes but lesser drags on Circular Disk and the Small Dimpled Sphere. The
higher the speed of the fan, the higher the drag and the higher the Reynolds
Number, as we can see from the data we have on the table for the experiment, each
object has a high reynolds numbers at high fan speeds.
In comparism, Small Smooth Sphere and a Small Dimpled Sphere.
In a Small Smooth Sphere, the type of air that flows around the ball is a laminar flow,
the shape and surface of the ball quickly separate air from the ball thereby producing
a vortex, the swirling air around the ball then creates a heavy drag which reduces the
rate at which the smooth small ball can travel through the air.
43. 43 | P a g e
Then in a Small Dimpled Sphere, the dimples around the ball surface helps the ball
in creating a form of turbulence air that flows around the ball. The turbulence sucks
air to the ball and separate from it at a low rate thereby producing a smaller vortex
and very less drag, so the rate at which the dimpled ball is going to travel through the
air will be higher and farther than a small smooth ball due to its dimpled surface. So
the turbulent air around the boundary layer of a small smooth sphere will be more
higher than the air we are going to get around the boundary layer of a small dimpled
ball due to their body surface and the amount of turbulent air flow they produce.
The effect of the supporting rod on the result of the model mounted was that; the
supporting rod will increase the rate of drag thereby making the air travelling around
the model mounted and the rod more turbulent. That is the more drag you get the
turbulent the air, unlike when the object is been suspended in the air, the result you
will have for the air flowing around the object is going to be a laminar flow with a
lesser drag. The rate of flow of the air around the object can be determined by
adding smoke or dye into the air flowing or by attaching a Yarn-like strand in the air
which can also be attached to the mounted model in the tunnel which will make the
flow very visible when caring out the experiment.
44. 44 | P a g e
RECOMMENDATION.
At the end of this experiment, I adviced that before the final production of any object
that will be travelling through the air,such an object needs to be tested in wind
tunnels in order to know how the object can withstand air pressure whenever is
acting on it. And more so the wind tunnel will help the person producing the object to
know where to make the necessary corrections and the best shape with the surface
to be used in designing such an object. This means that at the end of the final
production the money spent will not be wasted. Instead of studying the object or the
material which as not been tested in the wind tunnel then now trying to make the
corrections after it has been finaly produced. Wind tunnels are made for different
purposes and sizes depending on what to be tested so the cost of production have
always been the problem.
45. 45 | P a g e
EVALUATION.
A wind tunnel is a device used in aerodynamic research to study the effects of air
moving around a solid object, in order to know how such an object can withstand the
flow of air when it is moving through it and also to understand the theories of
aerodynamics, the effects of drag forces on bluff and streamlined bodies.
The wind tunnel is operated by a fan which is connected to one end of the tunnel, the
fan helps in drawing in air into the tunnel from the Bellmouth, then passes out the air
from the other end of the tunnel into room and recirculated it into the tunnel in order
to have uniform flow of air into the wind tunnel during the test section. On each of the
used as the flow rate of air increases, a vortex is created in which swirling air creates
a heavy drag on most of the objects used due to their shapes so the higher the
speed of the fan, the higher the drag and the higher the Reynolds Number. The
major effect of the supporting rod is that it will increase the rate of drag thereby
making the air travelling around the model mounted and the rod more turbulent.
After all this was done, I could see that as the flow rate of air increases, a vortex is
created in which swirling air creates a heavy drag on most of the objects used due to
their shapes but lesser drags on Circular Disk and the Small Dimpled Sphere. The
higher the speed of the fan, the higher the drag and the higher the Reynolds
Number, as we can see from the data we have on the table for the experiment, each
object has a high reynolds numbers at high fan speeds.
46. 46 | P a g e
APPENDICES.
Taken the readings of the objects mounted.
47. 47 | P a g e
Remounting another object into the tunnel.
Images of the object used.
49. 49 | P a g e
REFFERENCES.
(1) Aerospace engineering and manufacturing, march 2009. Pp 27-28 society of
Automotive engineering.
(2) Dodson, MG (2005) An Historical and Applied Aerodynamic study of the
Wright Brother’s Wind Tunnel Test program and Applications to Successful
Manned flight US Naval Academy Technical Report. USNA-334. Retrieved
2009-03-11.
(3) www.quora.com/At-what-application-turbulent.flow-regime-is-prefarable-and-
why.