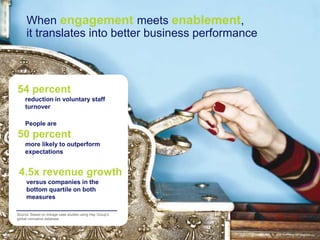
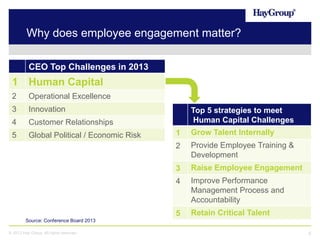
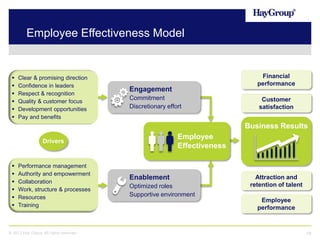
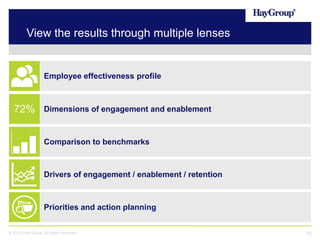
Employee Engagement Forum
Belgium - 2013
JUNE 6th, 2013

BRUSSELS

Welcome
01
Introduction
Nico Van Dam (Hay Group)
Agenda for today

15:30

Introduction
Nico Van Dam – Hay Group

15:45

Insights from Engagement@Work 2013 Research – Belgium
Nathalie Sterckx – Hay Group

16:20

Panel discussion
Translating your employee engagement survey results
into an action plan with impact
 Lucrèce Reybroeck – Corporate HR Director, Euroports
 Patrick De Deken – Site Manager Antwerp, Ineos Oxide
 Patrick Janssens – Member of Flemish Parliament
Moderator: Sonja Brouwers – Hay Group

17:10

Reception & Networking

© 2013 Hay Group. All rights reserved

3
When engagement meets enablement,
it translates into better business performance

54 percent
reduction in voluntary staff
turnover
People are

50 percent
more likely to outperform
expectations

4.5x revenue growth
versus companies in the
bottom quartile on both
measures
Source: Based on linkage case studies using Hay Group’s
global normative database

© 2013 Hay Group. All rights reserved

4
Why does employee engagement matter?
CEO Top Challenges in 2013

1

Human Capital

2

Operational Excellence

3

Innovation

4

Customer Relationships

5

Global Political / Economic Risk

Top 5 strategies to meet
Human Capital Challenges
1

Grow Talent Internally

2

Provide Employee Training &
Development

3

Raise Employee Engagement

4

Improve Performance
Management Process and
Accountability

5

Retain Critical Talent

Source: Conference Board 2013
© 2013 Hay Group. All rights reserved

5
Trend 1
Engagement
levels are
dropping
What have we done to our employees?

salary freezes & pay cuts...
salary moderation...

downsizing & company closures...

cost cutting...
more with less...
© 2013 Hay Group. All rights reserved

7
Engagement levels in Belgium are dropping ...

Belgium

Engagement
indicator
(% employees
willing to walk
the extra mile)

Intention to stay
> 5 years
(% employees)

2010*

60%

74%

2011*

55%

65%

2012-13**

53%

65%

(*) Source: Hay Group Insight Employee Opinion Databases
(**) Source: Hay Group Engagement@Work Research Belgium (n=1393)
© 2013 Hay Group. All rights reserved

8
Trend 2
Coming up...
Massive talent
shortages around
the world
Massive talent shortages around the world...
One in five of all senior executives in the Fortune 500 is eligible for retirement now
Source: Rothwell & Associates

“Engineers topped the list of job titles
experiencing talent shortage”
Source: Manpower’s ‘2011 Global Talent Shortage Survey

“As of Jan.1, the oldest of
America’s baby boom

generation started turning
65 at a rate of 10,000 a day”
Source: NY Times, 2011

China’s impending
talent shortage
? As unbelievable aswith a population of
“A labour shortage, it may seem, this is
precisely the situation China as it may
1.3 billion? As unbelievable now
confronts. is precisely the situation
seem, this
China now confronts.”
Source: Online Asia Times

Two thirds of CEOs believe they’re facing a limited supply of skilled candidates
Source: PWC Annual CEO report 2011
© 2013 Hay Group. All rights reserved

10
Trend 3
Coming up...
Global talent exodus
as economy picks up
Global talent exodus as economy picks up...
2014 will see the sharpest

Global employee turnover

increase in employee turnover

24.0%

900
Forecast

23.5%

850

23.0%

800

22.5%

750

22.0%

700

21.5%

650

21.0%

600

20.5%

550

20.0%

500
2010

2011

2012

2013

Total employees (right axis)

2014

2015

2016

2017

2018

Employee turnover rate (left axis)

Source: Hay Group & OECD & CEBR analysis, April 2013
© 2013 Hay Group. All rights reserved

12
Emerging economies to lead turnover spike
Belgium to follow in 2015
Timing and magnitude of global turnover spikes, 2012-2018
35%

Employee turnover rate

30%
Mexico

25%

India
Brazil

USA

China
Colombia

20%

Russia

Indonesia
Australia
Canada

UK

Peru

15%

Spain

Germany

France

Poland

10%

Italy

Belgium
Netherlands

5%
2012

2013

2014

2015

2016

2017

2018

2019

Year of sharpest turnover increase
Mature economies

Emerging economies

Source: Hay Group & OECD & CEBR analysis, April 2013
© 2013 Hay Group. All rights reserved

13
Employee turnover trends for Belgium

12% in 2015

2014 will see a rise in turnover
again, with the sharpest rise

2015

expected in
as economic
activity picks up (12%)

Turnover in Belgium will further
decline in 2013 to 11.1%

Source: Hay Group & OECD & CEBR analysis, April 2013
© 2013 Hay Group. All rights reserved

14
Call for action…

© 2013 Hay Group. All rights reserved

15
02
Engagement@Work 2013
Research – Belgium
Nathalie Sterckx (Hay Group)
Employee Effectiveness Model








Clear & promising direction
Confidence in leaders
Respect & recognition
Quality & customer focus
Development opportunities
Pay and benefits

Financial
performance

Engagement
Commitment
Discretionary effort

Customer
satisfaction

Business Results
Employee
Effectiveness

Drivers








Performance management
Authority and empowerment
Collaboration
Work, structure & processes
Resources
Training

© 2013 Hay Group. All rights reserved

Enablement
Optimized roles
Supportive environment

Attraction and
retention of talent
Employee
performance

18
View the results through multiple lenses

Employee effectiveness profile

72%

Dimensions of engagement and enablement

Comparison to benchmarks

Drivers of engagement / enablement / retention

Priorities and action planning
© 2013 Hay Group. All rights reserved

19
Employee Effectiveness Profile – Belgium
HIGH

LOW

EFFECTIVE

14%
Enablement

DETACHED

32%

INEFFECTIVE

FRUSTRATED

39%

15%
HIGH

Engagement

Frustrated employees will… break through
break down,
or break free
© 2013 Hay Group. All rights reserved

20
Engagement
Which dimensions score the highest?
Benchmark
Belgium versus
Europe
-1

78%

Quality and customer focus

-1

72%

Clear and promising direction

3

Resources
Respect and recognition

67%

2

Confidence in leaders

67%

3
0

Authority and empowerment
Performance management

0

Collaboration

-1

Work, structure and process

-2

52%

Development opportunities

3

Training

-1

47%

Pay and benefits
0%

10%

20%

0

30%

40%

50%

60%

70%

80%

90%

100%

% Positive

© 2013 Hay Group. All rights reserved

21
Worldwide engagement

© 2013 Hay Group. All rights reserved

22
Enablement
Which dimensions score the highest?
Benchmark
Belgium versus
Europe
-1

Quality and customer focus

-1

Clear and promising direction

68%

Resources

3

Respect and recognition

2

Confidence in leaders

3

Authority and empowerment

64%

0

Performance management

64%

0

Collaboration

55%

-1

Work, structure and process

55%

-2

Development opportunities

3

51%

Training

-1
0

Pay and benefits
0%

10%

20%

30%

40%

50%

60%

70%

80%

90%

100%

% Positive

© 2013 Hay Group. All rights reserved

23
Employee effectiveness
Which dimensions score the highest?
Benchmark
Belgium versus
Europe
-1

78%

Quality and customer focus

-1

72%

Clear and promising direction
Resources

68%

3

Respect and recognition

67%

2

Confidence in leaders

67%

3

Authority and empowerment

64%

0

Performance management

64%

0

Collaboration

55%

-1

Work, structure and process

55%

-2

Development opportunities

52%

3

Training

51%

-1

47%

Pay and benefits
0%

10%

20%

0

30%

40%

50%

60%

70%

80%

90%

100%

% Positive

© 2013 Hay Group. All rights reserved

24
What really drives engagement?

R²
1. Respect and recognition







Clear & promising direction
Confidence in leaders
Respect & recognition
Quality & customer focus
Development opportunities
Pay and benefits

0.600

2. Confidence in leaders

0.517

3. Clear and promising direction 0.488
0.477

5. Quality & customer focus

0.423

6. Pay and benefits

© 2013 Hay Group. All rights reserved

4. Development opportunities

0.399

25
What really drives enablement?

R²
1. Authority and empowerment
Performance management
Authority and empowerment
Collaboration
Work, structure & processes
Resources
Training

© 2013 Hay Group. All rights reserved

2. Work, structure & processes

0.536

3. Collaboration

0.529

4. Performance management

0.520

5. Resources

0.486

6. Training








0.551

0.377

26
What makes people stay?

Trust in company
and leadership
Environment
for success

What makes
people stay?

Authority
and influence

© 2013 Hay Group. All rights reserved

Room for
growth

A fair exchange

27
Retention – There is some work to do - Belgium

Trust in company
and leadership
Environment
for success

Room for
growth

What makes
people stay?

Authority
and influence

A fair
exchange

65%

76%

Belief firm is effectively
managed and well run

Enough authority to
effectively perform their roles

57%
37%
Concern over
direction and goals

© 2013 Hay Group. All rights reserved

49%

Concern over fairness
compensation

Unsure about achieving
career objectives

28
Summary: Key drivers of
Engagement - Enablement - Retention

Engagement

Enablement

Retention

Respect &
recognition

Authority &
empowerment

Room for
growth

Confidence in
leaders

Work,
structure &
processes

Authority &
influence

Collaboration

Perceived
fairness of
pay

Clear and
promising
direction

© 2013 Hay Group. All rights reserved

29
03
Panel discussion
Moderator: Sonja Brouwers (Hay Group)
Once questionnaires are sent in….

Create ownership amongst line managers

Set priorities and come up with a clear plan

Keep talking with your employees

© 2013 Hay Group. All rights reserved

32
Lucrèce Reybroeck
Corporate HR Director - Euroports

Patrick De Deken

Site Manager Antwerp – Ineos Oxide

Patrick Janssens
Member of Flemish Parliament
04
Conclusion
Nico Van Dam (Hay Group)
Employee Engagement Forum

Thank you

Employee Engagement Trends 2013

  • 1.
    Employee Engagement Forum Belgium- 2013 JUNE 6th, 2013 BRUSSELS Welcome
  • 2.
  • 3.
    Agenda for today 15:30 Introduction NicoVan Dam – Hay Group 15:45 Insights from Engagement@Work 2013 Research – Belgium Nathalie Sterckx – Hay Group 16:20 Panel discussion Translating your employee engagement survey results into an action plan with impact  Lucrèce Reybroeck – Corporate HR Director, Euroports  Patrick De Deken – Site Manager Antwerp, Ineos Oxide  Patrick Janssens – Member of Flemish Parliament Moderator: Sonja Brouwers – Hay Group 17:10 Reception & Networking © 2013 Hay Group. All rights reserved 3
  • 4.
    When engagement meetsenablement, it translates into better business performance 54 percent reduction in voluntary staff turnover People are 50 percent more likely to outperform expectations 4.5x revenue growth versus companies in the bottom quartile on both measures Source: Based on linkage case studies using Hay Group’s global normative database © 2013 Hay Group. All rights reserved 4
  • 5.
    Why does employeeengagement matter? CEO Top Challenges in 2013 1 Human Capital 2 Operational Excellence 3 Innovation 4 Customer Relationships 5 Global Political / Economic Risk Top 5 strategies to meet Human Capital Challenges 1 Grow Talent Internally 2 Provide Employee Training & Development 3 Raise Employee Engagement 4 Improve Performance Management Process and Accountability 5 Retain Critical Talent Source: Conference Board 2013 © 2013 Hay Group. All rights reserved 5
  • 6.
  • 7.
    What have wedone to our employees? salary freezes & pay cuts... salary moderation... downsizing & company closures... cost cutting... more with less... © 2013 Hay Group. All rights reserved 7
  • 8.
    Engagement levels inBelgium are dropping ... Belgium Engagement indicator (% employees willing to walk the extra mile) Intention to stay > 5 years (% employees) 2010* 60% 74% 2011* 55% 65% 2012-13** 53% 65% (*) Source: Hay Group Insight Employee Opinion Databases (**) Source: Hay Group Engagement@Work Research Belgium (n=1393) © 2013 Hay Group. All rights reserved 8
  • 9.
    Trend 2 Coming up... Massivetalent shortages around the world
  • 10.
    Massive talent shortagesaround the world... One in five of all senior executives in the Fortune 500 is eligible for retirement now Source: Rothwell & Associates “Engineers topped the list of job titles experiencing talent shortage” Source: Manpower’s ‘2011 Global Talent Shortage Survey “As of Jan.1, the oldest of America’s baby boom generation started turning 65 at a rate of 10,000 a day” Source: NY Times, 2011 China’s impending talent shortage ? As unbelievable aswith a population of “A labour shortage, it may seem, this is precisely the situation China as it may 1.3 billion? As unbelievable now confronts. is precisely the situation seem, this China now confronts.” Source: Online Asia Times Two thirds of CEOs believe they’re facing a limited supply of skilled candidates Source: PWC Annual CEO report 2011 © 2013 Hay Group. All rights reserved 10
  • 11.
    Trend 3 Coming up... Globaltalent exodus as economy picks up
  • 12.
    Global talent exodusas economy picks up... 2014 will see the sharpest Global employee turnover increase in employee turnover 24.0% 900 Forecast 23.5% 850 23.0% 800 22.5% 750 22.0% 700 21.5% 650 21.0% 600 20.5% 550 20.0% 500 2010 2011 2012 2013 Total employees (right axis) 2014 2015 2016 2017 2018 Employee turnover rate (left axis) Source: Hay Group & OECD & CEBR analysis, April 2013 © 2013 Hay Group. All rights reserved 12
  • 13.
    Emerging economies tolead turnover spike Belgium to follow in 2015 Timing and magnitude of global turnover spikes, 2012-2018 35% Employee turnover rate 30% Mexico 25% India Brazil USA China Colombia 20% Russia Indonesia Australia Canada UK Peru 15% Spain Germany France Poland 10% Italy Belgium Netherlands 5% 2012 2013 2014 2015 2016 2017 2018 2019 Year of sharpest turnover increase Mature economies Emerging economies Source: Hay Group & OECD & CEBR analysis, April 2013 © 2013 Hay Group. All rights reserved 13
  • 14.
    Employee turnover trendsfor Belgium 12% in 2015 2014 will see a rise in turnover again, with the sharpest rise 2015 expected in as economic activity picks up (12%) Turnover in Belgium will further decline in 2013 to 11.1% Source: Hay Group & OECD & CEBR analysis, April 2013 © 2013 Hay Group. All rights reserved 14
  • 15.
    Call for action… ©2013 Hay Group. All rights reserved 15
  • 17.
    02 Engagement@Work 2013 Research –Belgium Nathalie Sterckx (Hay Group)
  • 18.
    Employee Effectiveness Model       Clear& promising direction Confidence in leaders Respect & recognition Quality & customer focus Development opportunities Pay and benefits Financial performance Engagement Commitment Discretionary effort Customer satisfaction Business Results Employee Effectiveness Drivers       Performance management Authority and empowerment Collaboration Work, structure & processes Resources Training © 2013 Hay Group. All rights reserved Enablement Optimized roles Supportive environment Attraction and retention of talent Employee performance 18
  • 19.
    View the resultsthrough multiple lenses Employee effectiveness profile 72% Dimensions of engagement and enablement Comparison to benchmarks Drivers of engagement / enablement / retention Priorities and action planning © 2013 Hay Group. All rights reserved 19
  • 20.
    Employee Effectiveness Profile– Belgium HIGH LOW EFFECTIVE 14% Enablement DETACHED 32% INEFFECTIVE FRUSTRATED 39% 15% HIGH Engagement Frustrated employees will… break through break down, or break free © 2013 Hay Group. All rights reserved 20
  • 21.
    Engagement Which dimensions scorethe highest? Benchmark Belgium versus Europe -1 78% Quality and customer focus -1 72% Clear and promising direction 3 Resources Respect and recognition 67% 2 Confidence in leaders 67% 3 0 Authority and empowerment Performance management 0 Collaboration -1 Work, structure and process -2 52% Development opportunities 3 Training -1 47% Pay and benefits 0% 10% 20% 0 30% 40% 50% 60% 70% 80% 90% 100% % Positive © 2013 Hay Group. All rights reserved 21
  • 22.
    Worldwide engagement © 2013Hay Group. All rights reserved 22
  • 23.
    Enablement Which dimensions scorethe highest? Benchmark Belgium versus Europe -1 Quality and customer focus -1 Clear and promising direction 68% Resources 3 Respect and recognition 2 Confidence in leaders 3 Authority and empowerment 64% 0 Performance management 64% 0 Collaboration 55% -1 Work, structure and process 55% -2 Development opportunities 3 51% Training -1 0 Pay and benefits 0% 10% 20% 30% 40% 50% 60% 70% 80% 90% 100% % Positive © 2013 Hay Group. All rights reserved 23
  • 24.
    Employee effectiveness Which dimensionsscore the highest? Benchmark Belgium versus Europe -1 78% Quality and customer focus -1 72% Clear and promising direction Resources 68% 3 Respect and recognition 67% 2 Confidence in leaders 67% 3 Authority and empowerment 64% 0 Performance management 64% 0 Collaboration 55% -1 Work, structure and process 55% -2 Development opportunities 52% 3 Training 51% -1 47% Pay and benefits 0% 10% 20% 0 30% 40% 50% 60% 70% 80% 90% 100% % Positive © 2013 Hay Group. All rights reserved 24
  • 25.
    What really drivesengagement? R² 1. Respect and recognition       Clear & promising direction Confidence in leaders Respect & recognition Quality & customer focus Development opportunities Pay and benefits 0.600 2. Confidence in leaders 0.517 3. Clear and promising direction 0.488 0.477 5. Quality & customer focus 0.423 6. Pay and benefits © 2013 Hay Group. All rights reserved 4. Development opportunities 0.399 25
  • 26.
    What really drivesenablement? R² 1. Authority and empowerment Performance management Authority and empowerment Collaboration Work, structure & processes Resources Training © 2013 Hay Group. All rights reserved 2. Work, structure & processes 0.536 3. Collaboration 0.529 4. Performance management 0.520 5. Resources 0.486 6. Training       0.551 0.377 26
  • 27.
    What makes peoplestay? Trust in company and leadership Environment for success What makes people stay? Authority and influence © 2013 Hay Group. All rights reserved Room for growth A fair exchange 27
  • 28.
    Retention – Thereis some work to do - Belgium Trust in company and leadership Environment for success Room for growth What makes people stay? Authority and influence A fair exchange 65% 76% Belief firm is effectively managed and well run Enough authority to effectively perform their roles 57% 37% Concern over direction and goals © 2013 Hay Group. All rights reserved 49% Concern over fairness compensation Unsure about achieving career objectives 28
  • 29.
    Summary: Key driversof Engagement - Enablement - Retention Engagement Enablement Retention Respect & recognition Authority & empowerment Room for growth Confidence in leaders Work, structure & processes Authority & influence Collaboration Perceived fairness of pay Clear and promising direction © 2013 Hay Group. All rights reserved 29
  • 31.
  • 32.
    Once questionnaires aresent in…. Create ownership amongst line managers Set priorities and come up with a clear plan Keep talking with your employees © 2013 Hay Group. All rights reserved 32
  • 33.
    Lucrèce Reybroeck Corporate HRDirector - Euroports Patrick De Deken Site Manager Antwerp – Ineos Oxide Patrick Janssens Member of Flemish Parliament
  • 35.
  • 36.