SlideShare a Scribd company logo
E|MISSION Statement ™
EMAIL enquiries@our-
future.co.uk
ISSUE	
  7
The	
  ‘Emission	
  Statement’	
  sets	
  out	
  to	
  provide	
  a	
  view	
  of	
  the	
  application	
  and	
  potential	
  for	
  carbon	
  mitigating	
  technologies	
  
as	
  they	
  strive	
  to	
  find	
  commercial	
  value	
  propositions	
  that	
  are	
  considered	
  supportable	
  by	
  policy	
  makers,	
  treasuries	
  and	
  
tax	
  payers.	
  	
  The	
  aspiration	
  from	
  publishing	
  such	
  a	
  document	
  is	
  not	
  to	
  provide	
  an	
  oracle	
  or	
  prescriptive	
  roadmap	
  for	
  
clean	
  technology	
  development.	
  	
  Instead	
  it	
  is	
  offered	
  as	
  a	
  simple	
  pragmatic	
  framework	
  for	
  all	
  stakeholders	
  to	
  be	
  able	
  to	
  
consider	
  such	
  developments.	
  	
  Far	
  too	
  frequently	
  the	
  complexity	
  of	
  situations	
  is	
  over	
  analysed	
  to	
  the	
  extent	
  it	
  creates	
  
barriers	
  to	
  progress.	
  	
  As	
  with	
  the	
  ‘Engineering	
  of	
  Things’	
  (“EoT”)	
  though,	
  simplification	
  and	
  the	
  pursuit	
  of	
  solutions	
  can	
  
be	
  much	
  more	
  productive	
  and	
  is	
  the	
  foundation	
  with	
  which	
  the	
  ‘Emission	
  Statement’	
  is	
  presented.
Operational	
  Optimisation
Operational	
  optimisation	
  is	
  the	
  last	
  of	
  the	
  enabling	
  criteria	
  to	
  be	
  considered,	
  because	
  
by	
  default	
  its	
  predecessors	
  are	
  the	
  foundation	
  of	
  design	
  expectation;	
  but	
  that	
  doesn’t	
  
mean	
  it	
  is	
  the	
  least	
  important.	
  	
  In	
  fact	
  the	
  opposite	
  is	
  the	
  case.	
  	
  Different	
  operators	
  
can	
  yield	
  different	
  performances	
  with	
  the	
  same	
  equipment.	
  	
  Just	
  consider	
  teammates	
  
within	
  the	
  world	
  of	
  Formula	
  1	
  if	
  you	
  want	
  to	
  understand	
  that	
  point.	
  	
  It	
  is	
  only	
  through	
  
actual	
  operation	
  that	
  the	
  range	
  of	
  performance	
  and	
  associated	
  outturn	
  costs	
  can	
  be	
  
illustrated,	
  developed	
  and	
  optimised.	
  	
  Operational	
  Optimisation	
  is	
  the	
  feedback	
  loop	
  
for	
  technology	
  development,	
  which	
  must	
  be	
  managed	
  appropriately	
  and	
  with	
  greater	
  
detail	
  as	
  it	
  evolves	
  from	
  concept	
  to	
  an	
  integrated	
  commercial	
  operation.	
  The	
  below	
  
graphic	
  demonstrates	
  the	
  phasing	
  and	
  the	
  position	
  of	
  prominence	
  that	
  Operational	
  
Optimisation	
  holds	
  within	
  the	
  Emissions	
  Model.	
  	
  It	
  is	
  impossible	
  to	
  deliver	
  innovation	
  
without	
  this	
  iterative	
  validation.	
  
©	
  and	
  ™	
  GB	
  Management	
  Services	
  Ltd
GB	
  Management	
  Services	
  Ltd	
  offers	
  consultancy	
  services	
  related	
  emissions	
  reduction,	
  process	
  and	
  operations	
  
improvement,	
  and	
  the	
  development	
  clean/renewable	
  technology	
  projects.	
  
Contact	
  Details:	


  Grant	
  Budge	
  	
  	
  Mobile:	
  +44	
  (0)	
  7780	
  920504 Email:	
  	
  gbudge@our-­‐future.co.uk
Risk
Management
Application Application Application Application
Technology
Design
Integration
Market
Operational
Optimisation
Technology
Design
Integration
Market
Operational
Optimisation
Technology
Design
Integration
Market
Operational
Optimisation
Technology
Design
Integration
Market
Operational
Optimisation
Bench&Scale
(2&to&3&Years)
Pro4totype Scale
(2&to&3&Years)
Pilot&Scale
(3&to&5&Years)
Commercial&Scale
(3&to&5&years)
TRL 8 to 9TRL 4 to 5TRL 3 to 4 TRL 6 to 7
ABBREVIATION:	
  TRL	
  is	
  Technology	
  Readiness	
  Level
©	
  GB	
  Management	
  Services	
  Ltd
Contact	
  Details:	


  Grant	
  Budge	
  	
  	
  Mobile:	
  +44	
  (0)	
  7780	
  920504 Email:	
  	
  gbudge@our-­‐future.co.uk
E|MISSION Statement ™
Development	
  Cost	
  Vectors
The	
  graph	
  to	
  the	
  right	
  illustrates	
  the	
  upper	
  and	
  lower	
  
cost	
  vectors	
  for	
  each	
  of	
  the	
  technology	
  design	
  
pathways.	
  	
  While	
  this	
  has	
  been	
  referred	
  to	
  more	
  than	
  
once	
  through	
  progressive	
  Emission	
  Statement	
  issues,	
  
it	
  bears	
  restating	
  under	
  consideration	
  of	
  ‘Operational	
  
Optimisation’;	
  if	
  for	
  nothing	
  else	
  but	
  to	
  demonstrate	
  
the	
  vector	
  gradients	
  as	
  we	
  progress	
  from	
  Demand	
  
Reduction	
  through	
  to	
  Demand	
  Containment;	
  and	
  from	
  
Bench	
  to	
  Commercial	
  Scale.	
  	
  The	
  reason	
  being,	
  that	
  
any	
  errors	
  in	
  proper	
  operational	
  evaluation	
  can:	
  
• Eliminate	
  valid	
  technology	
  progression;
• Hide	
  the	
  true	
  costs	
  of	
  technology;	
  or
• Miss	
  optimisation opportunities.
What	
  we	
  are	
  seeking	
  to	
  highlight	
  here	
  is	
  that	
  the	
  only	
  
criteria	
  that	
  provides	
  a	
  sanity	
  check	
  to	
  these	
  gradients	
  
is	
  Operation	
  Optimisation.	
  	
  Get	
  it	
  right	
  and	
  you	
  will	
  
advance	
  with	
  a	
  lower	
  cost	
  gradient!	
  
All	
  good	
  narratives	
  return	
  and	
  reintroduce	
  statements	
  made	
  at	
  inception.	
  	
  The	
  Emission	
  Statement	
  is	
  no	
  different.	
  	
  In	
  
Issue	
  1	
  we	
  introduced	
  the	
  Engineering	
  of	
  Things	
  (“EoT”)	
  – a	
  basic	
  construct	
  for	
  project	
  development.	
  	
  You	
  will	
  hopefully	
  
have	
  noticed	
  that	
  through	
  each	
  criteria	
  review,	
  at	
  least	
  some	
  part	
  of	
  the	
  EoT has	
  been	
  introduced	
  for	
  assessment:
• Core	
  Process	
  Optimisation	
  is	
  a	
  central	
  skill	
  within	
  Application and	
  Technology	
  Design;
• Waste	
  Valorisation,	
  Waste	
  Energy	
  /Heat	
  Recovery	
  is	
  a	
  central	
  skill	
  within	
  Integration;	
  and
• Bi-­‐product	
  production	
  is	
  a	
  key	
  skill	
  within	
  Markets.
Operational	
  Optimisation	
  takes	
  the	
  architecture	
  of	
  the	
  EoT holistically	
  and	
  ensures	
  it	
  is	
  fit	
  for	
  purpose	
  to	
  progress	
  
forward	
  to	
  the	
  next	
  stage	
  of	
  development	
  (i.e.	
  bench	
  scale	
  up	
  to	
  commercialisation);	
  focussing	
  on	
  each	
  element	
  in	
  turn.	


Full	
  Circle
PAPS
CADS
Cost
Core%Process%
Optimisation
Waste
Valorisation
Waste%Energy%/%Heat%Recovery
Bi;Product%Production
Minimise External%Waste
Increase%Net%Energy%Efficiency
Net%Unit%Cost%of%Core%Product%Production
No	
  matter	
  what	
  industry,	
  in	
  our	
  experience,	
  plant	
  
operations	
  personnel	
  always	
  hold	
  valuable	
  insight	
  to	
  
support	
  transferring	
  theory	
  to	
  practice; and	
  their	
  
inclusion	
  in	
  system	
  development	
  is	
  essential.
When	
  entering	
  a	
  phase	
  of	
  operational	
  assessment,	
  
first	
  the	
  core	
  process	
  must	
  be	
  brought	
  to	
  a	
  point	
  that	
  
it	
  closely	
  reflects	
  predicted	
  performance.	
  	
  This	
  is	
  
ensuring	
  capacity	
  is	
  at	
  design	
  levels;	
  that	
  reaction	
  
rates	
  and	
  residence	
  times	
  meet	
  expectations;	
  that	
  
raw	
  material	
  to	
  product	
  conversion	
  rates	
  are	
  as	
  
predicted;	
  and	
  that	
  the	
  product	
  quality	
  is	
  consistent.	
  	
  
Utopia	
  is	
  when	
  for	
  a	
  known	
  feedstock,	
  the	
  
operations	
  team	
  can	
  adjust	
  accordingly	
  to	
  maximise
core	
  process	
  performance.	
  	
  Once	
  achieved,	
  
operations	
  personnel	
  can	
  begin	
  to	
  focus	
  on	
  energy	
  
integration	
  (i.e.	
  heat	
  exchangers,	
  electricity	
  
production);	
  with	
  the	
  balance	
  of	
  solid	
  and	
  gaseous	
  
wastes	
  being	
  considered	
  for	
  valorisation as	
  bi-­‐
products.	
  	
  Each	
  layer	
  of	
  optimisation progressing	
  
towards	
  demonstration	
  of	
  the	
  lowest	
  cost	
  of	
  
production	
  for	
  the	
  implemented	
  scale.
©	
  GB	
  Management	
  Services	
  Ltd
Contact	
  Details:	


  Grant	
  Budge	
  	
  	
  Mobile:	
  +44	
  (0)	
  7780	
  920504 Email:	
  	
  gbudge@our-­‐future.co.uk
E|MISSION Statement ™
The	
  easiest	
  way	
  to	
  frame	
  Operational	
  Optimisation	
  is	
  to	
  provide	
  an	
  illustration	
  of	
  all	
  potential	
  interactions	
  and	
  how	
  they	
  
can	
  ultimately	
  make	
  or	
  break	
  a	
  strong	
  solution.	
  	
  For	
  ease	
  of	
  ensuring	
  that	
  every	
  level	
  of	
  interaction	
  is	
  illustrated	
  we	
  
provide	
  a	
  generic	
  Demand	
  Containment	
  technology	
  – a	
  process	
  plant	
  that	
  requires	
  gaseous	
  direct	
  thermal	
  heating	
  for	
  
its	
  core	
  production	
  process. Under	
  this	
  scenario,	
  switching	
  to	
  hydrogen	
  as	
  a	
  source	
  of	
  energy	
  has	
  been	
  considered	
  
technically	
  feasible.	
  	
  In	
  the	
  below	
  diagram,	
  we	
  have	
  illustrated	
  the	
  primary	
  material	
  flows,	
  key	
  operational	
  nodes	
  (ie
boxes),	
  node	
  operational	
  control	
  criteria/objectives	
  and	
  the	
  background	
  colours denote	
  the	
  element	
  of	
  the	
  EoT being	
  
progressed.	
  	
  The	
  challenge	
  of	
  Operational	
  Optimisation is	
  that	
  as	
  the	
  design	
  develops	
  from	
  bench	
  to	
  commercial	
  scale,	
  
consideration	
  of	
  cause	
  and	
  effect	
  on	
  the	
  cascade	
  of	
  process	
  controls	
  becomes	
  ever	
  more	
  important.	
  	
  
Illustration	
  -­‐ Demand	
  Containment
Central(process(needs(to(ensure(
1.#Homogeneous#thermal# activation
2.#Material#fluidity#through# vessel
3.#Uniform# residence#time#
4.#Consistent# product# quality
5.#Economic# raw#material#consumption
Hydrogen(production( &(CO2 separation
1.#Consistent# conversion# efficiency
2.#Consistent# product# quality
3.#Uniform# residence#time
4.#Economic# raw#materials#consumption
NATURAL
GAS
H2
APPLICATION
PRODUCT
CO2 Gas(Cleaning
1.#Consistent# product# quality
Integrated(Power(Production
1.#Optimise energy#conversion#
efficiency
Solid( Waste(Utilisation
1.#Consistent# product# quality
2.#Maximise conversion# efficiency
Waste(Heat(
Integration
BYE
PRODUCT
SOLID
WASTE
GASEOUS(
WASTE
Residual( Waste
1.#Asses#tertiary#
product#
applications
Residual( Solid(Waste
1.#Minimise landfill
CO2 Utilisation
1.#Homogeneous#activation
2.#Material#fluidity#through# vessel
3.#Uniform# residence#time#
4.#Consistent# product# quality
5.#Economic# raw#material#consumption
Residual( Gaseous(
Waste(Emitted
BYE
PRODUCT
Residual( CO2
Stored
ByEProduct
The	
  challenge	
  for	
  2050	
  emissions	
  reductions	
  is	
  the	
  evolution	
  of	
  such	
  process	
  flows	
  and	
  Operational	
  Optimisation	
  
experience	
  to	
  allow	
  lowest	
  cost	
  delivery	
  of	
  the	
  required	
  low	
  carbon	
  world.	
  	
  While	
  the	
  above	
  illustration	
  makes	
  this	
  
progression	
  appear	
  complex,	
  we	
  would	
  remind	
  you	
  of	
  the	
  Application	
  and	
  Technology	
  Plan	
  profiled	
  in	
  Issue	
  4;	
  which	
  was	
  
founded	
  on	
  logical	
  combined	
  benefits,	
  accepted	
  technology	
  merits	
  and	
  with	
  a	
  forward	
  view	
  on	
  least	
  risk	
  pathway	
  for	
  
Operational	
  Optimisation.	
  	
  It	
  doesn’t	
  need	
  to	
  be	
  Complex.	


There	
  is	
  so	
  much	
  more	
  that	
  could	
  be	
  analysed and	
  profiled	
  within	
  the	
  various	
  scenarios	
  for	
  Operational	
  Optimisation of	
  
low	
  carbon	
  energy,	
  but	
  for	
  simplicity,	
  we	
  feel	
  the	
  above	
  is	
  sufficient	
  to	
  identify	
  the	
  criterias importance.	
  	
  In	
  Issues	
  8	
  and	
  9,	
  
we	
  will	
  take	
  all	
  we	
  have	
  presented	
  and	
  profile	
  the	
  associated	
  value	
  and	
  risks.	
  
Closing	
  Statement

More Related Content

Similar to Emission Statment - Issue 7 - Operational Optimisation

Emission Statement - Issue 2 - Application
Emission Statement - Issue 2 - ApplicationEmission Statement - Issue 2 - Application
Emission Statement - Issue 2 - Application
Grant Budge
 
Emission Statement - Technology Design - Issue 3
Emission Statement - Technology Design -  Issue 3Emission Statement - Technology Design -  Issue 3
Emission Statement - Technology Design - Issue 3
Grant Budge
 
Emission Statement - Issue 6 - Markets
Emission Statement - Issue 6 - MarketsEmission Statement - Issue 6 - Markets
Emission Statement - Issue 6 - Markets
Grant Budge
 
EnVogue July'14 Edition #EnergyEfficiency #EETPL #India
EnVogue July'14 Edition #EnergyEfficiency #EETPL #IndiaEnVogue July'14 Edition #EnergyEfficiency #EETPL #India
EnVogue July'14 Edition #EnergyEfficiency #EETPL #India
Umesh Bhutoria
 
Roland berger managing-the-it-cost-challenge_20090522
Roland berger managing-the-it-cost-challenge_20090522Roland berger managing-the-it-cost-challenge_20090522
Roland berger managing-the-it-cost-challenge_20090522Karthik Arumugham
 
10 Key Action to Reduce IT Infrastructure and Operation Cost Stucture
10 Key Action to Reduce IT Infrastructure and Operation Cost Stucture10 Key Action to Reduce IT Infrastructure and Operation Cost Stucture
10 Key Action to Reduce IT Infrastructure and Operation Cost Stucture
Icomm Technologies
 
Operational improvement projects management
Operational improvement projects managementOperational improvement projects management
Operational improvement projects management
Tito Livio M. Cardoso
 
Energy auditor training level 1 (2001)
Energy auditor training level 1 (2001)Energy auditor training level 1 (2001)
Energy auditor training level 1 (2001)
Colin Koh (許国仁)
 
PAR-MKT21701-008 [Oil’s wild ride -IT as strategic advantage] RGB mail
PAR-MKT21701-008 [Oil’s wild ride -IT as strategic advantage] RGB mailPAR-MKT21701-008 [Oil’s wild ride -IT as strategic advantage] RGB mail
PAR-MKT21701-008 [Oil’s wild ride -IT as strategic advantage] RGB mailMatthew Hilliker
 
Agile Network India | T Shirt Sizing Model for DevOps COE | Bharti Goyal Maan
Agile Network India | T Shirt Sizing Model for DevOps COE | Bharti Goyal MaanAgile Network India | T Shirt Sizing Model for DevOps COE | Bharti Goyal Maan
Agile Network India | T Shirt Sizing Model for DevOps COE | Bharti Goyal Maan
AgileNetwork
 
Friost & Sullivan - Eltek (dc power systems) award write up
Friost & Sullivan  - Eltek (dc power systems) award write upFriost & Sullivan  - Eltek (dc power systems) award write up
Friost & Sullivan - Eltek (dc power systems) award write up
Eltek
 
BT Monitor Benchmark 2013
BT Monitor Benchmark 2013BT Monitor Benchmark 2013
BT Monitor Benchmark 2013
Ilmari Nyström
 
Overall Equipment Effectiveness in Construction Equipments
Overall Equipment Effectiveness in Construction EquipmentsOverall Equipment Effectiveness in Construction Equipments
Overall Equipment Effectiveness in Construction Equipments
IRJET Journal
 
Public Power Forward: IT's Role in the Changing Electric Utility
Public Power Forward:  IT's Role in the Changing Electric UtilityPublic Power Forward:  IT's Role in the Changing Electric Utility
Public Power Forward: IT's Role in the Changing Electric Utility
Kent Landrum
 
GE Smart Energy Case Competition - 2013 MIT Sloan Submission
GE Smart Energy Case Competition - 2013 MIT Sloan SubmissionGE Smart Energy Case Competition - 2013 MIT Sloan Submission
GE Smart Energy Case Competition - 2013 MIT Sloan Submission
Alexander Boutelle
 
Tmgt 8103 module 8 ver 3.0
Tmgt 8103 module 8   ver 3.0Tmgt 8103 module 8   ver 3.0
Tmgt 8103 module 8 ver 3.0
INBPInc
 
General Presentation GI Dynamics
General Presentation  GI DynamicsGeneral Presentation  GI Dynamics
General Presentation GI Dynamics
wvdzande
 
ERP Optimization: How to Save Cost And Gear Up For Business Innovation Simult...
ERP Optimization: How to Save Cost And Gear Up For Business Innovation Simult...ERP Optimization: How to Save Cost And Gear Up For Business Innovation Simult...
ERP Optimization: How to Save Cost And Gear Up For Business Innovation Simult...
CAST
 
Is the ROI of Multi-Technology as Good as Desktop Analysis Suggests?
Is the ROI of Multi-Technology as Good as Desktop Analysis Suggests?Is the ROI of Multi-Technology as Good as Desktop Analysis Suggests?
Is the ROI of Multi-Technology as Good as Desktop Analysis Suggests?
EMEX
 

Similar to Emission Statment - Issue 7 - Operational Optimisation (20)

Emission Statement - Issue 2 - Application
Emission Statement - Issue 2 - ApplicationEmission Statement - Issue 2 - Application
Emission Statement - Issue 2 - Application
 
Emission Statement - Technology Design - Issue 3
Emission Statement - Technology Design -  Issue 3Emission Statement - Technology Design -  Issue 3
Emission Statement - Technology Design - Issue 3
 
Emission Statement - Issue 6 - Markets
Emission Statement - Issue 6 - MarketsEmission Statement - Issue 6 - Markets
Emission Statement - Issue 6 - Markets
 
EnVogue July'14 Edition #EnergyEfficiency #EETPL #India
EnVogue July'14 Edition #EnergyEfficiency #EETPL #IndiaEnVogue July'14 Edition #EnergyEfficiency #EETPL #India
EnVogue July'14 Edition #EnergyEfficiency #EETPL #India
 
Roland berger managing-the-it-cost-challenge_20090522
Roland berger managing-the-it-cost-challenge_20090522Roland berger managing-the-it-cost-challenge_20090522
Roland berger managing-the-it-cost-challenge_20090522
 
10 Key Action to Reduce IT Infrastructure and Operation Cost Stucture
10 Key Action to Reduce IT Infrastructure and Operation Cost Stucture10 Key Action to Reduce IT Infrastructure and Operation Cost Stucture
10 Key Action to Reduce IT Infrastructure and Operation Cost Stucture
 
OGFJ Article
OGFJ ArticleOGFJ Article
OGFJ Article
 
Operational improvement projects management
Operational improvement projects managementOperational improvement projects management
Operational improvement projects management
 
Energy auditor training level 1 (2001)
Energy auditor training level 1 (2001)Energy auditor training level 1 (2001)
Energy auditor training level 1 (2001)
 
PAR-MKT21701-008 [Oil’s wild ride -IT as strategic advantage] RGB mail
PAR-MKT21701-008 [Oil’s wild ride -IT as strategic advantage] RGB mailPAR-MKT21701-008 [Oil’s wild ride -IT as strategic advantage] RGB mail
PAR-MKT21701-008 [Oil’s wild ride -IT as strategic advantage] RGB mail
 
Agile Network India | T Shirt Sizing Model for DevOps COE | Bharti Goyal Maan
Agile Network India | T Shirt Sizing Model for DevOps COE | Bharti Goyal MaanAgile Network India | T Shirt Sizing Model for DevOps COE | Bharti Goyal Maan
Agile Network India | T Shirt Sizing Model for DevOps COE | Bharti Goyal Maan
 
Friost & Sullivan - Eltek (dc power systems) award write up
Friost & Sullivan  - Eltek (dc power systems) award write upFriost & Sullivan  - Eltek (dc power systems) award write up
Friost & Sullivan - Eltek (dc power systems) award write up
 
BT Monitor Benchmark 2013
BT Monitor Benchmark 2013BT Monitor Benchmark 2013
BT Monitor Benchmark 2013
 
Overall Equipment Effectiveness in Construction Equipments
Overall Equipment Effectiveness in Construction EquipmentsOverall Equipment Effectiveness in Construction Equipments
Overall Equipment Effectiveness in Construction Equipments
 
Public Power Forward: IT's Role in the Changing Electric Utility
Public Power Forward:  IT's Role in the Changing Electric UtilityPublic Power Forward:  IT's Role in the Changing Electric Utility
Public Power Forward: IT's Role in the Changing Electric Utility
 
GE Smart Energy Case Competition - 2013 MIT Sloan Submission
GE Smart Energy Case Competition - 2013 MIT Sloan SubmissionGE Smart Energy Case Competition - 2013 MIT Sloan Submission
GE Smart Energy Case Competition - 2013 MIT Sloan Submission
 
Tmgt 8103 module 8 ver 3.0
Tmgt 8103 module 8   ver 3.0Tmgt 8103 module 8   ver 3.0
Tmgt 8103 module 8 ver 3.0
 
General Presentation GI Dynamics
General Presentation  GI DynamicsGeneral Presentation  GI Dynamics
General Presentation GI Dynamics
 
ERP Optimization: How to Save Cost And Gear Up For Business Innovation Simult...
ERP Optimization: How to Save Cost And Gear Up For Business Innovation Simult...ERP Optimization: How to Save Cost And Gear Up For Business Innovation Simult...
ERP Optimization: How to Save Cost And Gear Up For Business Innovation Simult...
 
Is the ROI of Multi-Technology as Good as Desktop Analysis Suggests?
Is the ROI of Multi-Technology as Good as Desktop Analysis Suggests?Is the ROI of Multi-Technology as Good as Desktop Analysis Suggests?
Is the ROI of Multi-Technology as Good as Desktop Analysis Suggests?
 

Recently uploaded

UNDERSTANDING WHAT GREEN WASHING IS!.pdf
UNDERSTANDING WHAT GREEN WASHING IS!.pdfUNDERSTANDING WHAT GREEN WASHING IS!.pdf
UNDERSTANDING WHAT GREEN WASHING IS!.pdf
JulietMogola
 
"Understanding the Carbon Cycle: Processes, Human Impacts, and Strategies for...
"Understanding the Carbon Cycle: Processes, Human Impacts, and Strategies for..."Understanding the Carbon Cycle: Processes, Human Impacts, and Strategies for...
"Understanding the Carbon Cycle: Processes, Human Impacts, and Strategies for...
MMariSelvam4
 
AGRICULTURE Hydrophonic FERTILISER PPT.pptx
AGRICULTURE Hydrophonic FERTILISER PPT.pptxAGRICULTURE Hydrophonic FERTILISER PPT.pptx
AGRICULTURE Hydrophonic FERTILISER PPT.pptx
BanitaDsouza
 
Natural farming @ Dr. Siddhartha S. Jena.pptx
Natural farming @ Dr. Siddhartha S. Jena.pptxNatural farming @ Dr. Siddhartha S. Jena.pptx
Natural farming @ Dr. Siddhartha S. Jena.pptx
sidjena70
 
alhambra case study Islamic gardens part-2.pptx
alhambra case study Islamic gardens part-2.pptxalhambra case study Islamic gardens part-2.pptx
alhambra case study Islamic gardens part-2.pptx
CECOS University Peshawar, Pakistan
 
Presentación Giulio Quaggiotto-Diálogo improbable .pptx.pdf
Presentación Giulio Quaggiotto-Diálogo improbable .pptx.pdfPresentación Giulio Quaggiotto-Diálogo improbable .pptx.pdf
Presentación Giulio Quaggiotto-Diálogo improbable .pptx.pdf
Innovation and Technology for Development Centre
 
Alert-driven Community-based Forest monitoring: A case of the Peruvian Amazon
Alert-driven Community-based Forest monitoring: A case of the Peruvian AmazonAlert-driven Community-based Forest monitoring: A case of the Peruvian Amazon
Alert-driven Community-based Forest monitoring: A case of the Peruvian Amazon
CIFOR-ICRAF
 
Artificial Reefs by Kuddle Life Foundation - May 2024
Artificial Reefs by Kuddle Life Foundation - May 2024Artificial Reefs by Kuddle Life Foundation - May 2024
Artificial Reefs by Kuddle Life Foundation - May 2024
punit537210
 
Environmental Science Book By Dr. Y.K. Singh
Environmental Science Book By Dr. Y.K. SinghEnvironmental Science Book By Dr. Y.K. Singh
Environmental Science Book By Dr. Y.K. Singh
AhmadKhan917612
 
一比一原版(UMTC毕业证书)明尼苏达大学双城分校毕业证如何办理
一比一原版(UMTC毕业证书)明尼苏达大学双城分校毕业证如何办理一比一原版(UMTC毕业证书)明尼苏达大学双城分校毕业证如何办理
一比一原版(UMTC毕业证书)明尼苏达大学双城分校毕业证如何办理
zm9ajxup
 
ppt on beauty of the nature by Palak.pptx
ppt on  beauty of the nature by Palak.pptxppt on  beauty of the nature by Palak.pptx
ppt on beauty of the nature by Palak.pptx
RaniJaiswal16
 
Q&A with the Experts: The Food Service Playbook
Q&A with the Experts: The Food Service PlaybookQ&A with the Experts: The Food Service Playbook
Q&A with the Experts: The Food Service Playbook
World Resources Institute (WRI)
 
growbilliontrees.com-Trees for Granddaughter (1).pdf
growbilliontrees.com-Trees for Granddaughter (1).pdfgrowbilliontrees.com-Trees for Granddaughter (1).pdf
growbilliontrees.com-Trees for Granddaughter (1).pdf
yadavakashagra
 
Characterization and the Kinetics of drying at the drying oven and with micro...
Characterization and the Kinetics of drying at the drying oven and with micro...Characterization and the Kinetics of drying at the drying oven and with micro...
Characterization and the Kinetics of drying at the drying oven and with micro...
Open Access Research Paper
 
Sustainable Rain water harvesting in india.ppt
Sustainable Rain water harvesting in india.pptSustainable Rain water harvesting in india.ppt
Sustainable Rain water harvesting in india.ppt
chaitaliambole
 
How about Huawei mobile phone-www.cfye-commerce.shop
How about Huawei mobile phone-www.cfye-commerce.shopHow about Huawei mobile phone-www.cfye-commerce.shop
How about Huawei mobile phone-www.cfye-commerce.shop
laozhuseo02
 
International+e-Commerce+Platform-www.cfye-commerce.shop
International+e-Commerce+Platform-www.cfye-commerce.shopInternational+e-Commerce+Platform-www.cfye-commerce.shop
International+e-Commerce+Platform-www.cfye-commerce.shop
laozhuseo02
 
Daan Park Hydrangea flower season I like it
Daan Park Hydrangea flower season I like itDaan Park Hydrangea flower season I like it
Daan Park Hydrangea flower season I like it
a0966109726
 
DRAFT NRW Recreation Strategy - People and Nature thriving together
DRAFT NRW Recreation Strategy - People and Nature thriving togetherDRAFT NRW Recreation Strategy - People and Nature thriving together
DRAFT NRW Recreation Strategy - People and Nature thriving together
Robin Grant
 
NRW Board Paper - DRAFT NRW Recreation Strategy
NRW Board Paper - DRAFT NRW Recreation StrategyNRW Board Paper - DRAFT NRW Recreation Strategy
NRW Board Paper - DRAFT NRW Recreation Strategy
Robin Grant
 

Recently uploaded (20)

UNDERSTANDING WHAT GREEN WASHING IS!.pdf
UNDERSTANDING WHAT GREEN WASHING IS!.pdfUNDERSTANDING WHAT GREEN WASHING IS!.pdf
UNDERSTANDING WHAT GREEN WASHING IS!.pdf
 
"Understanding the Carbon Cycle: Processes, Human Impacts, and Strategies for...
"Understanding the Carbon Cycle: Processes, Human Impacts, and Strategies for..."Understanding the Carbon Cycle: Processes, Human Impacts, and Strategies for...
"Understanding the Carbon Cycle: Processes, Human Impacts, and Strategies for...
 
AGRICULTURE Hydrophonic FERTILISER PPT.pptx
AGRICULTURE Hydrophonic FERTILISER PPT.pptxAGRICULTURE Hydrophonic FERTILISER PPT.pptx
AGRICULTURE Hydrophonic FERTILISER PPT.pptx
 
Natural farming @ Dr. Siddhartha S. Jena.pptx
Natural farming @ Dr. Siddhartha S. Jena.pptxNatural farming @ Dr. Siddhartha S. Jena.pptx
Natural farming @ Dr. Siddhartha S. Jena.pptx
 
alhambra case study Islamic gardens part-2.pptx
alhambra case study Islamic gardens part-2.pptxalhambra case study Islamic gardens part-2.pptx
alhambra case study Islamic gardens part-2.pptx
 
Presentación Giulio Quaggiotto-Diálogo improbable .pptx.pdf
Presentación Giulio Quaggiotto-Diálogo improbable .pptx.pdfPresentación Giulio Quaggiotto-Diálogo improbable .pptx.pdf
Presentación Giulio Quaggiotto-Diálogo improbable .pptx.pdf
 
Alert-driven Community-based Forest monitoring: A case of the Peruvian Amazon
Alert-driven Community-based Forest monitoring: A case of the Peruvian AmazonAlert-driven Community-based Forest monitoring: A case of the Peruvian Amazon
Alert-driven Community-based Forest monitoring: A case of the Peruvian Amazon
 
Artificial Reefs by Kuddle Life Foundation - May 2024
Artificial Reefs by Kuddle Life Foundation - May 2024Artificial Reefs by Kuddle Life Foundation - May 2024
Artificial Reefs by Kuddle Life Foundation - May 2024
 
Environmental Science Book By Dr. Y.K. Singh
Environmental Science Book By Dr. Y.K. SinghEnvironmental Science Book By Dr. Y.K. Singh
Environmental Science Book By Dr. Y.K. Singh
 
一比一原版(UMTC毕业证书)明尼苏达大学双城分校毕业证如何办理
一比一原版(UMTC毕业证书)明尼苏达大学双城分校毕业证如何办理一比一原版(UMTC毕业证书)明尼苏达大学双城分校毕业证如何办理
一比一原版(UMTC毕业证书)明尼苏达大学双城分校毕业证如何办理
 
ppt on beauty of the nature by Palak.pptx
ppt on  beauty of the nature by Palak.pptxppt on  beauty of the nature by Palak.pptx
ppt on beauty of the nature by Palak.pptx
 
Q&A with the Experts: The Food Service Playbook
Q&A with the Experts: The Food Service PlaybookQ&A with the Experts: The Food Service Playbook
Q&A with the Experts: The Food Service Playbook
 
growbilliontrees.com-Trees for Granddaughter (1).pdf
growbilliontrees.com-Trees for Granddaughter (1).pdfgrowbilliontrees.com-Trees for Granddaughter (1).pdf
growbilliontrees.com-Trees for Granddaughter (1).pdf
 
Characterization and the Kinetics of drying at the drying oven and with micro...
Characterization and the Kinetics of drying at the drying oven and with micro...Characterization and the Kinetics of drying at the drying oven and with micro...
Characterization and the Kinetics of drying at the drying oven and with micro...
 
Sustainable Rain water harvesting in india.ppt
Sustainable Rain water harvesting in india.pptSustainable Rain water harvesting in india.ppt
Sustainable Rain water harvesting in india.ppt
 
How about Huawei mobile phone-www.cfye-commerce.shop
How about Huawei mobile phone-www.cfye-commerce.shopHow about Huawei mobile phone-www.cfye-commerce.shop
How about Huawei mobile phone-www.cfye-commerce.shop
 
International+e-Commerce+Platform-www.cfye-commerce.shop
International+e-Commerce+Platform-www.cfye-commerce.shopInternational+e-Commerce+Platform-www.cfye-commerce.shop
International+e-Commerce+Platform-www.cfye-commerce.shop
 
Daan Park Hydrangea flower season I like it
Daan Park Hydrangea flower season I like itDaan Park Hydrangea flower season I like it
Daan Park Hydrangea flower season I like it
 
DRAFT NRW Recreation Strategy - People and Nature thriving together
DRAFT NRW Recreation Strategy - People and Nature thriving togetherDRAFT NRW Recreation Strategy - People and Nature thriving together
DRAFT NRW Recreation Strategy - People and Nature thriving together
 
NRW Board Paper - DRAFT NRW Recreation Strategy
NRW Board Paper - DRAFT NRW Recreation StrategyNRW Board Paper - DRAFT NRW Recreation Strategy
NRW Board Paper - DRAFT NRW Recreation Strategy
 

Emission Statment - Issue 7 - Operational Optimisation

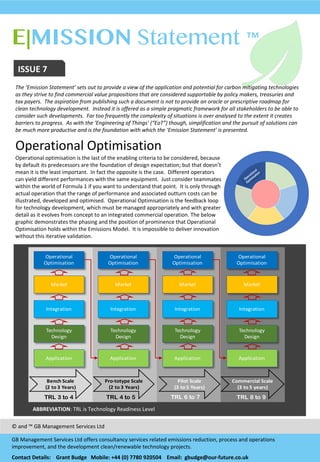
  • 1. E|MISSION Statement ™ EMAIL enquiries@our- future.co.uk ISSUE  7 The  ‘Emission  Statement’  sets  out  to  provide  a  view  of  the  application  and  potential  for  carbon  mitigating  technologies   as  they  strive  to  find  commercial  value  propositions  that  are  considered  supportable  by  policy  makers,  treasuries  and   tax  payers.    The  aspiration  from  publishing  such  a  document  is  not  to  provide  an  oracle  or  prescriptive  roadmap  for   clean  technology  development.    Instead  it  is  offered  as  a  simple  pragmatic  framework  for  all  stakeholders  to  be  able  to   consider  such  developments.    Far  too  frequently  the  complexity  of  situations  is  over  analysed  to  the  extent  it  creates   barriers  to  progress.    As  with  the  ‘Engineering  of  Things’  (“EoT”)  though,  simplification  and  the  pursuit  of  solutions  can   be  much  more  productive  and  is  the  foundation  with  which  the  ‘Emission  Statement’  is  presented. Operational  Optimisation Operational  optimisation  is  the  last  of  the  enabling  criteria  to  be  considered,  because   by  default  its  predecessors  are  the  foundation  of  design  expectation;  but  that  doesn’t   mean  it  is  the  least  important.    In  fact  the  opposite  is  the  case.    Different  operators   can  yield  different  performances  with  the  same  equipment.    Just  consider  teammates   within  the  world  of  Formula  1  if  you  want  to  understand  that  point.    It  is  only  through   actual  operation  that  the  range  of  performance  and  associated  outturn  costs  can  be   illustrated,  developed  and  optimised.    Operational  Optimisation  is  the  feedback  loop   for  technology  development,  which  must  be  managed  appropriately  and  with  greater   detail  as  it  evolves  from  concept  to  an  integrated  commercial  operation.  The  below   graphic  demonstrates  the  phasing  and  the  position  of  prominence  that  Operational   Optimisation  holds  within  the  Emissions  Model.    It  is  impossible  to  deliver  innovation   without  this  iterative  validation.   ©  and  ™  GB  Management  Services  Ltd GB  Management  Services  Ltd  offers  consultancy  services  related  emissions  reduction,  process  and  operations   improvement,  and  the  development  clean/renewable  technology  projects.   Contact  Details:        Grant  Budge      Mobile:  +44  (0)  7780  920504 Email:    gbudge@our-­‐future.co.uk Risk Management Application Application Application Application Technology Design Integration Market Operational Optimisation Technology Design Integration Market Operational Optimisation Technology Design Integration Market Operational Optimisation Technology Design Integration Market Operational Optimisation Bench&Scale (2&to&3&Years) Pro4totype Scale (2&to&3&Years) Pilot&Scale (3&to&5&Years) Commercial&Scale (3&to&5&years) TRL 8 to 9TRL 4 to 5TRL 3 to 4 TRL 6 to 7 ABBREVIATION:  TRL  is  Technology  Readiness  Level
  • 2. ©  GB  Management  Services  Ltd Contact  Details:        Grant  Budge      Mobile:  +44  (0)  7780  920504 Email:    gbudge@our-­‐future.co.uk E|MISSION Statement ™ Development  Cost  Vectors The  graph  to  the  right  illustrates  the  upper  and  lower   cost  vectors  for  each  of  the  technology  design   pathways.    While  this  has  been  referred  to  more  than   once  through  progressive  Emission  Statement  issues,   it  bears  restating  under  consideration  of  ‘Operational   Optimisation’;  if  for  nothing  else  but  to  demonstrate   the  vector  gradients  as  we  progress  from  Demand   Reduction  through  to  Demand  Containment;  and  from   Bench  to  Commercial  Scale.    The  reason  being,  that   any  errors  in  proper  operational  evaluation  can:   • Eliminate  valid  technology  progression; • Hide  the  true  costs  of  technology;  or • Miss  optimisation opportunities. What  we  are  seeking  to  highlight  here  is  that  the  only   criteria  that  provides  a  sanity  check  to  these  gradients   is  Operation  Optimisation.    Get  it  right  and  you  will   advance  with  a  lower  cost  gradient!   All  good  narratives  return  and  reintroduce  statements  made  at  inception.    The  Emission  Statement  is  no  different.    In   Issue  1  we  introduced  the  Engineering  of  Things  (“EoT”)  – a  basic  construct  for  project  development.    You  will  hopefully   have  noticed  that  through  each  criteria  review,  at  least  some  part  of  the  EoT has  been  introduced  for  assessment: • Core  Process  Optimisation  is  a  central  skill  within  Application and  Technology  Design; • Waste  Valorisation,  Waste  Energy  /Heat  Recovery  is  a  central  skill  within  Integration;  and • Bi-­‐product  production  is  a  key  skill  within  Markets. Operational  Optimisation  takes  the  architecture  of  the  EoT holistically  and  ensures  it  is  fit  for  purpose  to  progress   forward  to  the  next  stage  of  development  (i.e.  bench  scale  up  to  commercialisation);  focussing  on  each  element  in  turn.       Full  Circle PAPS CADS Cost Core%Process% Optimisation Waste Valorisation Waste%Energy%/%Heat%Recovery Bi;Product%Production Minimise External%Waste Increase%Net%Energy%Efficiency Net%Unit%Cost%of%Core%Product%Production No  matter  what  industry,  in  our  experience,  plant   operations  personnel  always  hold  valuable  insight  to   support  transferring  theory  to  practice; and  their   inclusion  in  system  development  is  essential. When  entering  a  phase  of  operational  assessment,   first  the  core  process  must  be  brought  to  a  point  that   it  closely  reflects  predicted  performance.    This  is   ensuring  capacity  is  at  design  levels;  that  reaction   rates  and  residence  times  meet  expectations;  that   raw  material  to  product  conversion  rates  are  as   predicted;  and  that  the  product  quality  is  consistent.     Utopia  is  when  for  a  known  feedstock,  the   operations  team  can  adjust  accordingly  to  maximise core  process  performance.    Once  achieved,   operations  personnel  can  begin  to  focus  on  energy   integration  (i.e.  heat  exchangers,  electricity   production);  with  the  balance  of  solid  and  gaseous   wastes  being  considered  for  valorisation as  bi-­‐ products.    Each  layer  of  optimisation progressing   towards  demonstration  of  the  lowest  cost  of   production  for  the  implemented  scale.
  • 3. ©  GB  Management  Services  Ltd Contact  Details:        Grant  Budge      Mobile:  +44  (0)  7780  920504 Email:    gbudge@our-­‐future.co.uk E|MISSION Statement ™ The  easiest  way  to  frame  Operational  Optimisation  is  to  provide  an  illustration  of  all  potential  interactions  and  how  they   can  ultimately  make  or  break  a  strong  solution.    For  ease  of  ensuring  that  every  level  of  interaction  is  illustrated  we   provide  a  generic  Demand  Containment  technology  – a  process  plant  that  requires  gaseous  direct  thermal  heating  for   its  core  production  process. Under  this  scenario,  switching  to  hydrogen  as  a  source  of  energy  has  been  considered   technically  feasible.    In  the  below  diagram,  we  have  illustrated  the  primary  material  flows,  key  operational  nodes  (ie boxes),  node  operational  control  criteria/objectives  and  the  background  colours denote  the  element  of  the  EoT being   progressed.    The  challenge  of  Operational  Optimisation is  that  as  the  design  develops  from  bench  to  commercial  scale,   consideration  of  cause  and  effect  on  the  cascade  of  process  controls  becomes  ever  more  important.     Illustration  -­‐ Demand  Containment Central(process(needs(to(ensure( 1.#Homogeneous#thermal# activation 2.#Material#fluidity#through# vessel 3.#Uniform# residence#time# 4.#Consistent# product# quality 5.#Economic# raw#material#consumption Hydrogen(production( &(CO2 separation 1.#Consistent# conversion# efficiency 2.#Consistent# product# quality 3.#Uniform# residence#time 4.#Economic# raw#materials#consumption NATURAL GAS H2 APPLICATION PRODUCT CO2 Gas(Cleaning 1.#Consistent# product# quality Integrated(Power(Production 1.#Optimise energy#conversion# efficiency Solid( Waste(Utilisation 1.#Consistent# product# quality 2.#Maximise conversion# efficiency Waste(Heat( Integration BYE PRODUCT SOLID WASTE GASEOUS( WASTE Residual( Waste 1.#Asses#tertiary# product# applications Residual( Solid(Waste 1.#Minimise landfill CO2 Utilisation 1.#Homogeneous#activation 2.#Material#fluidity#through# vessel 3.#Uniform# residence#time# 4.#Consistent# product# quality 5.#Economic# raw#material#consumption Residual( Gaseous( Waste(Emitted BYE PRODUCT Residual( CO2 Stored ByEProduct The  challenge  for  2050  emissions  reductions  is  the  evolution  of  such  process  flows  and  Operational  Optimisation   experience  to  allow  lowest  cost  delivery  of  the  required  low  carbon  world.    While  the  above  illustration  makes  this   progression  appear  complex,  we  would  remind  you  of  the  Application  and  Technology  Plan  profiled  in  Issue  4;  which  was   founded  on  logical  combined  benefits,  accepted  technology  merits  and  with  a  forward  view  on  least  risk  pathway  for   Operational  Optimisation.    It  doesn’t  need  to  be  Complex.       There  is  so  much  more  that  could  be  analysed and  profiled  within  the  various  scenarios  for  Operational  Optimisation of   low  carbon  energy,  but  for  simplicity,  we  feel  the  above  is  sufficient  to  identify  the  criterias importance.    In  Issues  8  and  9,   we  will  take  all  we  have  presented  and  profile  the  associated  value  and  risks.   Closing  Statement