SlideShare a Scribd company logo
1 of 6
Download to read offline
E|MISSION Statement ™
EMAIL enquiries@our-
future.co.uk
ISSUE	
  6
The	
  ‘Emission	
  Statement’	
  sets	
  out	
  to	
  provide	
  a	
  view	
  of	
  the	
  application	
  and	
  potential	
  for	
  carbon	
  mitigating	
  technologies	
  
as	
  they	
  strive	
  to	
  find	
  commercial	
  value	
  propositions	
  that	
  are	
  considered	
  supportable	
  by	
  policy	
  makers,	
  treasuries	
  and	
  
tax	
  payers.	
  	
  The	
  aspiration	
  from	
  publishing	
  such	
  a	
  document	
  is	
  not	
  to	
  provide	
  an	
  oracle	
  or	
  prescriptive	
  roadmap	
  for	
  
clean	
  technology	
  development.	
  	
  Instead	
  it	
  is	
  offered	
  as	
  a	
  simple	
  pragmatic	
  framework	
  for	
  all	
  stakeholders	
  to	
  be	
  able	
  to	
  
consider	
  such	
  developments.	
  	
  Far	
  too	
  frequently	
  the	
  complexity	
  of	
  situations	
  is	
  over	
  analysed	
  to	
  the	
  extent	
  it	
  creates	
  
barriers	
  to	
  progress.	
  	
  As	
  with	
  the	
  ‘Engineering	
  of	
  Things’	
  (“EoT”)	
  though,	
  simplification	
  and	
  the	
  pursuit	
  of	
  solutions	
  can	
  
be	
  much	
  more	
  productive	
  and	
  is	
  the	
  foundation	
  with	
  which	
  the	
  ‘Emission	
  Statement’	
  is	
  presented.
Markets
This	
  Issue	
  will	
  focus	
  on	
  market	
  construct	
  and	
  dynamics	
  for	
  the	
  different	
  emissions	
  
reduction	
  pathways.	
  	
  It	
  is	
  not	
  designed	
  as	
  a	
  pure	
  4	
  P’s	
  (Product,	
  Price,	
  Promotion,	
  
Position)	
  or	
  five	
  forces	
  analysis,	
  because	
  such	
  analyses	
  are	
  really	
  designed	
  for	
  competitive	
  
marketplaces.	
  	
  For	
  infant	
  subsidised	
  markets	
  we	
  need	
  a	
  more	
  creative	
  and	
  prophetic	
  
approach	
  to	
  consider	
  how	
  they	
  can	
  work.	
  	
  So	
  instead,	
  we	
  will	
  undertake	
  a	
  robust	
  high	
  
level	
  analysis	
  of	
  the	
  market	
  characteristics	
  of	
  each	
  emissions	
  reduction	
  pathway.	
  	
  To	
  
achieve	
  this,	
  we	
  will	
  consider	
  the	
  specific	
  elements	
  of	
  scale,	
  capital	
  costs,	
  operational	
  
costs,	
  service	
  support,	
  failure	
  impact	
  and	
  revenue	
  diversity;	
  which	
  have	
  be	
  loosely	
  
attributed	
  below	
  to	
  the	
  4P’s.
©	
  and	
  ™	
  GB	
  Management	
  Services	
  Ltd
GB	
  Management	
  Services	
  Ltd	
  offers	
  consultancy	
  services	
  related	
  emissions	
  reduction,	
  process	
  and	
  operations	
  
improvement,	
  and	
  the	
  development	
  clean/renewable	
  technology	
  projects.	
  
Contact	
  Details:	


  Grant	
  Budge	
  	
  	
  Mobile:	
  +44	
  (0)	
  7780	
  920504 Email:	
  	
  gbudge@our-­‐future.co.uk
Scale of	
  technical	
  solutions	
  alone	
  can	
  drive	
  markets.	
  	
  Unit	
  
capacity	
  costs	
  reduce	
  with	
  increased	
  size,	
  but	
  generally	
  
engineering	
  begins	
  at	
  low	
  unit	
  scale	
  to	
  mitigate	
  financial	
  risk.	
  	
  
There	
  is	
  a	
  practical	
  balance	
  to	
  selecting	
  scale.
Product
Price
Promotion
Position
Capital	
  and	
  operating	
  costs	
  underpin	
  the	
  long	
  term	
  price	
  of	
  
a	
  solution	
  and	
  need	
  to	
  be	
  considered	
  in	
  robust	
  detail.	
  	
  As	
  
mentioned	
  in	
  previous	
  issues,	
  they	
  become	
  the	
  defining	
  
element	
  of	
  any	
  long-­‐term	
  solution.
Service	
  and	
  support	
  needs	
  must	
  be	
  assessed	
  when	
  
considering	
  emissions	
  reduction	
  pathways.	
  This	
  criterion	
  is	
  a	
  
life	
  cycle	
  functional	
  attribute	
  for	
  maintaining	
  the	
  market.	
  	
  
Failure	
  impact	
  and	
  revenue	
  diversity	
  consider	
  the	
  
solutions	
  position	
  in	
  the	
  value/supply	
  chain	
  and	
  how	
  that	
  
may	
  influence	
  the	
  market.	
  	
  
Over	
  the	
  following	
  pages	
  we	
  will	
  profile	
  each	
  emissions	
  pathway	
  around	
  these	
  four	
  criteria,	
  commenting	
  on	
  primary	
  
attributes	
  and	
  illustrating	
  through	
  spider	
  graphs,	
  the	
  challenge	
  faced	
  by	
  each	
  pathway	
  market	
  today.	
  	
  On	
  each	
  graph,	
  
the	
  further	
  away	
  from	
  the	
  centre	
  the	
  point	
  of	
  intersection,	
  the	
  greater	
  the	
  affect; the	
  cumulative	
  impact	
  being	
  
represented	
  by	
  the	
  enclosed	
  shaded	
  area.	
  	
  This	
  analysis	
  is	
  not	
  intended	
  to	
  be	
  detailed,	
  but	
  is	
  provided	
  as	
  a	
  way	
  to	
  
represent	
  the	
  scale	
  of	
  the	
  challenge	
  associated	
  to	
  each	
  pathway	
  and	
  to	
  begin	
  identification	
  of	
  ways	
  in	
  which	
  
infrastructure	
  requirements,	
  emissions	
  reduction	
  pathways	
  and	
  their	
  markets	
  could	
  be	
  designed	
  from	
  initial	
  concept	
  
to	
  be	
  complimentary.	
  
Risk
Management
Markets
©	
  GB	
  Management	
  Services	
  Ltd
Contact	
  Details:	


  Grant	
  Budge	
  	
  	
  Mobile:	
  +44	
  (0)	
  7780	
  920504 Email:	
  	
  gbudge@our-­‐future.co.uk
E|MISSION Statement ™
Scale of	
  Source	
  Substitution	
  ranges	
  from	
  kW	
  household	
  
installations	
  through	
  to	
  national	
  generation	
  infrastructure.	
  	
  
As	
  a	
  consequence	
  of	
  the	
  range	
  of	
  installation	
  scale,	
  the	
  absolute	
  
capital	
  and	
  operating	
  costs	
  are	
  equally	
  all	
  encompassing;	
  but	
  
with	
  reducing	
  unit	
  costs	
  of	
  installed	
  energy	
  capacity	
  
demonstrating	
  economies	
  of	
  scale	
  with	
  every	
  order	
  of	
  
magnitude	
  increase	
  in	
  size.	


While	
  the	
  range	
  of	
  solutions	
  could	
  push	
  the	
  service	
  support	
  
needs;	
  requiring	
  competence	
  and	
  systems	
  to	
  be	
  available	
  for	
  the	
  
complete	
  range	
  of	
  sized	
  assets;	
  there	
  is	
  overlap	
  in	
  the	
  
competence	
  and	
  resource	
  requirements	
  between	
  the	
  
installation	
  sizes,	
  allowing	
  skills	
  transferability	
  and	
  systems	
  
synergies	
  to	
  constrain	
  the	
  extent	
  of	
  the	
  challenge.
With	
  regard	
  to	
  impact	
  of	
  unit	
  failure,	
  being	
  an	
  established	
  
market	
  with	
  supply	
  system	
  redundancy,	
  this	
  should	
  be	
  
negligible.	
  	
  For	
  the	
  same	
  reason,	
  revenue	
  diversity	
  is	
  limited.	
  	
  
Demand	
  Reduction
Scale of	
  Demand	
  Reduction	
  technologies	
  is	
  firmly	
  in	
  the	
  Watt	
  
(“W”)	
  unit	
  scale.	
  	
  Real	
  change	
  comes	
  from	
  cumulative	
  sales.
Absolute	
  capital	
  costs	
  and	
  operating	
  costs	
  per	
  installation	
  
when	
  considered	
  against	
  the	
  follow-­‐on	
  technology	
  categories	
  is	
  
very	
  low	
  (i.e.	
  £100’s).
From	
  a	
  service	
  support	
  perspective,	
  being	
  mass	
  market	
  with	
  
millions	
  of	
  end	
  users,	
  they	
  require	
  extensive	
  supply	
  chains	
  to	
  
deliver	
  and	
  provide	
  the	
  follow-­‐on	
  support	
  to	
  the	
  consumer.
From	
  an	
  environment	
  and	
  market	
  level,	
  unit	
  failure	
  has	
  little	
  
demonstrable	
  impact	
  on	
  system	
  performance;	
  and	
  from	
  a	
  
supplier	
  perspective	
  the	
  products	
  are	
  single	
  CADS	
  products	
  
designed	
  for	
  individual/household	
  consumers,	
  with	
  little	
  to	
  no	
  
revenue	
  diversity	
  beyond	
  the	
  sale	
  and	
  support	
  framework.	
  
CADS	
  technologies	
  range	
  from	
  light	
  bulbs	
  to	
  cavity	
  wall	
  insulation.	
  	
  They	
  have	
  been	
  driven	
  by	
  legislation	
  for	
  the	
  
publication	
  of	
  energy	
  efficiency	
  ratings	
  and	
  the	
  promise	
  of	
  being	
  self-­‐financing	
  (the	
  future	
  reduction	
  in	
  energy	
  
consumption	
  repaying	
  the	
  capital	
  costs	
  within	
  3	
  to	
  5	
  years).	
  	
  These	
  are	
  mass	
  markets	
  and	
  to	
  date	
  have	
  evolved	
  
predominantly	
  with	
  the	
  direct	
  (i.e.	
  incentives)	
  and	
  indirect	
  (i.e.	
  policy)	
  State	
  sponsorship.	
  	
  But	
  as	
  a	
  market	
  in	
  the	
  context	
  
of	
  emissions	
  reductions	
  they	
  rank	
  as	
  follows.
Source	
  Substitution	
  is	
  a	
  holistic	
  consumer	
  segmented	
  market	
  delivering	
  through-­‐out	
  the	
  energy	
  supply	
  chain,	
  but	
  what	
  
these	
  technologies	
  don’t	
  need	
  is	
  additional	
  distribution	
  or	
  transmission	
  infrastructure.	
  They	
  are	
  supplying	
  established	
  
marketplaces	
  and	
  it	
  is	
  this	
  prevailing	
  and	
  accepted	
  market	
  structure	
  that	
  exposes	
  the	
  true	
  costs	
  of	
  introducing	
  low	
  
emissions	
  energy	
  (i.e.	
  ROC’s,	
  CfD’s).
Source	
  Substitution
Demand	
  Reduction	
  is	
  the	
  simplest	
  of	
  pathways,	
  only	
  having	
  a	
  slightly	
  elevated	
  challenge	
  profile	
  for	
  service	
  support	
  
because	
  of	
  the	
  maintenance,	
  distribution,	
  retail,	
  wholesale	
  and	
  manufacture	
  system	
  that	
  sits	
  behind	
  it;	
  albeit	
  that	
  for	
  
the	
  most	
  part,	
  these	
  services	
  already	
  exist	
  and	
  are	
  simply	
  being	
  redefined.
Source	
  Substitution	
  is	
  the	
  modular	
  restructuring	
  of	
  an	
  existing	
  system,	
  which	
  only	
  provides	
  a	
  high	
  challenge	
  upon	
  initial	
  
scaling	
  and	
  associated	
  funding.	
  	
  In	
  the	
  long	
  term,	
  both	
  scale	
  and	
  cost	
  challenges	
  will	
  reduce	
  for	
  Source	
  Substitution	
  
pathways,	
  as	
  they	
  have	
  over	
  the	
  past	
  two	
  decades	
  for	
  solar	
  and	
  wind.
SCALE
SERVICE
COSTS
IMPACT
SCALE
SERVICE
COSTS
IMPACT
©	
  GB	
  Management	
  Services	
  Ltd
Contact	
  Details:	


  Grant	
  Budge	
  	
  	
  Mobile:	
  +44	
  (0)	
  7780	
  920504 Email:	
  	
  gbudge@our-­‐future.co.uk
E|MISSION Statement ™
Demand	
  Substitution
Scale of	
  Demand	
  Substitution	
  ranges	
  from	
  W	
  to	
  kW	
  household	
  
and	
  business	
  installations.	
  	
  They	
  do	
  not	
  necessarily	
  require	
  
significant	
  new	
  infrastructure	
  and	
  infrastructure	
  required	
  can	
  be	
  
decentralised	
  if	
  economical	
  to	
  do	
  so.	
  	
  
The	
  absolute	
  capital	
  and	
  operating	
  costs	
  are	
  relatively	
  low	
  at	
  an	
  
installation	
  level,	
  but	
  are	
  high	
  from	
  a	
  unit	
  of	
  energy	
  output	
  	
  
perspective	
  compared	
  to	
  their	
  historical	
  equivalent.	


The	
  range	
  of	
  CADS	
  products	
  in	
  Demand	
  Substitution	
  pushes	
  the	
  
service	
  support	
  needs;	
  requiring	
  competence	
  to	
  be	
  available	
  
across	
  a	
  diverse	
  portfolio	
  with	
  little	
  overlap	
  in	
  skills	
  from	
  one	
  
technology	
  to	
  another.	
  	
  Support	
  infrastructure	
  (PAPS)	
  
management	
  is	
  less	
  demanding	
  and	
  for	
  the	
  most	
  part	
  reinforcing	
  
of	
  existing	
  services.	
  
With	
  regard	
  to	
  impact	
  of	
  unit	
  failure,	
  Demand	
  Substitution
Demand	
  Substitution	
  are	
  predominantly	
  CADS	
  driven	
  markets	
  (i.e.	
  heat	
  electrification,	
  EV,	
  fuel	
  cell	
  and	
  hydrogen	
  
grid)	
  that	
  require	
  some	
  but	
  not	
  extensive	
  additional	
  PAPS,	
  distribution	
  and	
  transmissions	
  capability.	
  	
  
Source	
  Mitigation
The	
  scale	
  of	
  these	
  assets	
  covers	
  the	
  mid-­‐range	
  of	
  KW	
  to	
  MW	
  
business	
  and	
  process	
  energy	
  driven	
  solutions.
Capital	
  and	
  operating	
  costs	
  replicate	
  scale	
  and	
  represent	
  a	
  
mid-­‐range	
  challenge,	
  but	
  economies	
  of	
  scale	
  will	
  yield	
  a	
  
lower	
  unit	
  cost.	
  
Service	
  support needs	
  are	
  generally	
  considered	
  bespoke	
  and	
  
decentralised,	
  but	
  through	
  strategic	
  State	
  level	
  planning	
  
some	
  could	
  be	
  common	
  (i.e.	
  hydrogen	
  grid).	


Impact	
  of	
  failure	
  is	
  low.	
  	
  From	
  an	
  industrial	
  perspective	
  raw	
  
material	
  and	
  product	
  buffer	
  stocks	
  exist	
  within	
  the	
  supply	
  
chain	
  to	
  absorb	
  any	
  issues;	
  and	
  from	
  a	
  power	
  perspective	
  
redundant	
  capacity	
  absorb	
  any	
  individual	
  failure.	
  	
  There	
  is	
  
limited	
  revenue	
  diversity	
  with	
  each	
  system	
  delivering	
  a	
  
specific	
  product.	


Source	
  Mitigation	
  is	
  a	
  business	
  level	
  intervention	
  that	
  requires	
  a	
  shift	
  in	
  business	
  behaviour	
  and	
  which	
  significantly	
  
impacts	
  on	
  the	
  energy	
  supply	
  chain.	
  	
  
being	
  predominantly	
  consumer	
  level,	
  small	
  and	
  modular	
  in	
  design,	
  failure	
  of	
  a	
  product has	
  little	
  impact	
  and	
  is	
  
manageable.	
  	
  For	
  the	
  PAPS	
  supply	
  infrastructure,	
  electricity	
  and	
  gas	
  systems	
  have	
  embedded	
  redundancy	
  to	
  
compensate	
  and	
  manage	
  individual	
  system	
  failures.	
  	
  Demand	
  Substitution	
  also	
  has	
  limited	
  revenue	
  diversity.	
  	
  
Demand	
  Substitution	
  can	
  be	
  seen	
  to	
  be	
  relatively	
  modest	
  on	
  the	
  scale,	
  cost	
  and	
  impact	
  axes,	
  but	
  due	
  predominantly	
  
to	
  the	
  potential	
  for	
  hydrogen	
  as	
  a	
  heat	
  and	
  mobility	
  fuel	
  substitute,	
  begins	
  to	
  impose	
  greater	
  service	
  and	
  impact	
  of	
  
failure	
  risks	
  on	
  the	
  market.
Source	
  Mitigation	
  represents	
  a	
  cost	
  and	
  scale	
  challenge.	
  	
  But	
  while	
  there	
  is	
  a	
  lower	
  identified	
  challenge	
  related	
  to	
  
service	
  and	
  impact	
  	
  of	
  failure,	
  these	
  	
  Source	
  Mitigations	
  require	
  new	
  supply	
  chains	
  which	
  must	
  be	
  created	
  and	
  
managed	
  (i.e.	
  biomass,	
  biofuel	
  etc).	
  	
  
SCALE
SERVICE
COSTS
IMPACT
SCALE
SERVICE
COSTS
IMPACT
©	
  GB	
  Management	
  Services	
  Ltd
Contact	
  Details:	


  Grant	
  Budge	
  	
  	
  Mobile:	
  +44	
  (0)	
  7780	
  920504 Email:	
  	
  gbudge@our-­‐future.co.uk
E|MISSION Statement ™
Demand	
  Reduction	
  and	
  Source	
  Substitution	
  are	
  predominantly	
  either:	
  decentralised markets,	
  as	
  with	
  energy	
  efficient	
  
household	
  products	
  and	
  residential/community	
  energy	
  production	
  systems	
  (i.e.	
  solar)	
  or	
  feed	
  into	
  established	
  mature	
  
markets.	
  	
  They	
  are	
  to	
  a	
  large	
  extent	
  market	
  ‘reworking’	
  and	
  as	
  such,	
  from	
  a	
  market	
  performance	
  perspective	
  across	
  
the	
  redefined	
  metrics	
  (i.e.	
  product,	
  price,	
  promotion,	
  position),	
  their	
  market	
  and	
  associated	
  environmental	
  impact	
  is	
  
incremental,	
  contained	
  and	
  relatively	
  simple.	
  	
  The	
  same	
  cannot	
  be	
  said	
  for	
  the	
  latter	
  three	
  emissions	
  reduction	
  stages.	


We	
  have	
  stated	
  before	
  that	
  there	
  can	
  be	
  synergies	
  from	
  an	
  integrated	
  solution	
  for	
  Demand	
  Substitution,	
  Source	
  
Mitigation	
  and	
  Source	
  Containment,	
  and	
  to	
  demonstrate	
  this	
  we	
  illustrate	
  three	
  market	
  “infrastructure”	
  models	
  that	
  
could	
  be	
  progressed.	
  	
  They	
  are	
  ‘Generic’,	
  ‘Bespoke’	
  and	
  ‘Tailored’;	
  and	
  they	
  are	
  defined	
  below	
  and	
  illustrated	
  on	
  the	
  
next	
  page.
A	
  Generic	
  Model.	
  This	
  is	
  a	
  base	
  case	
  Source	
  Containment	
  design	
  where	
  all	
  independent	
  power	
  utilities	
  and	
  process	
  
industries	
  make	
  their	
  own	
  technology/project	
  decisions	
  (i.e.	
  pre	
  or	
  post	
  combustion)	
  and	
  investment	
  cases.	
  	
  Under	
  this	
  
scenario,	
  the	
  guaranteed	
  cost	
  of	
  carbon	
  deliverable	
  needs	
  to	
  be	
  high	
  to	
  support	
  investment;	
  and	
  certainty	
  over	
  fuel	
  
and	
  power	
  forecasting	
  needs	
  to	
  be	
  strong	
  to	
  allow	
  investment	
  cases	
  to	
  be	
  made.	
  	
  In	
  general,	
  this	
  market	
  will	
  progress	
  
slowly,	
  will	
  require	
  complex	
  administration	
  for	
  the	
  supply	
  of	
  State	
  funding,	
  will	
  require	
  early	
  stage	
  Policy	
  to	
  support	
  
private	
  investment	
  decisions	
  and	
  can	
  lead	
  to	
  the	
  embedding	
  of	
  redundant	
  plant	
  costs	
  into	
  the	
  market	
  pricing.	
  
A	
  Bespoke	
  Model.	
  This	
  is	
  where	
  independent	
  power	
  utilities	
  and	
  process	
  industries	
  make	
  their	
  own	
  decisions	
  based	
  on	
  
standalone	
  pre-­‐combustion	
  capture	
  assets	
  combined	
  with	
  gas	
  power	
  islands	
  (CCGT),	
  to	
  develop	
  hydrogen	
  revenue	
  and	
  
potentially	
  low	
  volume	
  carbon	
  dioxide	
  utilisation.	
  First	
  mover	
  advantage	
  (or	
  State	
  geographic	
  bias	
  as	
  proposed	
  in	
  Issue	
  
5)	
  will	
  enhance	
  load	
  factors	
  for	
  a	
  smaller	
  number	
  of	
  assets,	
  aiding	
  project	
  finance,	
  and	
  modestly	
  reducing	
  the	
  costs	
  of	
  
CO2 transport	
  and	
  storage	
  (i.e.	
  fewer	
  site	
  connections,	
  reduced	
  control	
  complexity	
  and	
  reduced	
  national	
  
infrastructure).	
  	
  This	
  market	
  will	
  progress	
  slightly	
  quicker;	
  will	
  require	
  less	
  complex	
  administration	
  for	
  the	
  supply	
  of	
  
State	
  funding;	
  if	
  openly	
  endorsed	
  as	
  ‘low	
  emissions	
  development	
  regions’	
  will	
  require	
  less	
  Policy	
  to	
  support	
  private	
  
investment	
  decisions;	
  will	
  lead	
  to	
  the	
  embedding	
  of	
  limited	
  redundant	
  plant	
  costs	
  into	
  the	
  market	
  pricing;	
  and	
  will	
  
retain	
  some	
  freedom	
  for	
  technology	
  vendor	
  selection.	
  
A	
  Tailored	
  Model. This	
  is	
  where	
  independent	
  power	
  utilities	
  and	
  process	
  industries	
  build	
  own	
  and	
  operate	
  their	
  own	
  
assets	
  around	
  a	
  State	
  defined	
  geographic	
  location;	
  and	
  contract	
  with	
  a	
  centralised hydrogen	
  generation	
  plant	
  or	
  local	
  
biomass/biofuel	
  supply	
  chain.	
  	
  Here	
  the	
  businesses	
  can	
  still	
  be	
  in	
  control	
  of	
  commodity	
  procurement	
  (retaining	
  a	
  
competitive	
  market),	
  providing	
  raw	
  fuels	
  to	
  the	
  central	
  facility	
  and	
  taking	
  hydrogen	
  under	
  a	
  tolling	
  agreement.	
  	
  The	
  
Technology	
  Design	
  of	
  the	
  central	
  unit	
  or	
  bio-­‐supply	
  network	
  becomes	
  key	
  here.	
  	
  The	
  central	
  operation	
  doesn’t	
  have	
  to	
  
be	
  under	
  single	
  ownership	
  or	
  a	
  single	
  technology,	
  it	
  can	
  simply	
  be	
  a	
  State	
  location	
  determined	
  for	
  infrastructure	
  
development.	
  	
  This	
  would	
  retain	
  technology	
  and	
  supplier	
  competition,	
  but	
  at	
  the	
  same	
  time	
  would	
  simplify	
  associated	
  
infrastructure	
  needs.	
  
Optimising the	
  Source	
  Containment	
  Proposition
Source	
  Containment
Source	
  Containment	
  is	
  the	
  simplest	
  market	
  to	
  
characterise	
  because	
  it	
  deals	
  with	
  an	
  issue	
  that	
  all	
  
other	
  pathways	
  have	
  failed	
  to	
  achieve.	
  	
  For	
  emissions	
  
reductions,	
  these	
  interventions	
  are	
  at	
  +MW	
  scale,	
  
initially	
  require	
  separation	
  of	
  the	
  problem	
  and	
  then	
  
treatment	
  of	
  the	
  problem	
  whether	
  by	
  storage	
  of	
  re-­‐
purposing.	
  Costs	
  are	
  high,	
  system	
  support	
  needs	
  are	
  
high	
  to	
  maintain	
  operational	
  capacity,	
  risk	
  of	
  system	
  
failure	
  is	
  high	
  and	
  potential	
  market	
  diversity	
  is	
  high.	
  
Pictorially,	
  the	
  profile	
  of	
  all	
  attributes	
  is	
  identical.	
  
It	
  is	
  clear	
  from	
  the	
  spider	
  graph	
  that	
  Source	
  
Containment	
  represents	
  the	
  greatest	
  challenge	
  for	
  
delivery.	
  But	
  it	
  is	
  also	
  true	
  that	
  the	
  development	
  of	
  
this	
  market	
  is	
  inevitable	
  if	
  emissions	
  targets	
  up	
  to	
  
2050	
  are	
  to	
  be	
  attained.
SCALE
SERVICE
COSTS
IMPACT
©	
  GB	
  Management	
  Services	
  Ltd
Contact	
  Details:	


  Grant	
  Budge	
  	
  	
  Mobile:	
  +44	
  (0)	
  7780	
  920504 Email:	
  	
  gbudge@our-­‐future.co.uk
E|MISSION Statement ™
CCUS	
  Strategic	
  Gas	
  
Power	
  Station
CCUS	
  Strategic	
  Gas	
  
Power	
  Station
1	
  GWt Capacity
60%	
  Load	
  Factor
4GWt
CO2 Store
CCUS	
  Gas	
  Power
Station
CCUS	
  Gas	
  Power
Station
5GWt
CO2	
  Store
CCUS	
  Gas	
  Power
Station
CCUS	
  Industrial
Process
CCUS	
  Industrial
Process
1	
  GWt Capacity
70%	
  Load	
  Factor
1	
  GWt Capacity
40%	
  Load	
  Factor
1	
  GWt Capacity
40%	
  Load	
  Factor
1GWt	
  Capacity
70%	
  Load	
  Factor
1	
  GWt Capacity
40%	
  Load	
  Factor
1	
  GWt Capacity
60%	
  Load	
  Factor
1	
  GWt Capacity
70%	
  Load	
  Factor
2.6GWt
CO2Store2.6	
  GWt
Carbon	
  Capture
Gas	
  Power	
  
Station
1	
  GW	
  Capacity
60%	
  Load	
  Factor
CCUS	
  Industrial
Process
1	
  GWt Capacity
70%	
  Load	
  Factor
CCUS	
  Industrial
Process
1	
  GW	
  Capacity
60%	
  Load	
  Factor
1	
  GWt Capacity
70%	
  Load	
  Factor
Industrial
Process
1	
  GWt Capacity
70%	
  Load	
  Factor
Industrial
Process
Gas	
  Power	
  
Station
Cluster	
  CO2	
  
Utilisation
H2	
   Grid
H2
H2
H2
H2
H2
H2
H2
H2
H2
CO2
Utilisation
CO2
Utilisation
CO2
Utilisation
CO2
Utilisation
H2
CO2
Utilisation
H2
H2
CO2
Utilisation
CO2
Utilisation
Generic	
  System
Bespoke	
  System
Tailored	
  System
©	
  GB	
  Management	
  Services	
  Ltd
Contact	
  Details:	


  Grant	
  Budge	
  	
  	
  Mobile:	
  +44	
  (0)	
  7780	
  920504 Email:	
  	
  gbudge@our-­‐future.co.uk
E|MISSION Statement ™
The	
  below	
  assessment	
  utilises the	
  infrastructure	
  models	
  illustrated	
  on	
  the	
  previous	
  page	
  and	
  considers	
  how	
  they	
  could	
  
impact	
  on	
  the	
  delivery	
  of	
  a	
  market	
  for	
  Source	
  Containment.	
  	
  For	
  simplicity	
  and	
  quantification	
  of	
  the	
  benefits	
  the	
  
following	
  terms	
  of	
  reference	
  have	
  been	
  used:
• Cost	
  of	
  1GWt	
  of	
  capacity	
  taken	
  as	
  £1	
  Billion	
  for	
  each	
  discrete	
  process/unit	
  (i.e.	
  Power,	
  Industrial,	
  Carbon	
  Capture,	
  
Transport	
  and	
  Storage)	
  Capital	
  costs	
  reduce	
  25%	
  per	
  100%	
  increase	
  in	
  unit	
  level	
  installation	
  capacity
• Cost	
  of	
  operation	
  of	
  1GWt	
  capacity	
  taken	
  at	
  £0.1	
  Billion	
  per	
  annum	
  at	
  40%	
  utilisation/load	
  factor
• Unit	
  operating	
  costs	
  reduce	
  5%	
  per	
  10%	
  increase	
  in	
  utilisation rate
• Cost	
  of	
  hydrogen	
  and	
  CO2 pipelines	
  to	
  and	
  from	
  site	
  assumed	
  to	
  be	
  negligible
• Common	
  CCS	
  capacity	
  taken	
  at	
  potential	
  peak	
  load	
  rate	
  of	
  installed	
  source	
  units
• 1GWt	
  of	
  capacity	
  treated	
  as	
  an	
  operational	
  ‘node’
• Failure	
  impact	
  has	
  been	
  treated	
  as	
  uniform	
  for	
  all	
  models,	
  because	
  this	
  can	
  be	
  controlled	
  under	
  all	
  strategies	
  
through	
  redundancy	
  and	
  modular	
  design.
• Assumption	
  that	
  pre-­‐combustion	
  technology	
  is	
  the	
  core	
  technology	
  for	
  Bespoke	
  and	
  Tailored	
  Systems
• Revenue	
  Diversity	
  has	
  been	
  assessed	
  based	
  on	
  a	
  %	
  increase	
  in	
  the	
  value	
  proposition,	
  pro-­‐rata	
  with	
  a	
  reduction	
  in	
  
number	
  of	
  market	
  entry	
  points;	
  due	
  to	
  the	
  reduced	
  price	
  of	
  services	
  supporting	
  greater	
  market	
  diversity.
• Scores	
  illustrated	
  as	
  relative	
  to	
  ‘Generic’	
  template	
  (base	
  case),	
  which	
  is	
  taken	
  as	
  indexed	
  at	
  100%
Impact	
  of	
  an	
  Optimised Source	
  Containment	
  Proposition
GENERIC	
  
SYSTEM
BESPOKE	
  
SYSTEM
TAILORED	
  
SYSTEM
Scale	
  /	
  Size 100% 80% 59%
Capital	
  Costs 100% 80% 68%
Operating	
  Costs 100% 80% 61%
Service	
  Support 100% 80% 61%
Failure	
  Impact 100% 100% 100%
Revenue	
  Diversity 100% 80% 35%
What	
  the	
  analysis	
  shows,	
  is	
  that	
  the	
  
challenge	
  against	
  each	
  of	
  the	
  
criterion	
  can	
  be	
  reduced	
  	
  
significantly	
  as	
  we	
  pursue	
  a	
  design	
  
concept	
  based	
  on	
  an	
  integrated	
  
solution,	
  rather	
  than	
  a	
  first	
  past	
  the	
  
post	
  approach.	
  	
  This	
  reduction	
  is	
  
illustrated	
  below	
  in	
  spider	
  graph	
  
form,	
  for	
  the	
  Bespoke	
  and	
  Tailored	
  
solutions	
  (Generic	
  having	
  been	
  
illustrated	
  already	
  under	
  Source	
  
containment	
  section	
  earlier).	
  	
  
SCALE
SERVICE
COSTS
IMPACT
Tailored
System
SCALE
SERVICE
COSTS
IMPACT
Bespoke
System

More Related Content

What's hot

Smart Charging: How to scale adoption
Smart Charging: How to scale adoption  Smart Charging: How to scale adoption
Smart Charging: How to scale adoption accenture
 
Sangyun Lee, ‘Abuse of Economic Dependence in Competition Law From a Comparat...
Sangyun Lee, ‘Abuse of Economic Dependence in Competition Law From a Comparat...Sangyun Lee, ‘Abuse of Economic Dependence in Competition Law From a Comparat...
Sangyun Lee, ‘Abuse of Economic Dependence in Competition Law From a Comparat...Sangyun Lee
 
Market Analysis and Business Plan for Residential Energy Efficiency Services
Market Analysis and Business Plan for Residential Energy Efficiency ServicesMarket Analysis and Business Plan for Residential Energy Efficiency Services
Market Analysis and Business Plan for Residential Energy Efficiency ServicesAlbert Graells Vilella
 
Revitializing The Utility Customer Relationship
Revitializing The Utility Customer RelationshipRevitializing The Utility Customer Relationship
Revitializing The Utility Customer RelationshipMatt Wolfrom
 
Energy performance retails
Energy performance retailsEnergy performance retails
Energy performance retailsFranck THARREAU
 
Capgemini ses - smart grid operational services - todays smart metering bro...
Capgemini   ses - smart grid operational services - todays smart metering bro...Capgemini   ses - smart grid operational services - todays smart metering bro...
Capgemini ses - smart grid operational services - todays smart metering bro...Gord Reynolds
 
Capgemini_Smart Meter POV_2009
Capgemini_Smart Meter POV_2009Capgemini_Smart Meter POV_2009
Capgemini_Smart Meter POV_2009Jeffrey Norman
 
IDC_EON_Case_Study
IDC_EON_Case_StudyIDC_EON_Case_Study
IDC_EON_Case_StudyJawad Bhatti
 
Revealing the value of flexibility
Revealing the value of flexibilityRevealing the value of flexibility
Revealing the value of flexibilityStephen Woodhouse
 
T keynote 845_valoochi
T keynote 845_valoochiT keynote 845_valoochi
T keynote 845_valoochirobgirvan
 
A Methodology for Identifying Best Practices
A Methodology for Identifying Best PracticesA Methodology for Identifying Best Practices
A Methodology for Identifying Best PracticesZENeSYS
 
Utility Evolution Benchmarking Study Report
Utility Evolution Benchmarking Study ReportUtility Evolution Benchmarking Study Report
Utility Evolution Benchmarking Study ReportPeter Manos
 
Frontier report-competition-and-entry-in-the-gb-electricity-retail-market
Frontier report-competition-and-entry-in-the-gb-electricity-retail-marketFrontier report-competition-and-entry-in-the-gb-electricity-retail-market
Frontier report-competition-and-entry-in-the-gb-electricity-retail-marketDr Lendy Spires
 
Access regulation. Challenges and Solutions - Marc Lebourges:
Access regulation. Challenges and Solutions - Marc Lebourges: Access regulation. Challenges and Solutions - Marc Lebourges:
Access regulation. Challenges and Solutions - Marc Lebourges: FSR Communications and Media
 

What's hot (19)

Smart Charging: How to scale adoption
Smart Charging: How to scale adoption  Smart Charging: How to scale adoption
Smart Charging: How to scale adoption
 
Smart Metering POV
Smart Metering POVSmart Metering POV
Smart Metering POV
 
Sangyun Lee, ‘Abuse of Economic Dependence in Competition Law From a Comparat...
Sangyun Lee, ‘Abuse of Economic Dependence in Competition Law From a Comparat...Sangyun Lee, ‘Abuse of Economic Dependence in Competition Law From a Comparat...
Sangyun Lee, ‘Abuse of Economic Dependence in Competition Law From a Comparat...
 
Market Analysis and Business Plan for Residential Energy Efficiency Services
Market Analysis and Business Plan for Residential Energy Efficiency ServicesMarket Analysis and Business Plan for Residential Energy Efficiency Services
Market Analysis and Business Plan for Residential Energy Efficiency Services
 
Revitializing The Utility Customer Relationship
Revitializing The Utility Customer RelationshipRevitializing The Utility Customer Relationship
Revitializing The Utility Customer Relationship
 
Energy performance retails
Energy performance retailsEnergy performance retails
Energy performance retails
 
Capgemini ses - smart grid operational services - todays smart metering bro...
Capgemini   ses - smart grid operational services - todays smart metering bro...Capgemini   ses - smart grid operational services - todays smart metering bro...
Capgemini ses - smart grid operational services - todays smart metering bro...
 
Capgemini_Smart Meter POV_2009
Capgemini_Smart Meter POV_2009Capgemini_Smart Meter POV_2009
Capgemini_Smart Meter POV_2009
 
IDC_EON_Case_Study
IDC_EON_Case_StudyIDC_EON_Case_Study
IDC_EON_Case_Study
 
Revealing the value of flexibility
Revealing the value of flexibilityRevealing the value of flexibility
Revealing the value of flexibility
 
T keynote 845_valoochi
T keynote 845_valoochiT keynote 845_valoochi
T keynote 845_valoochi
 
TeBIT Benchmark Executive Report 2012
TeBIT Benchmark Executive Report 2012TeBIT Benchmark Executive Report 2012
TeBIT Benchmark Executive Report 2012
 
Economic analysis and evidence in abuse cases – WANG – December 2021 OECD dis...
Economic analysis and evidence in abuse cases – WANG – December 2021 OECD dis...Economic analysis and evidence in abuse cases – WANG – December 2021 OECD dis...
Economic analysis and evidence in abuse cases – WANG – December 2021 OECD dis...
 
A Methodology for Identifying Best Practices
A Methodology for Identifying Best PracticesA Methodology for Identifying Best Practices
A Methodology for Identifying Best Practices
 
Utility Evolution Benchmarking Study Report
Utility Evolution Benchmarking Study ReportUtility Evolution Benchmarking Study Report
Utility Evolution Benchmarking Study Report
 
Frontier report-competition-and-entry-in-the-gb-electricity-retail-market
Frontier report-competition-and-entry-in-the-gb-electricity-retail-marketFrontier report-competition-and-entry-in-the-gb-electricity-retail-market
Frontier report-competition-and-entry-in-the-gb-electricity-retail-market
 
Methodologies to Measure Market Competition – NEW-ZEALAND – June 2021 OECD di...
Methodologies to Measure Market Competition – NEW-ZEALAND – June 2021 OECD di...Methodologies to Measure Market Competition – NEW-ZEALAND – June 2021 OECD di...
Methodologies to Measure Market Competition – NEW-ZEALAND – June 2021 OECD di...
 
Economic analysis and evidence in abuse cases – Break-out Session 3 – Techniq...
Economic analysis and evidence in abuse cases – Break-out Session 3 – Techniq...Economic analysis and evidence in abuse cases – Break-out Session 3 – Techniq...
Economic analysis and evidence in abuse cases – Break-out Session 3 – Techniq...
 
Access regulation. Challenges and Solutions - Marc Lebourges:
Access regulation. Challenges and Solutions - Marc Lebourges: Access regulation. Challenges and Solutions - Marc Lebourges:
Access regulation. Challenges and Solutions - Marc Lebourges:
 

Similar to Emission Statement - Issue 6 - Markets

Emission Statement - Technology Design - Issue 3
Emission Statement - Technology Design -  Issue 3Emission Statement - Technology Design -  Issue 3
Emission Statement - Technology Design - Issue 3Grant Budge
 
Emission Statment - Issue 7 - Operational Optimisation
Emission Statment - Issue 7 - Operational OptimisationEmission Statment - Issue 7 - Operational Optimisation
Emission Statment - Issue 7 - Operational OptimisationGrant Budge
 
Managing the Energy Information Grid - Digital Strategies for Utilities
Managing the Energy Information Grid - Digital Strategies for UtilitiesManaging the Energy Information Grid - Digital Strategies for Utilities
Managing the Energy Information Grid - Digital Strategies for UtilitiesIndigo Advisory Group
 
Adroit - Steve Sheppard and Alex Roy
Adroit - Steve Sheppard and Alex RoyAdroit - Steve Sheppard and Alex Roy
Adroit - Steve Sheppard and Alex RoyMarit Hendriks
 
Delivering New Energy Experiences for Future Growth
Delivering New Energy Experiences for Future GrowthDelivering New Energy Experiences for Future Growth
Delivering New Energy Experiences for Future GrowthAmrYasser40
 
Delivering New Energy Experiences for Future Growth
Delivering New Energy Experiences for Future GrowthDelivering New Energy Experiences for Future Growth
Delivering New Energy Experiences for Future Growthaccenture
 
Zero-subsidy Onshore Wind Energy Projects
Zero-subsidy Onshore Wind Energy ProjectsZero-subsidy Onshore Wind Energy Projects
Zero-subsidy Onshore Wind Energy ProjectsStavros Thomas
 
Using an Integrated Approach to Guide Your Insurance Services Transformation
Using an Integrated Approach to Guide Your Insurance Services TransformationUsing an Integrated Approach to Guide Your Insurance Services Transformation
Using an Integrated Approach to Guide Your Insurance Services TransformationTory Ragsdale, MS, MBA, PMP
 
EnVogue July'14 Edition #EnergyEfficiency #EETPL #India
EnVogue July'14 Edition #EnergyEfficiency #EETPL #IndiaEnVogue July'14 Edition #EnergyEfficiency #EETPL #India
EnVogue July'14 Edition #EnergyEfficiency #EETPL #IndiaUmesh Bhutoria
 
Smart energy innovation may17 (3)
Smart energy innovation   may17 (3)Smart energy innovation   may17 (3)
Smart energy innovation may17 (3)Let's Learn Digital
 
Bems 12-executive-summary
Bems 12-executive-summaryBems 12-executive-summary
Bems 12-executive-summarySeongnam Jee
 
Poyry - From ambition to reality? – Decarbonisation of the European electrici...
Poyry - From ambition to reality? – Decarbonisation of the European electrici...Poyry - From ambition to reality? – Decarbonisation of the European electrici...
Poyry - From ambition to reality? – Decarbonisation of the European electrici...Pöyry
 
Diversifying Into Renewable Energy: Challenges And Opportunities
Diversifying Into Renewable Energy: Challenges And OpportunitiesDiversifying Into Renewable Energy: Challenges And Opportunities
Diversifying Into Renewable Energy: Challenges And OpportunitiesCTRM Center
 
Rauluk Testimony Final no pics
Rauluk Testimony Final no picsRauluk Testimony Final no pics
Rauluk Testimony Final no picsValerie Rauluk
 
Sesión 6: La experiencia de Trinidad y Tobago
Sesión 6:  La experiencia de Trinidad y TobagoSesión 6:  La experiencia de Trinidad y Tobago
Sesión 6: La experiencia de Trinidad y TobagoIndotel RD
 
PA Cost Out Maturity Benchmark - Full 10 Sector Report v 141016
PA Cost Out Maturity Benchmark - Full 10 Sector Report v 141016PA Cost Out Maturity Benchmark - Full 10 Sector Report v 141016
PA Cost Out Maturity Benchmark - Full 10 Sector Report v 141016Liam Palmer
 
Emissions Trading - More Detail
Emissions Trading - More DetailEmissions Trading - More Detail
Emissions Trading - More DetailDavid Hone
 
Accenture digitally-enabled-grid-pov-utility-distribution
Accenture digitally-enabled-grid-pov-utility-distributionAccenture digitally-enabled-grid-pov-utility-distribution
Accenture digitally-enabled-grid-pov-utility-distributionStu Laurie
 

Similar to Emission Statement - Issue 6 - Markets (20)

Emission Statement - Technology Design - Issue 3
Emission Statement - Technology Design -  Issue 3Emission Statement - Technology Design -  Issue 3
Emission Statement - Technology Design - Issue 3
 
Emission Statment - Issue 7 - Operational Optimisation
Emission Statment - Issue 7 - Operational OptimisationEmission Statment - Issue 7 - Operational Optimisation
Emission Statment - Issue 7 - Operational Optimisation
 
Managing the Energy Information Grid - Digital Strategies for Utilities
Managing the Energy Information Grid - Digital Strategies for UtilitiesManaging the Energy Information Grid - Digital Strategies for Utilities
Managing the Energy Information Grid - Digital Strategies for Utilities
 
Adroit - Steve Sheppard and Alex Roy
Adroit - Steve Sheppard and Alex RoyAdroit - Steve Sheppard and Alex Roy
Adroit - Steve Sheppard and Alex Roy
 
Delivering New Energy Experiences for Future Growth
Delivering New Energy Experiences for Future GrowthDelivering New Energy Experiences for Future Growth
Delivering New Energy Experiences for Future Growth
 
Delivering New Energy Experiences for Future Growth
Delivering New Energy Experiences for Future GrowthDelivering New Energy Experiences for Future Growth
Delivering New Energy Experiences for Future Growth
 
Zero-subsidy Onshore Wind Energy Projects
Zero-subsidy Onshore Wind Energy ProjectsZero-subsidy Onshore Wind Energy Projects
Zero-subsidy Onshore Wind Energy Projects
 
Using an Integrated Approach to Guide Your Insurance Services Transformation
Using an Integrated Approach to Guide Your Insurance Services TransformationUsing an Integrated Approach to Guide Your Insurance Services Transformation
Using an Integrated Approach to Guide Your Insurance Services Transformation
 
Using an Integrated Approach to Guide Your Insurance Services Transformation
Using an Integrated Approach to Guide Your Insurance Services TransformationUsing an Integrated Approach to Guide Your Insurance Services Transformation
Using an Integrated Approach to Guide Your Insurance Services Transformation
 
EnVogue July'14 Edition #EnergyEfficiency #EETPL #India
EnVogue July'14 Edition #EnergyEfficiency #EETPL #IndiaEnVogue July'14 Edition #EnergyEfficiency #EETPL #India
EnVogue July'14 Edition #EnergyEfficiency #EETPL #India
 
Smart energy innovation may17 (3)
Smart energy innovation   may17 (3)Smart energy innovation   may17 (3)
Smart energy innovation may17 (3)
 
Bems 12-executive-summary
Bems 12-executive-summaryBems 12-executive-summary
Bems 12-executive-summary
 
Poyry - From ambition to reality? – Decarbonisation of the European electrici...
Poyry - From ambition to reality? – Decarbonisation of the European electrici...Poyry - From ambition to reality? – Decarbonisation of the European electrici...
Poyry - From ambition to reality? – Decarbonisation of the European electrici...
 
Diversifying Into Renewable Energy: Challenges And Opportunities
Diversifying Into Renewable Energy: Challenges And OpportunitiesDiversifying Into Renewable Energy: Challenges And Opportunities
Diversifying Into Renewable Energy: Challenges And Opportunities
 
Rauluk Testimony Final no pics
Rauluk Testimony Final no picsRauluk Testimony Final no pics
Rauluk Testimony Final no pics
 
Sesión 6: La experiencia de Trinidad y Tobago
Sesión 6:  La experiencia de Trinidad y TobagoSesión 6:  La experiencia de Trinidad y Tobago
Sesión 6: La experiencia de Trinidad y Tobago
 
Solar city distributed_grid
Solar city distributed_gridSolar city distributed_grid
Solar city distributed_grid
 
PA Cost Out Maturity Benchmark - Full 10 Sector Report v 141016
PA Cost Out Maturity Benchmark - Full 10 Sector Report v 141016PA Cost Out Maturity Benchmark - Full 10 Sector Report v 141016
PA Cost Out Maturity Benchmark - Full 10 Sector Report v 141016
 
Emissions Trading - More Detail
Emissions Trading - More DetailEmissions Trading - More Detail
Emissions Trading - More Detail
 
Accenture digitally-enabled-grid-pov-utility-distribution
Accenture digitally-enabled-grid-pov-utility-distributionAccenture digitally-enabled-grid-pov-utility-distribution
Accenture digitally-enabled-grid-pov-utility-distribution
 

Recently uploaded

Unit 1 - introduction to environmental studies.pdf
Unit 1 - introduction to environmental studies.pdfUnit 1 - introduction to environmental studies.pdf
Unit 1 - introduction to environmental studies.pdfRajjnish1
 
Delivering nature-based solution outcomes by addressing policy, institutiona...
Delivering nature-based solution outcomes by addressing  policy, institutiona...Delivering nature-based solution outcomes by addressing  policy, institutiona...
Delivering nature-based solution outcomes by addressing policy, institutiona...CIFOR-ICRAF
 
See How do animals kill their prey for food
See How do animals kill their prey for foodSee How do animals kill their prey for food
See How do animals kill their prey for fooddrsk203
 
AI and Ecology - The H4rmony Project.pptx
AI and Ecology - The H4rmony Project.pptxAI and Ecology - The H4rmony Project.pptx
AI and Ecology - The H4rmony Project.pptxNeoV2
 
Call Girls Abids 7001305949 all area service COD available Any Time
Call Girls Abids 7001305949 all area service COD available Any TimeCall Girls Abids 7001305949 all area service COD available Any Time
Call Girls Abids 7001305949 all area service COD available Any Timedelhimodelshub1
 
EARTH DAY Slide show EARTHDAY.ORG is unwavering in our commitment to end plas...
EARTH DAY Slide show EARTHDAY.ORG is unwavering in our commitment to end plas...EARTH DAY Slide show EARTHDAY.ORG is unwavering in our commitment to end plas...
EARTH DAY Slide show EARTHDAY.ORG is unwavering in our commitment to end plas...Aqsa Yasmin
 
Environmental and Social Impact Assessment
Environmental and Social Impact AssessmentEnvironmental and Social Impact Assessment
Environmental and Social Impact AssessmentTesfahunTesema
 
Air pollution soli pollution water pollution noise pollution land pollution
Air pollution soli pollution water pollution noise pollution land pollutionAir pollution soli pollution water pollution noise pollution land pollution
Air pollution soli pollution water pollution noise pollution land pollutionrgxv72jrgc
 
885MTAMount DMU University Bachelor's Diploma in Education
885MTAMount DMU University Bachelor's Diploma in Education885MTAMount DMU University Bachelor's Diploma in Education
885MTAMount DMU University Bachelor's Diploma in Educationz xss
 
Call Girls South Delhi Delhi reach out to us at ☎ 9711199012
Call Girls South Delhi Delhi reach out to us at ☎ 9711199012Call Girls South Delhi Delhi reach out to us at ☎ 9711199012
Call Girls South Delhi Delhi reach out to us at ☎ 9711199012sapnasaifi408
 
Dwarka Call Girls 9643097474 Phone Number 24x7 Best Services
Dwarka Call Girls 9643097474 Phone Number 24x7 Best ServicesDwarka Call Girls 9643097474 Phone Number 24x7 Best Services
Dwarka Call Girls 9643097474 Phone Number 24x7 Best Servicesnajka9823
 
Private Escorts Aliganj \ 9548273370 Indian Call Girls Service Lucknow ₹,9527
Private Escorts Aliganj \ 9548273370 Indian Call Girls Service Lucknow ₹,9527Private Escorts Aliganj \ 9548273370 Indian Call Girls Service Lucknow ₹,9527
Private Escorts Aliganj \ 9548273370 Indian Call Girls Service Lucknow ₹,9527nagunakhan
 
5 Wondrous Places You Should Visit at Least Once in Your Lifetime (1).pdf
5 Wondrous Places You Should Visit at Least Once in Your Lifetime (1).pdf5 Wondrous Places You Should Visit at Least Once in Your Lifetime (1).pdf
5 Wondrous Places You Should Visit at Least Once in Your Lifetime (1).pdfsrivastavaakshat51
 
VIP Kolkata Call Girl Kalighat 👉 8250192130 Available With Room
VIP Kolkata Call Girl Kalighat 👉 8250192130  Available With RoomVIP Kolkata Call Girl Kalighat 👉 8250192130  Available With Room
VIP Kolkata Call Girl Kalighat 👉 8250192130 Available With Roomdivyansh0kumar0
 
Abu Dhabi Sea Beach Visitor Community pp
Abu Dhabi Sea Beach Visitor Community ppAbu Dhabi Sea Beach Visitor Community pp
Abu Dhabi Sea Beach Visitor Community pp202215407
 
Determination of antibacterial activity of various broad spectrum antibiotics...
Determination of antibacterial activity of various broad spectrum antibiotics...Determination of antibacterial activity of various broad spectrum antibiotics...
Determination of antibacterial activity of various broad spectrum antibiotics...Open Access Research Paper
 
9873940964 High Profile Call Girls Delhi |Defence Colony ( MAYA CHOPRA ) DE...
9873940964 High Profile  Call Girls  Delhi |Defence Colony ( MAYA CHOPRA ) DE...9873940964 High Profile  Call Girls  Delhi |Defence Colony ( MAYA CHOPRA ) DE...
9873940964 High Profile Call Girls Delhi |Defence Colony ( MAYA CHOPRA ) DE...Delhi Escorts
 
原版1:1复刻塔夫斯大学毕业证Tufts毕业证留信学历认证
原版1:1复刻塔夫斯大学毕业证Tufts毕业证留信学历认证原版1:1复刻塔夫斯大学毕业证Tufts毕业证留信学历认证
原版1:1复刻塔夫斯大学毕业证Tufts毕业证留信学历认证jdkhjh
 
原版定制copy澳洲詹姆斯库克大学毕业证JCU毕业证成绩单留信学历认证保障质量
原版定制copy澳洲詹姆斯库克大学毕业证JCU毕业证成绩单留信学历认证保障质量原版定制copy澳洲詹姆斯库克大学毕业证JCU毕业证成绩单留信学历认证保障质量
原版定制copy澳洲詹姆斯库克大学毕业证JCU毕业证成绩单留信学历认证保障质量sehgh15heh
 

Recently uploaded (20)

Unit 1 - introduction to environmental studies.pdf
Unit 1 - introduction to environmental studies.pdfUnit 1 - introduction to environmental studies.pdf
Unit 1 - introduction to environmental studies.pdf
 
Delivering nature-based solution outcomes by addressing policy, institutiona...
Delivering nature-based solution outcomes by addressing  policy, institutiona...Delivering nature-based solution outcomes by addressing  policy, institutiona...
Delivering nature-based solution outcomes by addressing policy, institutiona...
 
See How do animals kill their prey for food
See How do animals kill their prey for foodSee How do animals kill their prey for food
See How do animals kill their prey for food
 
AI and Ecology - The H4rmony Project.pptx
AI and Ecology - The H4rmony Project.pptxAI and Ecology - The H4rmony Project.pptx
AI and Ecology - The H4rmony Project.pptx
 
Call Girls Abids 7001305949 all area service COD available Any Time
Call Girls Abids 7001305949 all area service COD available Any TimeCall Girls Abids 7001305949 all area service COD available Any Time
Call Girls Abids 7001305949 all area service COD available Any Time
 
EARTH DAY Slide show EARTHDAY.ORG is unwavering in our commitment to end plas...
EARTH DAY Slide show EARTHDAY.ORG is unwavering in our commitment to end plas...EARTH DAY Slide show EARTHDAY.ORG is unwavering in our commitment to end plas...
EARTH DAY Slide show EARTHDAY.ORG is unwavering in our commitment to end plas...
 
Environmental and Social Impact Assessment
Environmental and Social Impact AssessmentEnvironmental and Social Impact Assessment
Environmental and Social Impact Assessment
 
Air pollution soli pollution water pollution noise pollution land pollution
Air pollution soli pollution water pollution noise pollution land pollutionAir pollution soli pollution water pollution noise pollution land pollution
Air pollution soli pollution water pollution noise pollution land pollution
 
885MTAMount DMU University Bachelor's Diploma in Education
885MTAMount DMU University Bachelor's Diploma in Education885MTAMount DMU University Bachelor's Diploma in Education
885MTAMount DMU University Bachelor's Diploma in Education
 
Call Girls South Delhi Delhi reach out to us at ☎ 9711199012
Call Girls South Delhi Delhi reach out to us at ☎ 9711199012Call Girls South Delhi Delhi reach out to us at ☎ 9711199012
Call Girls South Delhi Delhi reach out to us at ☎ 9711199012
 
Dwarka Call Girls 9643097474 Phone Number 24x7 Best Services
Dwarka Call Girls 9643097474 Phone Number 24x7 Best ServicesDwarka Call Girls 9643097474 Phone Number 24x7 Best Services
Dwarka Call Girls 9643097474 Phone Number 24x7 Best Services
 
Private Escorts Aliganj \ 9548273370 Indian Call Girls Service Lucknow ₹,9527
Private Escorts Aliganj \ 9548273370 Indian Call Girls Service Lucknow ₹,9527Private Escorts Aliganj \ 9548273370 Indian Call Girls Service Lucknow ₹,9527
Private Escorts Aliganj \ 9548273370 Indian Call Girls Service Lucknow ₹,9527
 
5 Wondrous Places You Should Visit at Least Once in Your Lifetime (1).pdf
5 Wondrous Places You Should Visit at Least Once in Your Lifetime (1).pdf5 Wondrous Places You Should Visit at Least Once in Your Lifetime (1).pdf
5 Wondrous Places You Should Visit at Least Once in Your Lifetime (1).pdf
 
VIP Kolkata Call Girl Kalighat 👉 8250192130 Available With Room
VIP Kolkata Call Girl Kalighat 👉 8250192130  Available With RoomVIP Kolkata Call Girl Kalighat 👉 8250192130  Available With Room
VIP Kolkata Call Girl Kalighat 👉 8250192130 Available With Room
 
Abu Dhabi Sea Beach Visitor Community pp
Abu Dhabi Sea Beach Visitor Community ppAbu Dhabi Sea Beach Visitor Community pp
Abu Dhabi Sea Beach Visitor Community pp
 
Determination of antibacterial activity of various broad spectrum antibiotics...
Determination of antibacterial activity of various broad spectrum antibiotics...Determination of antibacterial activity of various broad spectrum antibiotics...
Determination of antibacterial activity of various broad spectrum antibiotics...
 
9873940964 High Profile Call Girls Delhi |Defence Colony ( MAYA CHOPRA ) DE...
9873940964 High Profile  Call Girls  Delhi |Defence Colony ( MAYA CHOPRA ) DE...9873940964 High Profile  Call Girls  Delhi |Defence Colony ( MAYA CHOPRA ) DE...
9873940964 High Profile Call Girls Delhi |Defence Colony ( MAYA CHOPRA ) DE...
 
Hot Sexy call girls in Nehru Place, 🔝 9953056974 🔝 escort Service
Hot Sexy call girls in Nehru Place, 🔝 9953056974 🔝 escort ServiceHot Sexy call girls in Nehru Place, 🔝 9953056974 🔝 escort Service
Hot Sexy call girls in Nehru Place, 🔝 9953056974 🔝 escort Service
 
原版1:1复刻塔夫斯大学毕业证Tufts毕业证留信学历认证
原版1:1复刻塔夫斯大学毕业证Tufts毕业证留信学历认证原版1:1复刻塔夫斯大学毕业证Tufts毕业证留信学历认证
原版1:1复刻塔夫斯大学毕业证Tufts毕业证留信学历认证
 
原版定制copy澳洲詹姆斯库克大学毕业证JCU毕业证成绩单留信学历认证保障质量
原版定制copy澳洲詹姆斯库克大学毕业证JCU毕业证成绩单留信学历认证保障质量原版定制copy澳洲詹姆斯库克大学毕业证JCU毕业证成绩单留信学历认证保障质量
原版定制copy澳洲詹姆斯库克大学毕业证JCU毕业证成绩单留信学历认证保障质量
 

Emission Statement - Issue 6 - Markets

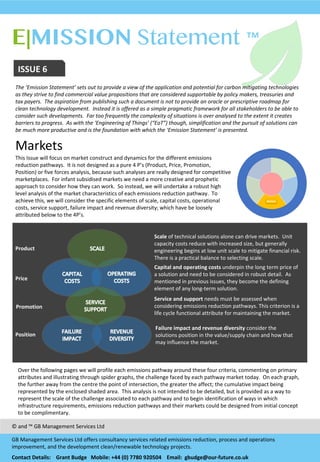
  • 1. E|MISSION Statement ™ EMAIL enquiries@our- future.co.uk ISSUE  6 The  ‘Emission  Statement’  sets  out  to  provide  a  view  of  the  application  and  potential  for  carbon  mitigating  technologies   as  they  strive  to  find  commercial  value  propositions  that  are  considered  supportable  by  policy  makers,  treasuries  and   tax  payers.    The  aspiration  from  publishing  such  a  document  is  not  to  provide  an  oracle  or  prescriptive  roadmap  for   clean  technology  development.    Instead  it  is  offered  as  a  simple  pragmatic  framework  for  all  stakeholders  to  be  able  to   consider  such  developments.    Far  too  frequently  the  complexity  of  situations  is  over  analysed  to  the  extent  it  creates   barriers  to  progress.    As  with  the  ‘Engineering  of  Things’  (“EoT”)  though,  simplification  and  the  pursuit  of  solutions  can   be  much  more  productive  and  is  the  foundation  with  which  the  ‘Emission  Statement’  is  presented. Markets This  Issue  will  focus  on  market  construct  and  dynamics  for  the  different  emissions   reduction  pathways.    It  is  not  designed  as  a  pure  4  P’s  (Product,  Price,  Promotion,   Position)  or  five  forces  analysis,  because  such  analyses  are  really  designed  for  competitive   marketplaces.    For  infant  subsidised  markets  we  need  a  more  creative  and  prophetic   approach  to  consider  how  they  can  work.    So  instead,  we  will  undertake  a  robust  high   level  analysis  of  the  market  characteristics  of  each  emissions  reduction  pathway.    To   achieve  this,  we  will  consider  the  specific  elements  of  scale,  capital  costs,  operational   costs,  service  support,  failure  impact  and  revenue  diversity;  which  have  be  loosely   attributed  below  to  the  4P’s. ©  and  ™  GB  Management  Services  Ltd GB  Management  Services  Ltd  offers  consultancy  services  related  emissions  reduction,  process  and  operations   improvement,  and  the  development  clean/renewable  technology  projects.   Contact  Details:        Grant  Budge      Mobile:  +44  (0)  7780  920504 Email:    gbudge@our-­‐future.co.uk Scale of  technical  solutions  alone  can  drive  markets.    Unit   capacity  costs  reduce  with  increased  size,  but  generally   engineering  begins  at  low  unit  scale  to  mitigate  financial  risk.     There  is  a  practical  balance  to  selecting  scale. Product Price Promotion Position Capital  and  operating  costs  underpin  the  long  term  price  of   a  solution  and  need  to  be  considered  in  robust  detail.    As   mentioned  in  previous  issues,  they  become  the  defining   element  of  any  long-­‐term  solution. Service  and  support  needs  must  be  assessed  when   considering  emissions  reduction  pathways.  This  criterion  is  a   life  cycle  functional  attribute  for  maintaining  the  market.     Failure  impact  and  revenue  diversity  consider  the   solutions  position  in  the  value/supply  chain  and  how  that   may  influence  the  market.     Over  the  following  pages  we  will  profile  each  emissions  pathway  around  these  four  criteria,  commenting  on  primary   attributes  and  illustrating  through  spider  graphs,  the  challenge  faced  by  each  pathway  market  today.    On  each  graph,   the  further  away  from  the  centre  the  point  of  intersection,  the  greater  the  affect; the  cumulative  impact  being   represented  by  the  enclosed  shaded  area.    This  analysis  is  not  intended  to  be  detailed,  but  is  provided  as  a  way  to   represent  the  scale  of  the  challenge  associated  to  each  pathway  and  to  begin  identification  of  ways  in  which   infrastructure  requirements,  emissions  reduction  pathways  and  their  markets  could  be  designed  from  initial  concept   to  be  complimentary.   Risk Management Markets
  • 2. ©  GB  Management  Services  Ltd Contact  Details:        Grant  Budge      Mobile:  +44  (0)  7780  920504 Email:    gbudge@our-­‐future.co.uk E|MISSION Statement ™ Scale of  Source  Substitution  ranges  from  kW  household   installations  through  to  national  generation  infrastructure.     As  a  consequence  of  the  range  of  installation  scale,  the  absolute   capital  and  operating  costs  are  equally  all  encompassing;  but   with  reducing  unit  costs  of  installed  energy  capacity   demonstrating  economies  of  scale  with  every  order  of   magnitude  increase  in  size.         While  the  range  of  solutions  could  push  the  service  support   needs;  requiring  competence  and  systems  to  be  available  for  the   complete  range  of  sized  assets;  there  is  overlap  in  the   competence  and  resource  requirements  between  the   installation  sizes,  allowing  skills  transferability  and  systems   synergies  to  constrain  the  extent  of  the  challenge. With  regard  to  impact  of  unit  failure,  being  an  established   market  with  supply  system  redundancy,  this  should  be   negligible.    For  the  same  reason,  revenue  diversity  is  limited.     Demand  Reduction Scale of  Demand  Reduction  technologies  is  firmly  in  the  Watt   (“W”)  unit  scale.    Real  change  comes  from  cumulative  sales. Absolute  capital  costs  and  operating  costs  per  installation   when  considered  against  the  follow-­‐on  technology  categories  is   very  low  (i.e.  £100’s). From  a  service  support  perspective,  being  mass  market  with   millions  of  end  users,  they  require  extensive  supply  chains  to   deliver  and  provide  the  follow-­‐on  support  to  the  consumer. From  an  environment  and  market  level,  unit  failure  has  little   demonstrable  impact  on  system  performance;  and  from  a   supplier  perspective  the  products  are  single  CADS  products   designed  for  individual/household  consumers,  with  little  to  no   revenue  diversity  beyond  the  sale  and  support  framework.   CADS  technologies  range  from  light  bulbs  to  cavity  wall  insulation.    They  have  been  driven  by  legislation  for  the   publication  of  energy  efficiency  ratings  and  the  promise  of  being  self-­‐financing  (the  future  reduction  in  energy   consumption  repaying  the  capital  costs  within  3  to  5  years).    These  are  mass  markets  and  to  date  have  evolved   predominantly  with  the  direct  (i.e.  incentives)  and  indirect  (i.e.  policy)  State  sponsorship.    But  as  a  market  in  the  context   of  emissions  reductions  they  rank  as  follows. Source  Substitution  is  a  holistic  consumer  segmented  market  delivering  through-­‐out  the  energy  supply  chain,  but  what   these  technologies  don’t  need  is  additional  distribution  or  transmission  infrastructure.  They  are  supplying  established   marketplaces  and  it  is  this  prevailing  and  accepted  market  structure  that  exposes  the  true  costs  of  introducing  low   emissions  energy  (i.e.  ROC’s,  CfD’s). Source  Substitution Demand  Reduction  is  the  simplest  of  pathways,  only  having  a  slightly  elevated  challenge  profile  for  service  support   because  of  the  maintenance,  distribution,  retail,  wholesale  and  manufacture  system  that  sits  behind  it;  albeit  that  for   the  most  part,  these  services  already  exist  and  are  simply  being  redefined. Source  Substitution  is  the  modular  restructuring  of  an  existing  system,  which  only  provides  a  high  challenge  upon  initial   scaling  and  associated  funding.    In  the  long  term,  both  scale  and  cost  challenges  will  reduce  for  Source  Substitution   pathways,  as  they  have  over  the  past  two  decades  for  solar  and  wind. SCALE SERVICE COSTS IMPACT SCALE SERVICE COSTS IMPACT
  • 3. ©  GB  Management  Services  Ltd Contact  Details:        Grant  Budge      Mobile:  +44  (0)  7780  920504 Email:    gbudge@our-­‐future.co.uk E|MISSION Statement ™ Demand  Substitution Scale of  Demand  Substitution  ranges  from  W  to  kW  household   and  business  installations.    They  do  not  necessarily  require   significant  new  infrastructure  and  infrastructure  required  can  be   decentralised  if  economical  to  do  so.     The  absolute  capital  and  operating  costs  are  relatively  low  at  an   installation  level,  but  are  high  from  a  unit  of  energy  output     perspective  compared  to  their  historical  equivalent.         The  range  of  CADS  products  in  Demand  Substitution  pushes  the   service  support  needs;  requiring  competence  to  be  available   across  a  diverse  portfolio  with  little  overlap  in  skills  from  one   technology  to  another.    Support  infrastructure  (PAPS)   management  is  less  demanding  and  for  the  most  part  reinforcing   of  existing  services.   With  regard  to  impact  of  unit  failure,  Demand  Substitution Demand  Substitution  are  predominantly  CADS  driven  markets  (i.e.  heat  electrification,  EV,  fuel  cell  and  hydrogen   grid)  that  require  some  but  not  extensive  additional  PAPS,  distribution  and  transmissions  capability.     Source  Mitigation The  scale  of  these  assets  covers  the  mid-­‐range  of  KW  to  MW   business  and  process  energy  driven  solutions. Capital  and  operating  costs  replicate  scale  and  represent  a   mid-­‐range  challenge,  but  economies  of  scale  will  yield  a   lower  unit  cost.   Service  support needs  are  generally  considered  bespoke  and   decentralised,  but  through  strategic  State  level  planning   some  could  be  common  (i.e.  hydrogen  grid).             Impact  of  failure  is  low.    From  an  industrial  perspective  raw   material  and  product  buffer  stocks  exist  within  the  supply   chain  to  absorb  any  issues;  and  from  a  power  perspective   redundant  capacity  absorb  any  individual  failure.    There  is   limited  revenue  diversity  with  each  system  delivering  a   specific  product.         Source  Mitigation  is  a  business  level  intervention  that  requires  a  shift  in  business  behaviour  and  which  significantly   impacts  on  the  energy  supply  chain.     being  predominantly  consumer  level,  small  and  modular  in  design,  failure  of  a  product has  little  impact  and  is   manageable.    For  the  PAPS  supply  infrastructure,  electricity  and  gas  systems  have  embedded  redundancy  to   compensate  and  manage  individual  system  failures.    Demand  Substitution  also  has  limited  revenue  diversity.     Demand  Substitution  can  be  seen  to  be  relatively  modest  on  the  scale,  cost  and  impact  axes,  but  due  predominantly   to  the  potential  for  hydrogen  as  a  heat  and  mobility  fuel  substitute,  begins  to  impose  greater  service  and  impact  of   failure  risks  on  the  market. Source  Mitigation  represents  a  cost  and  scale  challenge.    But  while  there  is  a  lower  identified  challenge  related  to   service  and  impact    of  failure,  these    Source  Mitigations  require  new  supply  chains  which  must  be  created  and   managed  (i.e.  biomass,  biofuel  etc).     SCALE SERVICE COSTS IMPACT SCALE SERVICE COSTS IMPACT
  • 4. ©  GB  Management  Services  Ltd Contact  Details:        Grant  Budge      Mobile:  +44  (0)  7780  920504 Email:    gbudge@our-­‐future.co.uk E|MISSION Statement ™ Demand  Reduction  and  Source  Substitution  are  predominantly  either:  decentralised markets,  as  with  energy  efficient   household  products  and  residential/community  energy  production  systems  (i.e.  solar)  or  feed  into  established  mature   markets.    They  are  to  a  large  extent  market  ‘reworking’  and  as  such,  from  a  market  performance  perspective  across   the  redefined  metrics  (i.e.  product,  price,  promotion,  position),  their  market  and  associated  environmental  impact  is   incremental,  contained  and  relatively  simple.    The  same  cannot  be  said  for  the  latter  three  emissions  reduction  stages.           We  have  stated  before  that  there  can  be  synergies  from  an  integrated  solution  for  Demand  Substitution,  Source   Mitigation  and  Source  Containment,  and  to  demonstrate  this  we  illustrate  three  market  “infrastructure”  models  that   could  be  progressed.    They  are  ‘Generic’,  ‘Bespoke’  and  ‘Tailored’;  and  they  are  defined  below  and  illustrated  on  the   next  page. A  Generic  Model.  This  is  a  base  case  Source  Containment  design  where  all  independent  power  utilities  and  process   industries  make  their  own  technology/project  decisions  (i.e.  pre  or  post  combustion)  and  investment  cases.    Under  this   scenario,  the  guaranteed  cost  of  carbon  deliverable  needs  to  be  high  to  support  investment;  and  certainty  over  fuel   and  power  forecasting  needs  to  be  strong  to  allow  investment  cases  to  be  made.    In  general,  this  market  will  progress   slowly,  will  require  complex  administration  for  the  supply  of  State  funding,  will  require  early  stage  Policy  to  support   private  investment  decisions  and  can  lead  to  the  embedding  of  redundant  plant  costs  into  the  market  pricing.   A  Bespoke  Model.  This  is  where  independent  power  utilities  and  process  industries  make  their  own  decisions  based  on   standalone  pre-­‐combustion  capture  assets  combined  with  gas  power  islands  (CCGT),  to  develop  hydrogen  revenue  and   potentially  low  volume  carbon  dioxide  utilisation.  First  mover  advantage  (or  State  geographic  bias  as  proposed  in  Issue   5)  will  enhance  load  factors  for  a  smaller  number  of  assets,  aiding  project  finance,  and  modestly  reducing  the  costs  of   CO2 transport  and  storage  (i.e.  fewer  site  connections,  reduced  control  complexity  and  reduced  national   infrastructure).    This  market  will  progress  slightly  quicker;  will  require  less  complex  administration  for  the  supply  of   State  funding;  if  openly  endorsed  as  ‘low  emissions  development  regions’  will  require  less  Policy  to  support  private   investment  decisions;  will  lead  to  the  embedding  of  limited  redundant  plant  costs  into  the  market  pricing;  and  will   retain  some  freedom  for  technology  vendor  selection.   A  Tailored  Model. This  is  where  independent  power  utilities  and  process  industries  build  own  and  operate  their  own   assets  around  a  State  defined  geographic  location;  and  contract  with  a  centralised hydrogen  generation  plant  or  local   biomass/biofuel  supply  chain.    Here  the  businesses  can  still  be  in  control  of  commodity  procurement  (retaining  a   competitive  market),  providing  raw  fuels  to  the  central  facility  and  taking  hydrogen  under  a  tolling  agreement.    The   Technology  Design  of  the  central  unit  or  bio-­‐supply  network  becomes  key  here.    The  central  operation  doesn’t  have  to   be  under  single  ownership  or  a  single  technology,  it  can  simply  be  a  State  location  determined  for  infrastructure   development.    This  would  retain  technology  and  supplier  competition,  but  at  the  same  time  would  simplify  associated   infrastructure  needs.   Optimising the  Source  Containment  Proposition Source  Containment Source  Containment  is  the  simplest  market  to   characterise  because  it  deals  with  an  issue  that  all   other  pathways  have  failed  to  achieve.    For  emissions   reductions,  these  interventions  are  at  +MW  scale,   initially  require  separation  of  the  problem  and  then   treatment  of  the  problem  whether  by  storage  of  re-­‐ purposing.  Costs  are  high,  system  support  needs  are   high  to  maintain  operational  capacity,  risk  of  system   failure  is  high  and  potential  market  diversity  is  high.   Pictorially,  the  profile  of  all  attributes  is  identical.   It  is  clear  from  the  spider  graph  that  Source   Containment  represents  the  greatest  challenge  for   delivery.  But  it  is  also  true  that  the  development  of   this  market  is  inevitable  if  emissions  targets  up  to   2050  are  to  be  attained. SCALE SERVICE COSTS IMPACT
  • 5. ©  GB  Management  Services  Ltd Contact  Details:        Grant  Budge      Mobile:  +44  (0)  7780  920504 Email:    gbudge@our-­‐future.co.uk E|MISSION Statement ™ CCUS  Strategic  Gas   Power  Station CCUS  Strategic  Gas   Power  Station 1  GWt Capacity 60%  Load  Factor 4GWt CO2 Store CCUS  Gas  Power Station CCUS  Gas  Power Station 5GWt CO2  Store CCUS  Gas  Power Station CCUS  Industrial Process CCUS  Industrial Process 1  GWt Capacity 70%  Load  Factor 1  GWt Capacity 40%  Load  Factor 1  GWt Capacity 40%  Load  Factor 1GWt  Capacity 70%  Load  Factor 1  GWt Capacity 40%  Load  Factor 1  GWt Capacity 60%  Load  Factor 1  GWt Capacity 70%  Load  Factor 2.6GWt CO2Store2.6  GWt Carbon  Capture Gas  Power   Station 1  GW  Capacity 60%  Load  Factor CCUS  Industrial Process 1  GWt Capacity 70%  Load  Factor CCUS  Industrial Process 1  GW  Capacity 60%  Load  Factor 1  GWt Capacity 70%  Load  Factor Industrial Process 1  GWt Capacity 70%  Load  Factor Industrial Process Gas  Power   Station Cluster  CO2   Utilisation H2   Grid H2 H2 H2 H2 H2 H2 H2 H2 H2 CO2 Utilisation CO2 Utilisation CO2 Utilisation CO2 Utilisation H2 CO2 Utilisation H2 H2 CO2 Utilisation CO2 Utilisation Generic  System Bespoke  System Tailored  System
  • 6. ©  GB  Management  Services  Ltd Contact  Details:        Grant  Budge      Mobile:  +44  (0)  7780  920504 Email:    gbudge@our-­‐future.co.uk E|MISSION Statement ™ The  below  assessment  utilises the  infrastructure  models  illustrated  on  the  previous  page  and  considers  how  they  could   impact  on  the  delivery  of  a  market  for  Source  Containment.    For  simplicity  and  quantification  of  the  benefits  the   following  terms  of  reference  have  been  used: • Cost  of  1GWt  of  capacity  taken  as  £1  Billion  for  each  discrete  process/unit  (i.e.  Power,  Industrial,  Carbon  Capture,   Transport  and  Storage)  Capital  costs  reduce  25%  per  100%  increase  in  unit  level  installation  capacity • Cost  of  operation  of  1GWt  capacity  taken  at  £0.1  Billion  per  annum  at  40%  utilisation/load  factor • Unit  operating  costs  reduce  5%  per  10%  increase  in  utilisation rate • Cost  of  hydrogen  and  CO2 pipelines  to  and  from  site  assumed  to  be  negligible • Common  CCS  capacity  taken  at  potential  peak  load  rate  of  installed  source  units • 1GWt  of  capacity  treated  as  an  operational  ‘node’ • Failure  impact  has  been  treated  as  uniform  for  all  models,  because  this  can  be  controlled  under  all  strategies   through  redundancy  and  modular  design. • Assumption  that  pre-­‐combustion  technology  is  the  core  technology  for  Bespoke  and  Tailored  Systems • Revenue  Diversity  has  been  assessed  based  on  a  %  increase  in  the  value  proposition,  pro-­‐rata  with  a  reduction  in   number  of  market  entry  points;  due  to  the  reduced  price  of  services  supporting  greater  market  diversity. • Scores  illustrated  as  relative  to  ‘Generic’  template  (base  case),  which  is  taken  as  indexed  at  100% Impact  of  an  Optimised Source  Containment  Proposition GENERIC   SYSTEM BESPOKE   SYSTEM TAILORED   SYSTEM Scale  /  Size 100% 80% 59% Capital  Costs 100% 80% 68% Operating  Costs 100% 80% 61% Service  Support 100% 80% 61% Failure  Impact 100% 100% 100% Revenue  Diversity 100% 80% 35% What  the  analysis  shows,  is  that  the   challenge  against  each  of  the   criterion  can  be  reduced     significantly  as  we  pursue  a  design   concept  based  on  an  integrated   solution,  rather  than  a  first  past  the   post  approach.    This  reduction  is   illustrated  below  in  spider  graph   form,  for  the  Bespoke  and  Tailored   solutions  (Generic  having  been   illustrated  already  under  Source   containment  section  earlier).     SCALE SERVICE COSTS IMPACT Tailored System SCALE SERVICE COSTS IMPACT Bespoke System