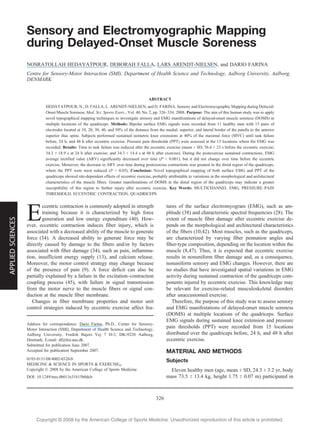
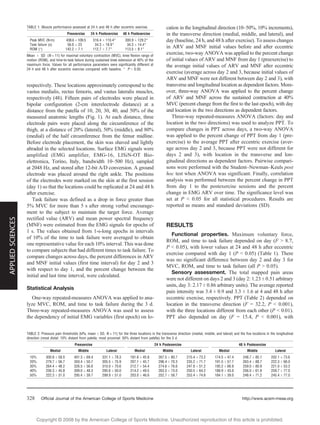
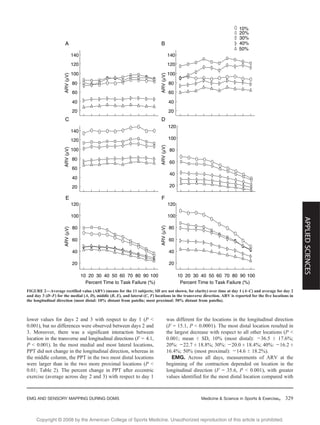
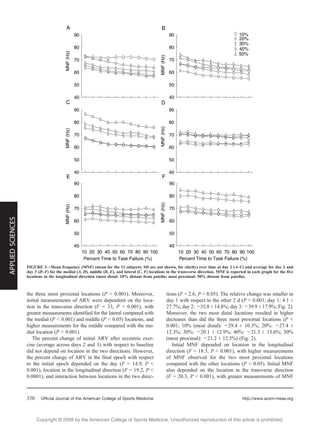
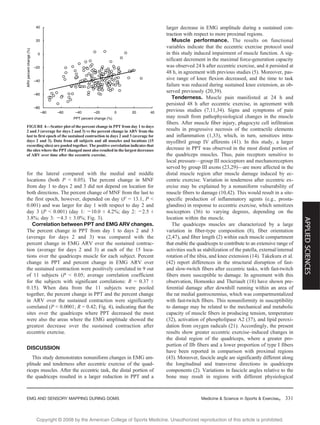
This study investigated changes in sensory and electromyography (EMG) measurements over different regions of the quadriceps muscle before and after eccentric exercise intended to induce delayed-onset muscle soreness (DOMS). Surface EMG signals and pressure pain thresholds were measured at 15 locations on the quadriceps during sustained isometric contractions and at rest. After eccentric exercise, time to failure during contractions, EMG amplitude, and pain thresholds all decreased significantly and were lowest in the distal region of the quadriceps. This suggests DOMS manifestations vary by muscle region, likely due to differences in fiber morphology and architecture. The distal quadriceps may be more susceptible to further injury after eccentric exercise.
2. Copyright @ 200 by the American College of Sports Medicine. Unauthorized reproduction of this article is prohibited.8
Sensory and Electromyographic Mapping
during Delayed-Onset Muscle Soreness
NOSRATOLLAH HEDAYATPOUR, DEBORAH FALLA, LARS ARENDT-NIELSEN, and DARIO FARINA
Centre for Sensory-Motor Interaction (SMI), Department of Health Science and Technology, Aalborg University, Aalborg,
DENMARK
ABSTRACT
HEDAYATPOUR, N., D. FALLA, L. ARENDT-NIELSEN, and D. FARINA. Sensory and Electromyographic Mapping during Delayed-
Onset Muscle Soreness. Med. Sci. Sports Exerc., Vol. 40, No. 2, pp. 326–334, 2008. Purpose: The aim of this human study was to apply
novel topographical mapping techniques to investigate sensory and EMG manifestations of delayed-onset muscle soreness (DOMS) in
multiple locations of the quadriceps. Methods: Bipolar surface EMG signals were recorded from 11 healthy men with 15 pairs of
electrodes located at 10, 20, 30, 40, and 50% of the distance from the medial, superior, and lateral border of the patella to the anterior
superior iliac spine. Subjects performed sustained isometric knee extensions at 40% of the maximal force (MVC) until task failure
before, 24 h, and 48 h after eccentric exercise. Pressure pain thresholds (PPT) were assessed at the 15 locations where the EMG was
recorded. Results: Time to task failure was reduced after the eccentric exercise (mean T SD, 56.6 T 23 s before the eccentric exercise;
34.3 T 18.9 s at 24 h after exercise; and 34.3 T 14.4 s at 48 h after exercise). During the postexercise sustained contractions, EMG
average rectified value (ARV) significantly decreased over time (P G 0.001), but it did not change over time before the eccentric
exercise. Moreover, the decrease in ARV over time during postexercise contractions was greatest in the distal region of the quadriceps,
where the PPT were most reduced (P G 0.05). Conclusion: Novel topographical mapping of both surface EMG and PPT of the
quadriceps showed site-dependent effects of eccentric exercise, probably attributable to variations in the morphological and architectural
characteristics of the muscle fibers. Greater manifestations of DOMS in the distal region of the quadriceps may indicate a greater
susceptibility of this region to further injury after eccentric exercise. Key Words: MULTICHANNEL EMG, PRESSURE–PAIN
THRESHOLD, ECCENTRIC CONTRACTION, QUADRICEPS
E
ccentric contraction is commonly adopted in strength
training because it is characterized by high force
generation and low energy expenditure (40). How-
ever, eccentric contraction induces fiber injury, which is
associated with a decreased ability of the muscle to generate
force (34). A decreased ability to generate force may be
directly caused by damage to the fibers and/or by factors
associated with fiber damage (34), such as pain, inflamma-
tion, insufficient energy supply (13), and calcium release.
Moreover, the motor control strategy may change because
of the presence of pain (9). A force deficit can also be
partially explained by a failure in the excitation–contraction
coupling process (45), with failure in signal transmission
from the motor nerve to the muscle fibers or signal con-
duction at the muscle fiber membrane.
Changes in fiber membrane properties and motor unit
control strategies induced by eccentric exercise affect fea-
tures of the surface electromyogram (EMG), such as am-
plitude (38) and characteristic spectral frequencies (28). The
extent of muscle fiber damage after eccentric exercise de-
pends on the morphological and architectural characteristics
of the fibers (10,42). Most muscles, such as the quadriceps,
are characterized by varying fiber pennation angles and
fiber-type composition, depending on the location within the
muscle (8,47). Thus, it is expected that eccentric exercise
results in nonuniform fiber damage and, as a consequence,
nonuniform sensory and EMG changes. However, there are
no studies that have investigated spatial variations in EMG
activity during sustained contraction of the quadriceps com-
ponents injured by eccentric exercise. This knowledge may
be relevant for exercise-related musculoskeletal disorders
after unaccustomed exercise.
Therefore, the purpose of this study was to assess sensory
and EMG manifestations of delayed-onset muscle soreness
(DOMS) at multiple locations of the quadriceps. Surface
EMG signals during sustained knee extension and pressure
pain thresholds (PPT) were recorded from 15 locations
distributed over the quadriceps before, 24 h, and 48 h after
eccentric exercise.
MATERIAL AND METHODS
Subjects
Eleven healthy men (age, mean T SD, 24.3 T 3.2 yr, body
mass 73.5 T 13.4 kg, height 1.75 T 0.07 m) participated in
Address for correspondence: Dario Farina, Ph.D., Center for Sensory-
Motor Interaction (SMI), Department of Health Science and Technology,
Aalborg University, Fredrik Bajers Vej 7 D-3, DK-9220 Aalborg,
Denmark; E-mail: df@hst.aau.dk.
Submitted for publication June 2007.
Accepted for publication September 2007.
0195-9131/08/4002-0326/0
MEDICINE & SCIENCE IN SPORTS & EXERCISEÒ
Copyright Ó 2008 by the American College of Sports Medicine
DOI: 10.1249/mss.0b013e31815b0dcb
326
APPLIEDSCIENCES
3. Copyright @ 200 by the American College of Sports Medicine. Unauthorized reproduction of this article is prohibited.8
the study. All subjects were right leg dominant. The study was
conducted in accordance with the Declaration of Helsinki and
approved by the local ethics committee (N-20070019).
Subjects provided informed written consent before participa-
tion in the study.
Eccentric Exercise
Maximal voluntary contraction (MVC) force, PPT, sub-
jective pain ratings, passive knee flexion range of motion
(ROM), EMG variables, and time to task failure for a 40%
MVC isometric contraction, were recorded, as described
below, before (day 1), 24 h (day 2), and 48 h (day 3) after
eccentric exercise.
The eccentric exercise was performed with a KinCom
Isokinetic Dynamometer (Chattanooga, TN) and consisted
of four bouts of 25 maximum voluntary concentric/
eccentric knee extension contractions at a speed of 60-Isj1
between 90 and 170- of knee extension, with 3 min of rest
between each set. During the exercise, the subject was pro-
vided with visual feedback of force and was encouraged to
maintain maximal force.
Maximal voluntary force. Maximal voluntary iso-
metric contraction force (MVC) was measured using the
KinCom Dynamometer. The subject was seated comfort-
ably on the adjustable chair of the KinCom with the hip in
90- flexion. The chair position was modified until the knee
axis of rotation (tibiofemoral joint) was aligned with the
axis of rotation of the dynamometer_s attachment arm. The
subject was fixed with straps secured across the chest and
hips. The right leg was secured to the attachment arm in 90-
knee flexion with a Velcro strap. Visual feedback of force
was provided on a screen positioned in front of the subject.
The subject was asked to perform three maximal isometric
knee extensions (3–5 s in duration) in 90- knee flexion,
with 2 min of rest between, and verbal encouragement to
exceed the previous force level. The highest MVC value
was used as a reference for the definition of the submaximal
force level. The submaximal forces were relative to the
MVC measured on the same day of the test.
Sensory assessment. A 10-cm visual analog scale
(VAS), labeled with end points on the left (no pain) and
right (worst pain imaginable), was used to assess the per-
ceived pain intensity at 24 and 48 h after eccentric exercise.
The subjects were asked to rate the average pain intensity in
the quadriceps during their regular activities of daily living
(e.g., climbing stairs) since their last visit to the laboratory
(during the past 24 h). Participants were also asked to docu-
ment the area of pain on a body chart. Pain drawings were
subsequently digitized (ACECAD D9000+ Taiwan), and
pain areas were estimated in arbitrary units for comparison
among days. The total mapped pain area was the sum of all
pain areas reported by the subject on the body chart.
PPT were assessed using a pressure algometer at an ap-
plication rate of 40 kPaIsj1
(Somedic, Sweden) at the
15 locations where the EMG electrodes were placed. The
PPT was defined as the minimum pressure (kPa) that
induced pain. The algometer consisted of a 1-cm2
rubber
tip plunger, mounted on a force transducer. Measure-
ments of PPT were performed twice for each location in
random order and were averaged for data analysis. In
addition, the percent difference in PPT for day 2 and day 3
with respect to day 1 was calculated, to compare changes
across days.
Passive range of motion. The passive range of knee
flexion was measured with a goniometer, with the fulcrum
centered over the lateral femoral epicondyle (35). The sub-
ject was in prone position, with the hip in 0- abduction, flex-
ion, rotation, and extension (35), and the knee was passively
moved from full extension (considered as the reference 0-) to
flexion until the participant reported the onset of pain. Mea-
surements were performed twice for each subject and were
averaged for data analysis.
EMG recording and analysis. Surface EMG signals
were recorded from 15 locations distributed over the quad-
riceps muscles by circular Ag–AgCl surface electrodes (Ambu
Neuroline, conductive area 28 mm2
) during an isometric con-
traction at 40% MVC, which was sustained until task failure.
The reference MVC was measured each day. The distances
from the anterior superior iliac spine (ASIS) to the medial,
superior, and lateral borders of the patella were measured to
mark the medial, middle, and lateral regions of the quadriceps,
FIGURE 1—Schematic representation of EMG electrode location over
the vastus medialis, rectus femoris, and vastus lateralis muscles.
EMG AND SENSORY MAPPING DURING DOMS Medicine & Science in Sports & Exercised 327
APPLIEDSCIENCES
4. Copyright @ 200 by the American College of Sports Medicine. Unauthorized reproduction of this article is prohibited.8
respectively. These locations approximately correspond to the
vastus medialis, rectus femoris, and vastus lateralis muscles,
respectively (48). Fifteen pairs of electrodes were placed in
bipolar configuration (2-cm interelectrode distance) at a
distance from the patella of 10, 20, 30, 40, and 50% of the
measured anatomic lengths (Fig. 1). At each distance, three
electrode pairs were placed along the circumference of the
thigh, at a distance of 20% (lateral), 50% (middle), and 80%
(medial) of the half circumference from the femur midline.
Before electrode placement, the skin was shaved and lightly
abraded in the selected locations. Surface EMG signals were
amplified (EMG amplifier, EMG-16, LISiN-OT Bio-
elettronica, Torino, Italy, bandwidth 10–500 Hz), sampled
at 2048 Hz, and stored after 12-bit A/D conversion. A ground
electrode was placed around the right ankle. The positions
of the electrodes were marked on the skin at the first session
(day 1) so that the locations could be replicated at 24 and 48 h
after exercise.
Task failure was defined as a drop in force greater than
5% MVC for more than 5 s after strong verbal encourage-
ment to the subject to maintain the target force. Average
rectified value (ARV) and mean power spectral frequency
(MNF) were estimated from the EMG signals for epochs of
1 s. The values obtained from 1-s-long epochs in intervals
of 10% of the time to task failure were averaged to obtain
one representative value for each 10% interval. This was done
to compare subjects that had different times to task failure. To
compare changes across days, the percent differences in ARV
and MNF initial values (first time interval) for day 2 and 3
with respect to day 1, and the percent change between the
initial and last time interval, were calculated.
Statistical Analysis
One-way repeated-measures ANOVA was applied to ana-
lyze MVC, ROM, and time to task failure during the 3 d.
Three-way repeated-measures ANOVA was used to assess
the dependency of initial EMG variables (first epoch) on lo-
cation in the longitudinal direction (10–50%, 10% increments),
in the transverse direction (medial, middle, and lateral), and
day (baseline, 24 h, and 48 h after exercise). To assess changes
in ARV and MNF initial values before and after eccentric
exercise, two-way ANOVA was applied to the percent change
of initial values of ARV and MNF from day 1 (preexercise) to
the average initial values of ARV and MNF after eccentric
exercise (average across day 2 and 3, because initial values of
ARV and MNF were not different between day 2 and 3), with
transverse and longitudinal location as dependent factors. More-
over, three-way ANOVA was applied to the percent change
of ARV and MNF across the sustained contraction at 40%
MVC (percent change from the first to the last epoch), with day
and location in the two directions as dependent factors.
Three-way repeated-measures ANOVA (factors: day and
location in the two directions) was used to analyze PPT. To
compare changes in PPT across days, a two-way ANOVA
was applied to the percent change of PPT from day 1 (pre-
exercise) to the average PPT after eccentric exercise (aver-
age across day 2 and 3, because PPT were not different for
days 2 and 3), with location in the transverse and lon-
gitudinal directions as dependent factors. Pairwise compari-
sons were performed with the Student–Newman–Keuls post
hoc test when ANOVA was significant. Finally, correlation
analysis was performed between the percent change in PPT
from day 1 to the postexercise sessions and the percent
change in EMG ARV over time. The significance level was
set at P G 0.05 for all statistical procedures. Results are
reported as means and standard deviations (SD).
RESULTS
Functional properties. Maximum voluntary force,
ROM, and time to task failure depended on day (F 9 8.7,
P G 0.05), with lower values at 24 and 48 h after eccentric
exercise compared with day 1 (P G 0.05) (Table 1). There
was no significant difference between day 2 and day 3 for
MVC, ROM, and time to task failure (all P 9 0.05).
Sensory assessment. The total mapped pain areas
were not different on days 2 and 3 (day 2: 1.23 T 0.51 arbitrary
units, day 3: 2.17 T 0.86 arbitrary units). The average reported
pain intensity was 3.4 T 0.9 and 3.3 T 1.6 at 4 and 48 h after
eccentric exercise, respectively. PPT (Table 2) depended on
location in the transverse direction (F = 32.2, P G 0.001),
with the three locations different from each other (P G 0.01).
PPT also depended on day (F = 15.4, P G 0.001), with
TABLE 1. Muscle performance assessed at 24 h and 48 h after eccentric exercise.
Preexercise 24 h Postexercise 48 h Postexercise
Peak MVC (NIm) 438.6 T 109.5 316.4 T 110.4* 300.9 T 129.2*
Task failure (s) 56.6 T 23 34.3 T 18.9* 34.3 T 14.4*
ROM (-) 142.2 T 7.1 112.7 T 7.7* 113.5 T 8.1*
Mean T SD (N = 11) for maximal voluntary contraction (MVC), knee flexion range of
motion (ROM), and time-to-task failure during sustained knee extension at 40% of the
maximum force. Values for all performance parameters were significantly different at
24 h and 48 h after eccentric exercise compared with baseline. * P G 0.05.
TABLE 2. Pressure pain thresholds (kPa, mean T SD, N = 11) for the three locations in the transverse direction (medial, middle, and lateral) and the five locations in the longitudinal
direction (most distal: 10% distant from patella; most proximal: 50% distant from patella) for the 3 d.
Preexercise 24 h Postexercise 48 h Postexercise
Medial Middle Lateral Medial Middle Lateral Medial Middle Lateral
10% 300.8 T 58.0 401.3 T 69.4 331.1 T 78.3 181.6 T 45.8 267.5 T 80.7 215.4 T 73.2 174.5 T 47.4 248.7 T 85.1 202.1 T 73.6
20% 279.7 T 56.7 350.4 T 50.7 305.5 T 75.9 207.1 T 45.7 296.4 T 70.3 235.2 T 71.7 191.5 T 57.7 263.4 T 88.7 222.3 T 66.0
30% 264.4 T 48.2 326.5 T 56.6 310.0 T 70.6 212.7 T 54.4 274.6 T 76.6 247.8 T 51.2 195.2 T 66.9 259.0 T 80.9 221.0 T 53.3
40% 256.3 T 45.8 309.0 T 48.3 295.6 T 50.0 214.2 T 49.5 263.5 T 73.0 250.5 T 64.2 188.9 T 43.0 256.0 T 61.8 259.7 T 77.0
50% 222.3 T 31.0 295.4 T 39.7 299.9 T 51.0 203.0 T 46.6 252.7 T 58.7 253.4 T 74.6 184.1 T 39.0 248.4 T 71.2 245.4 T 77.0
http://www.acsm-msse.org328 Official Journal of the American College of Sports Medicine
APPLIEDSCIENCES
5. Copyright @ 200 by the American College of Sports Medicine. Unauthorized reproduction of this article is prohibited.8
lower values for days 2 and 3 with respect to day 1 (P G
0.001), but no differences were observed between days 2 and
3. Moreover, there was a significant interaction between
location in the transverse and longitudinal directions (F = 4.1,
P G 0.001). In the most medial and most lateral locations,
PPT did not change in the longitudinal direction, whereas in
the middle column, the PPT in the two most distal locations
were larger than in the two more proximal locations (P G
0.01; Table 2). The percent change in PPT after eccentric
exercise (average across day 2 and 3) with respect to day 1
was different for the locations in the longitudinal direction
(F = 15.1, P G 0.0001). The most distal location resulted in
the largest decrease with respect to all other locations (P G
0.001; mean T SD, 10% (most distal): j36.5 T 17.6%;
20%: j22.7 T 18.8%; 30%: j20.0 T 18.4%; 40%: j16.2 T
16.4%; 50% (most proximal): j14.6 T 18.2%).
EMG. Across all days, measurements of ARV at the
beginning of the contraction depended on location in the
longitudinal direction (F = 35.6, P G 0.001), with greater
values identified for the most distal location compared with
FIGURE 2—Average rectified value (ARV) (means for the 11 subjects; SD are not shown, for clarity) over time at day 1 (A–C) and average for day 2
and day 3 (D–F) for the medial (A, D), middle (B, E), and lateral (C, F) locations in the transverse direction. ARV is reported for the five locations in
the longitudinal direction (most distal: 10% distant from patella; most proximal: 50% distant from patella).
EMG AND SENSORY MAPPING DURING DOMS Medicine & Science in Sports & Exercised 329
APPLIEDSCIENCES
6. Copyright @ 200 by the American College of Sports Medicine. Unauthorized reproduction of this article is prohibited.8
the three most proximal locations (P G 0.001). Moreover,
initial measurements of ARV were dependent on the loca-
tion in the transverse direction (F = 33, P G 0.001), with
greater measurements identified for the lateral compared with
the medial (P G 0.001) and middle (P G 0.05) locations, and
higher measurements for the middle compared with the me-
dial location (P G 0.001).
The percent change of initial ARV after eccentric exer-
cise (average across days 2 and 3) with respect to baseline
did not depend on location in the two directions. However,
the percent change of ARV in the final epoch with respect
to the initial epoch depended on the day (F = 14.9, P G
0.001), location in the longitudinal direction (F = 19.2, P G
0.0001), and interaction between locations in the two direc-
tions (F = 2.6, P G 0.05). The relative change was smaller in
day 1 with respect to the other 2 d (P G 0.001; day 1: 4.1 T
27.7%; day 2: j35.8 T 14.8%; day 3: j39.9 T 17.9%; Fig. 2).
Moreover, the two most distal locations resulted in higher
decreases than did the three most proximal locations (P G
0.001; 10% (most distal): j29.4 T 10.3%; 20%: j27.4 T
12.3%; 30%: j20.1 T 12.9%; 40%: j21.3 T 13.6%; 50%
(most proximal): j21.2 T 12.5%) (Fig. 2).
Initial MNF depended on location in the longitudinal
direction (F = 18.3, P G 0.001), with higher measurements
of MNF observed for the two most proximal locations
compared with the other locations (P G 0.05). Initial MNF
also depended on the location in the transverse direction
(F = 20.3, P G 0.001), with greater measurements of MNF
FIGURE 3—Mean frequency (MNF) (mean for the 11 subjects; SD are not shown, for clarity) over time at day 1 (A–C) and average for day 2 and
day 3 (D–F) for the medial (A, D), middle (B, E), and lateral (C, F) locations in the transverse direction. MNF is reported in each graph for the five
locations in the longitudinal direction (most distal: 10% distant from patella; most proximal: 50% distant from patella).
http://www.acsm-msse.org330 Official Journal of the American College of Sports Medicine
APPLIEDSCIENCES
7. Copyright @ 200 by the American College of Sports Medicine. Unauthorized reproduction of this article is prohibited.8
for the lateral compared with the medial and middle
locations (both P G 0.05). The percent change in MNF
from day 1 to days 2 and 3 did not depend on location for
both directions. The percent change of MNF from the last to
the first epoch, however, depended on day (F = 13.1, P G
0.001) and was larger for day 1 with respect to day 2 and
day 3 (P G 0.001) (day 1: j10.0 T 4.2%; day 2: j2.5 T
3.8%; day 3: j4.3 T 3.0%; Fig. 3).
Correlation between PPT and EMG ARV changes.
The percent change in PPT from day 1 to days 2 and 3
(average for days 2 and 3) was compared with the
percent change in EMG ARV over the sustained contrac-
tion (average for days 2 and 3) at each of the 15 loca-
tions over the quadriceps muscle for each subject. Percent
change in PPT and percent change in EMG ARV over
the sustained contraction were positively correlated in 9 out
of 11 subjects (P G 0.05; average correlation coefficient
for the subjects with significant correlations: R = 0.37 T
0.15). When data from the 11 subjects were pooled
together, the percent change in PPT and the percent change
in ARV over the sustained contraction were significantly
correlated (P G 0.0001; R = 0.42; Fig. 4), indicating that the
sites over the quadriceps where PPT decreased the most
were also the areas where the EMG amplitude showed the
greatest decrease over the sustained contraction after
eccentric exercise.
DISCUSSION
This study demonstrates nonuniform changes in EMG am-
plitude and tenderness after eccentric exercise of the quad-
riceps muscles. After the eccentric task, the distal portion of
the quadriceps resulted in a larger reduction in PPT and a
larger decrease in EMG amplitude during a sustained con-
traction with respect to more proximal regions.
Muscle performance. The results on functional
variables indicate that the eccentric exercise protocol used
in this study induced impairment of muscle function. A sig-
nificant decrement in the maximal force-generation capacity
was observed 24 h after eccentric exercise, and it persisted at
48 h, in agreement with previous studies (5). Moreover, pas-
sive range of knee flexion decreased, and the time to task
failure was reduced during sustained knee extension, as ob-
served previously (20,39).
Tenderness. Muscle pain manifested at 24 h and
persisted 48 h after eccentric exercise, in agreement with
previous studies (7,11,34). Signs and symptoms of pain
may result from pathophysiological changes in the muscle
fibers. After muscle fiber injury, phagocyte cell infiltration
results in progressive necrosis of the contractile elements
and inflammation (1,33), which, in turn, sensitizes intra-
myofibril group IV afferents (41). In this study, a larger
decrease in PPT was observed in the most distal portion of
the quadriceps muscles. Thus, pain receptors sensitive to
local pressure—group III nociceptors and mechanoreceptors
served by group III axons (23,29)—are more affected in the
distal muscle region after muscle damage induced by ec-
centric exercise. Variation in tenderness after eccentric ex-
ercise may be explained by a nonuniform vulnerability of
muscle fibers to damage (10,42). This would result in a site-
specific production of inflammatory agents (e.g., prosta-
glandins) in response to eccentric exercise, which sensitizes
nociceptors (36) to varying degrees, depending on the
location within the muscle.
The quadriceps muscles are characterized by a large
variation in fiber-type composition (8), fiber orientation
(2,47), and fiber length (2) within each muscle compartment
that enable the quadriceps to contribute to an extensive range of
activities such as stabilization of the patella, external/internal
rotation of the tibia, and knee extension (14). Takekura et al.
(42) report differences in the structural disruption of fast-
and slow-twitch fibers after eccentric tasks, with fast-twitch
fibers more susceptible to damage. In agreement with this
observation, Homonko and Theriault (18) have shown pre-
ferential damage after downhill running within an area of
the rat medial gastrocnemius, which was compartmentalized
with fast-twitch fibers. This nonuniformity in susceptibility
to damage may be related to the mechanical and metabolic
capacity of muscle fibers in producing tension, temperature
(32), activation of phospholipase A2 (37), and lipid peroxi-
dation from oxygen radicals (21). Accordingly, the present
results show greater eccentric exercise–induced changes in
the distal region of the quadriceps, where a greater pro-
portion of IIb fibers and a lower proportion of type I fibers
have been reported in comparison with proximal regions
(43). Moreover, fascicle angle are significantly different along
the longitudinal and transverse directions in quadriceps
components (2). Variations in fascicle angles relative to the
bone may result in regions with different physiological
FIGURE 4—Scatter plot of the percent change in PPT from day 1 to days
2 and 3 (average for days 2 and 3) vs the percent change in ARV from the
last to first epoch of the sustained contraction in days 2 and 3 (average for
days 2 and 3). Data from all subjects and all muscles and locations (15
recording sites) are pooled together. The positive correlation indicates that
the sites where the PPT changed most also resulted in the largest decreases
of ARV over time after the eccentric exercise.
EMG AND SENSORY MAPPING DURING DOMS Medicine & Science in Sports & Exercised 331
APPLIEDSCIENCES
8. Copyright @ 200 by the American College of Sports Medicine. Unauthorized reproduction of this article is prohibited.8
cross-sectional areas and, thus, variations in the production
of tension, resulting in regional damage during eccentric
exercise. The frequency of exposure to stretch as a result of
the change in fiber pennation angle (17) may also expose
specific muscle fibers to further injury. Finally, differences
in fascicle length could be another explanation for the dif-
ferences in fiber susceptibility to damage. For example, the
shorter fascicles within the quadriceps muscle attaching at
larger angles would be expected to generate high relative
peak forces over shorter ranges of length (2) during an ec-
centric contraction.
Sustained contraction. Initial values of ARV and
MNF (first time interval) varied depending on the location
over the quadriceps in the longitudinal direction (16,25).
This can be explained by nonuniform fiber membrane prop-
erties or nonuniform motor unit recruitment. Variations in
the morphological and architectural characteristics of the
muscle fibers with location suggest that different regions
of the quadriceps would be activated differently during a
specific task. In agreement with the present results, other
studies have observed a greater value of EMG amplitude in the
more distal locations of the quadriceps during isometric
contractions (31).
EMG amplitude did not change over time before the ec-
centric exercise. However, after eccentric exercise, a signifi-
cant reduction in time to task failure and a greater decrease
in EMG amplitude over time were observed during the sus-
tained contraction. Accordingly, previous studies reported a
larger decrease of EMG amplitude during sustained iso-
metric contraction after eccentric exercise at similar con-
traction forces as analyzed in this study (15,38). The lack of
reduction in ARV at baseline can be explained by increasing
motor unit recruitment and/or discharge rate required to
compensate for contractile failure (22,30) caused by fatigue.
The larger reduction of ARV after eccentric exercise may
be attributable to early failure of the injured muscle (19,44).
Alterations in nociceptive sensitization of the painful mus-
cle may be one explanation for a decreased ARV of the EMG
signal during sustained contraction (4). It has been sug-
gested that nociceptor sensitization associated with tissue
injury can influence primary afferents of muscle spindles at
superficial layers of the dorsal horn of the spinal cord after
eccentric exercise (46). In the injured muscle, input from
nociceptive afferents inhibits the input of muscle spindles
by presynaptic inhibition (3), which, in turn, reduces motor
unit discharge rate and, consequently, results in a decreased
drive to the muscle. There are several possible routes for
peripheral inputs (including group III and IV afferents) to
affect the discharge rates of motor neurons (12). Le Pera
et al. (24) report that pain by itself may cause an inhibition
of motor system excitability both at the cortical and the
spinal levels. An inhibitory effect mediated by pain is in
agreement with the larger decrease in EMG amplitude in the
distal portions, which were the areas with larger reductions
in PPT. Selective inhibition of specific muscle portions at-
tributable to local nociceptive input has been shown in other
muscles with experimental pain models (26). Disturbance in
postsynaptic regulation of acetylcholine (a major factor for
signal transmission) as a result of remodeling of the neuro-
muscular junction (44) may also reduce the discharge rate
of motor units, resulting in a larger reduction of ARV over
the sustained contraction.
MNF showed a greater reduction over time at day 1 than
at days 2 and 3. The larger decrease in MNF observed at
baseline may be related to the longer contraction duration
compared with days 2 and 3 (Table 1). A longer contraction
duration implies a greater accumulation of metabolites, a
higher concentration of extracellular potassium, and, con-
sequently, a larger decrease in MNF. However, the lack of
changes in MNF initial values after eccentric exercise in-
dicates that the membrane mechanisms associated with ac-
tion potential conduction were probably not affected by the
eccentric exercise (45).
Limitations. The 15 EMG recording systems did not re-
cord independent signals due to signal propagation in the
volume conductor. It is likely that two adjacent recording
systems detected some common signal components. Thus,
the surface EMG mapping could not differentiate close
locations because of the poor selectivity of surface EMG. For
this reason, it is not possible to associate locations to specific
muscle compartments (e.g., medial locations to the vastus
medialis). Poor selectivity of the measure is also common
with the PPT recordings, because the subjects could probably
not differentiate PPT in locations too close to each other. This
problem is common to many physiological measurements
and impedes precise localization of the sources. The aim of
the study was to detect differences among portions of the
quadriceps that were large enough to be identified with the
poor spatial resolution that the available techniques provided.
Despite the poor selectivity of the recordings, it was possible
to identify different behaviors in different regions of the
quadriceps, and to correlate the sensory manifestations to the
EMG features.
Implications. The reduction of ARV during sustained
contraction observed after eccentric exercise may indicate a
mechanism to protect the muscle fibers against further injury
(6). However, the larger decrease in muscle activation in the
distal portions of the quadriceps may reduce the stabiliza-
tion of the patella during prolonged, high-tension exercise.
An insufficient ability of the distal region of the vasti mus-
cles to stabilize the patella as a result of fatigue may expose
structures of the knee to abnormal loading during exercise.
This may partly explain why soreness, weakness, and patel-
lar fatigue fracture are common after intensive fatiguing
contractions (27).
CONCLUSION
EMG and PPT topographical mapping of the quadriceps
has enabled the evaluation of site-specific changes in
muscle hyperalgesia and muscle activity during DOMS. A
greater decrease in EMG amplitude was shown to occur
http://www.acsm-msse.org332 Official Journal of the American College of Sports Medicine
APPLIEDSCIENCES
9. Copyright @ 200 by the American College of Sports Medicine. Unauthorized reproduction of this article is prohibited.8
during sustained contractions after eccentric exercise,
especially in the distal regions of the quadriceps. Moreover,
greater decreases in PPT occurred for the distal portions of
the quadriceps, and changes in PPT were positively
correlated with reductions in EMG amplitude over time.
This indicates that the distal regions of the quadriceps are
more susceptible to eccentric exercise–induced damage,
probably because of differences in morphological and
architectural characteristics of the muscle fibers and their
specific roles during knee extension.
This study was supported by the Ministry of Science, Research
and Technology of Iran (Nosratollah Hedayatpour) and the Danish
Technical Research Council (project: Centre for Neuroengineering
(CEN), contract no. 26-04-0100) (Dario Farina). Deborah Falla is
supported by the National Health and Medical Research Council of
Australia (ID 351678).
REFERENCES
1. Armstrong RB, Ogilvie RW, Schwane JA. Eccentric exercise-
induced injury to rat skeletal muscle. J Appl Physiol. 1983;54:
80–93.
2. Blazevich AJ, Gill ND, Zhou S. Intra- and intramuscular variation
in human quadriceps femoris architecture assessed in vivo. J Anat.
2006;209:289–310.
3. Cervero F, Laird JM. Mechanisms of touch-evoked pain (allody-
nia): a new model. Pain. 1996;68:13–23.
4. Ciubotariu A, Arendt-Nielsen L, Graven-Nielsen T. The influence
of muscle pain and fatigue on the activity of synergistic muscles
of the leg. Eur J Appl Physiol. 2004;91:604–14.
5. Deschenes MR, Brewer RE, Bush JA, McCoy RW, Volek JS,
Kraemer WJ. Neuromuscular disturbance outlasts other symp-
toms of exercise-induced muscle damage. J Neurol Sci. 2000;
174:92–9.
6. Edwards RH. Human muscle function and fatigue. Ciba Found
Symp. 1981;82:1–18.
7. Edwards RHT, Mills KR, Newham DJ. Measurement of severity
and distribution of experimental muscle tenderness. J Physiol
Lond. 1981;317:1P–2P.
8. Elder GC, Bradbury K, Roberts R. Variability of fiber type
distributions within human muscles. J Appl Physiol. 1982;53:
1473–80.
9. Ervilha UF, Farina D, Arendt-Nielsen L, Graven-Nielsen T. Ex-
perimental muscle pain changes motor control strategies in
dynamic contractions. Exp Brain Res. 2005;164:215–24.
10. Friden J, Sjostrom M, Ekblom B. Myofibril damage following in-
tense eccentric exercise in man. Int J Sports Med. 1983;4:170–6.
11. Friden J, Sfakianos PN, Hargens AR. Muscle soreness and intra-
muscular fluid pressure: comparison between eccentric and con-
centric load. J Appl Physiol. 1986;61:2175–9.
12. Gandevia SC. Spinal and supraspinal factors in human muscle
fatigue. Physiol Rev. 2001;81:1725–89.
13. Gollnick PD, King DW. Effect of exercise and training on mito-
chondria of rat skeletal muscle. Am J Physiol. 1969;216:1502–9.
14. Goodfellow J, O_Connor J. The mechanics of the knee and
prosthesis design. J Bone Joint Surg Br. 1978;60:358–69.
15. Hagberg C, Hagberg M. Surface EMG amplitude and frequency
dependence on exerted force for the upper trapezius muscle: a
comparison between right and left sides. Eur J Appl Physiol
Occup Physiol. 1989;58:641–5.
16. Hedayatpour N, Arendt-Nielsen L, Farina D. Non-uniform
electromyographic activity during fatigue and recovery of the
vastus medialis and lateralis muscles. J Electromyogr. (in press).
17. Herbert RD, Gandevia SC. Changes in pennation with joint angle
and muscle torque: in vivo measurements in human brachialis
muscle. J Physiol. 1995;484:523–32.
18. Homonko DA, Theriault E. Downhill running preferentially
increases CGRP in fast glycolytic muscle fibers. J Appl Physiol.
2000;89:1928–36.
19. Hortobagyi T, Houmard J, Fraser D, Dudek R, Lambert J, Tracy J.
Normal forces and myofibril disruption after repeated eccentric
exercise. J Appl Physiol. 1998;84:492–8.
20. Jamurtas AZ, Theocharis V, Tofas T, et al. Comparison between
leg and arm eccentric exercises of the same relative intensity on
indices of muscle damage. Eur J Appl Physiol. 2005;95:179–85.
21. Jenkins RR. Free radical chemistry. Relationship to exercise.
Sports Med Rev. 1988;5:156–70.
22. Kirsch RF, Rymer WZ. Neural compensation for fatigue-induced
changes in muscle stiffness during perturbations of elbow angle in
human. J Neurophysiol. 1992;68:449–70.
23. Kumazawa T, Mizumura K. Thin-fibre receptors responding to
mechanical, chemical, and thermal stimulation in the skeletal
muscle of the dog. J Physiol. 1977;273:179–94.
24. Le Pera D, Graven-Nielsen T, Valeriani M, et al. Inhibition of
motor system excitability at cortical and spinal level by tonic
muscle pain. Clin Neurophysiol. 2001;112:1633–41.
25. Li W, Sakamoto K. The influence of location of electrode on
muscle fiber conduction velocity and EMG power spectrum
during voluntary isometric contraction measured with surface
array electrodes. Appl Human Sci. 1996;15:25–32.
26. Madeleine P, Leclerc F, Arendt-Nielsen L, Ravier P, Farina D.
Experimental muscle pain changes the spatial distribution of upper
trapezius muscle activity during sustained contraction. Clin Neuro-
physiol. 2006;117:2436–45.
27. Mason RW, Moore TE, Walker CW, Kathol MH. Patellar fatigue
fractures. Skeletal Radiol. 1996;25:329–32.
28. McBride TA, Gorin FA, Carlsen RC. Membrane depolarization
following high resistance eccentric exercise in rat tibialis anterior.
J FASEB. 1994;8:A307.
29. Mense S, Meyer H. Bradykinin-induced modulation of the
response behaviour of different types of feline group III and IV
muscle receptors. J Physiol. 1988;398:49–63.
30. Merletti R, Knaflitz M, Deluca CJ. Myoelectric manifestations of
fatigue in voluntary and electrically elicited contractions. J Appl
Physiol. 1990;69:1810–20.
31. Morrish GM, Woledge RC, Haddad FS. Activity in three parts of
the quadriceps recorded isometrically at two different knee angles
and during a functional exercise. Electromyogr Clin Neurophysiol.
2003;43:259–65.
32. Nadel ER, Bergh U, Saltin B. Body temperatures during negative
work exercise. J Appl Physiol. 1972;33:553–8.
33. Newham DJ, Jones DA, Clarkson PM. Repeated high-force
eccentric exercise: effects on muscle pain and damage. J Appl
Physiol. 1987;63:1381–6.
34. Newham DJ, Mills KR, Quigley BM, Edwards RH. Pain and
fatigue after concentric and eccentric muscle contractions. Clin Sci
(Lond.) 1983;64:55–62.
35. Norkin CC, White DC. Measurement of Joint Motion: A Guide to
Goniometry. Philadelphia (PA): FA Davis; 1985.
36. Ostrowski K, Rohde T, Zacho M, Asp S, Pedersen BK. Evidence
that interleukin-6 is produced in human skeletal muscle during
prolonged running. J Physiol. 1998;508:949–53.
37. Palmer RM, Reeds PJ, Atkinson T, Smith RH. The influence of
changes in tension on protein synthesis and prostaglandin release
in isolated rabbit muscles. J Biochem. 1983;214:1011–4.
38. Pincivero DM, Gandhi V, Timmons MK, Coelho AJ. Quadri-
ceps femoris electromyogram during concentric, isometric and
EMG AND SENSORY MAPPING DURING DOMS Medicine & Science in Sports & Exercised 333
APPLIEDSCIENCES
10. Copyright @ 200 by the American College of Sports Medicine. Unauthorized reproduction of this article is prohibited.8
eccentric phases of fatiguing dynamic knee extensions. J Biomech.
2006;39:246–54.
39. Ray CA, Mahoney ET, Hume KM. Exercise-induced muscle
injury augments forearm vascular resistance during leg exercise.
Am J Physiol. 1998;275:443–7.
40. Seliger V, Dolejs L, Karas V. A dynamometric comparison of
maximum eccentric, concentric, and isometric contractions using
EMG and energy expenditure measurements. Eur J Appl Physiol
Occup Physiol. 1980;45:235–44.
41. Smith LL. Acute inflammation: the underlying mechanism in
delayed onset muscle soreness? Med Sci Sports Exerc. 1991;
23(5):542–51.
42. Takekura H, Fujinami N, Nishizawa T, Ogasawara H, Kasuga N.
Eccentric exercise-induced morphological changes in the mem-
brane systems involved in excitation-contraction coupling in rat
skeletal muscle. J Physiol. 2001;533:571–83.
43. Travnik L, Pernus F, Erzen I. Histochemical and morphometric
characteristics of the normal human vastus medialis longus and
vastus medialis obliquus muscles. J Anat. 1995;187:403–11.
44. Warren GL, Angels CP, Shah SJ, Armstrong RB. Uncoupling of
in vivo torque production from EMG in mouse muscles injured by
eccentric contractions. J Physiol. 1999;515:609–19.
45. Warren GL, Lowe DA, Hayes DA, Karwoski CJ, Prior BM,
Armstrong RB. Excitation failure in eccentric contraction-induced
injury of mouse soleus muscle. J Physiol. 1993;468:487–99.
46. Weerakkody NS, Whitehead NP, Canny BJ, Gregory JE, Proske
U. Large-fiber mechanoreceptors contribute to muscle soreness
after eccentric exercise. J Pain. 2001;2:209–19.
47. Wickiewicz TL, Roy RR, Powell PL, Edgerton VR. Muscle
architecture of the human lower limb. Clin Orthop Relat Res.
1983;179:275–83.
48. Zipp P. Recommendations for the standardization of lead posi-
tions in surface electromyography. Eur J Appl Physiol. 1982;
50:41–5.
http://www.acsm-msse.org334 Official Journal of the American College of Sports Medicine
APPLIEDSCIENCES
View publication statsView publication stats