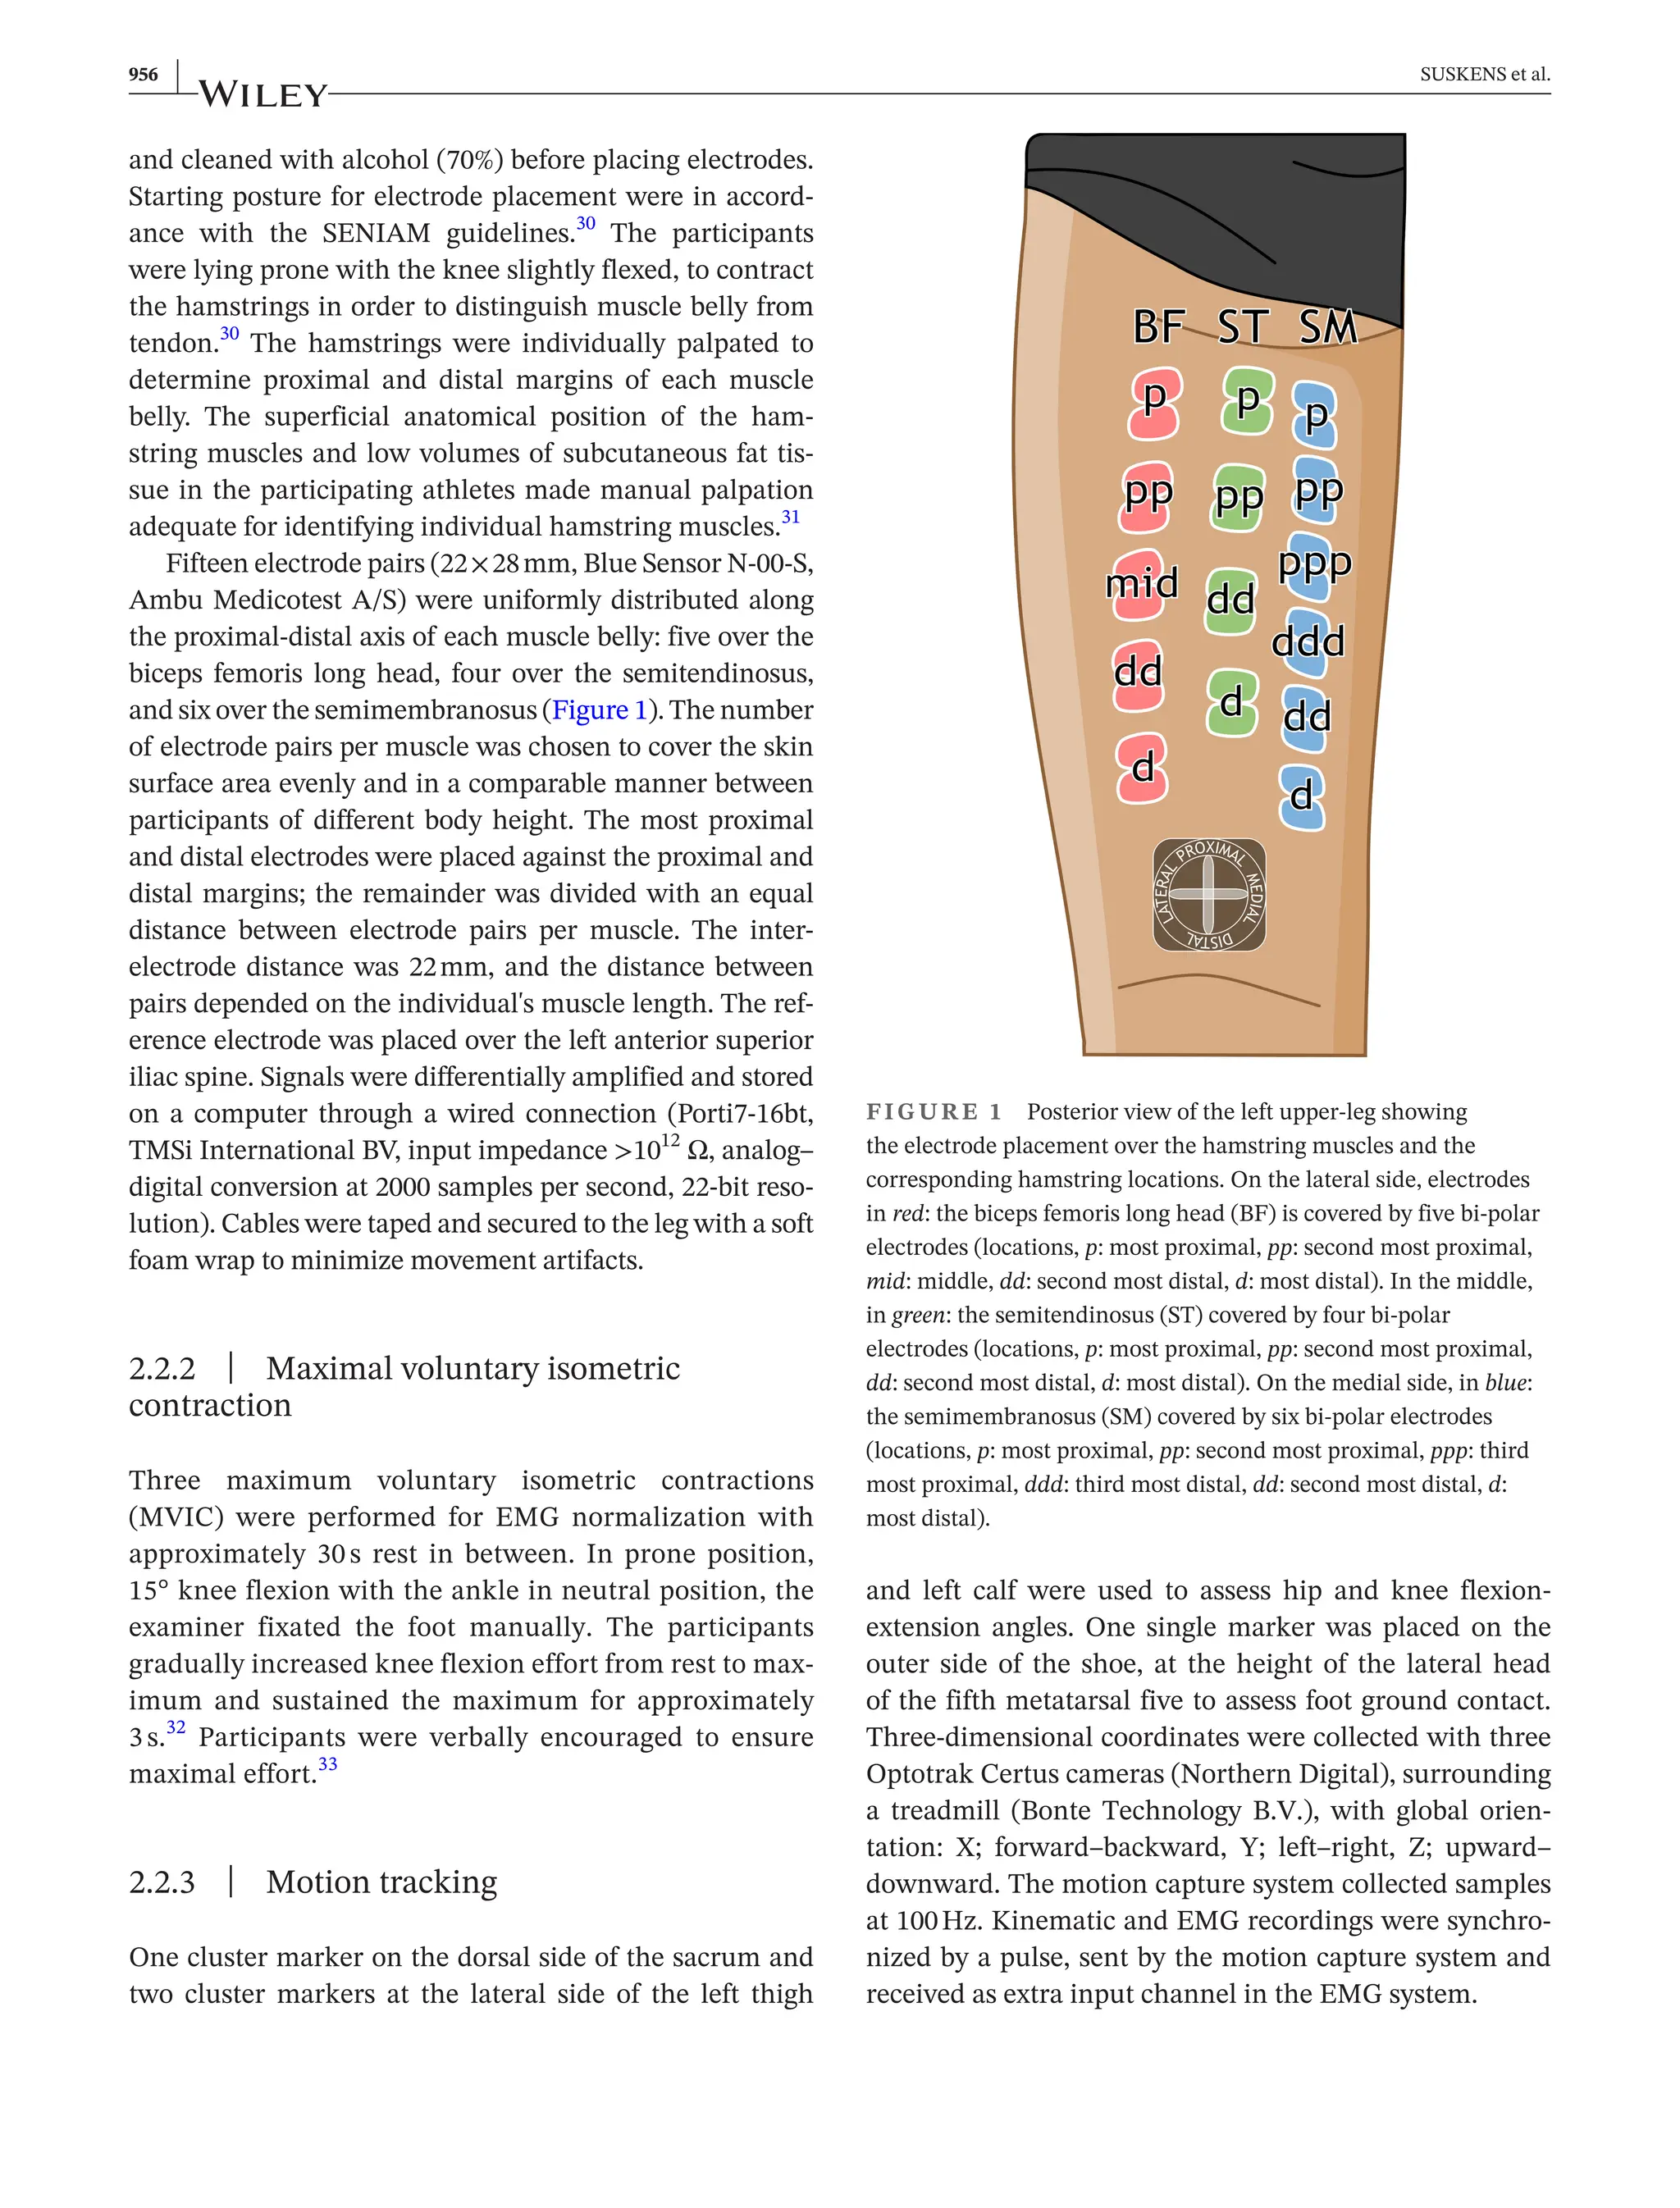
SlideShare a Scribd company logo
1 of 12
Download to read offline
954 | 	 Scand J Med Sci Sports. 2023;33:954–965.
wileyonlinelibrary.com/journal/sms
Received: 30 May 2022
| Revised: 27 January 2023
| Accepted: 2 February 2023
DOI: 10.1111/sms.14326
O R I G I N A L A R T I C L E
Activity distribution among the hamstring muscles during
high-­
speed running: A descriptive multichannel surface
EMG study
Jozef J. M. Suskens1,2,3
| Johannes L. Tol2,3,4
| Gino M. M. J. Kerkhoffs1,2,3
|
Huub Maas2,5
| Jaap H. van Dieën2,5
| Gustaaf Reurink2,3
This is an open access article under the terms of the Creative Commons Attribution License, which permits use, distribution and reproduction in any medium, provided
the original work is properly cited.
© 2023 The Authors. Scandinavian Journal of Medicine  Science In Sports published by John Wiley  Sons Ltd.
1
Department of Orthopedic Surgery
and Sports Medicine, Amsterdam UMC
Location University of Amsterdam,
Amsterdam, The Netherlands
2
Amsterdam Movement Sciences,
Amsterdam, The Netherlands
3
Amsterdam Collaboration on
Health and Safety in Sports (ACHSS),
AMC/VUmc IOC Research Center,
Amsterdam, The Netherlands
4
Aspetar Orthopaedic and Sports
Medicine Hospital, Doha, Qatar
5
Department of Human Movement
Sciences, Faculty of Behavioural and
Movement Sciences, Vrije Universiteit,
Amsterdam, The Netherlands
Correspondence
Jozef J. M. Suskens, Department of
Orthopaedic Surgery, Amsterdam
UMC, Amsterdam, The Netherlands.
Email: j.j.suskens@amsterdamumc.nl
Funding information
Marti-­
Keuning Eckhardt Foundation;
National Basketball Association (NBA)/
General Electric (GE) Healthcare
Orthopedics and Sports Medicine
Collaboration
Abstract
Purpose: This study assessed activity distribution among the hamstring muscles
during high-­
speed running. The objective was to compare within and between
muscle activity, relative contribution and hip and knee joint angles at peak mus-
cle activity during high-­
speed running.
Methods: Through multichannel electromyography, we measured muscle activ-
ity in male basketball players during high-­
speed running on a treadmill at 15
locations: five for biceps femoris long head, four for semitendinosus, and six for
semimembranosus. Muscle activity was calculated for each location within each
hamstring muscle individually for each percent of a stride cycle.
Results: Twenty-­
nine non-­
injured basketball players were included (mean age:
17±1years; mass, 85±9 kg; height, 193±9 cm). Heterogeneous activity was
found for all individual hamstring muscles across multiple events of the stride
cycle. In the late-­
swing phase, muscle activity and relative contribution of the
semimembranosus was significantly higher than of the semitendinosus. There
was no significant difference in hip and knee joint angles at instant of peak mus-
cle activity, assessed locally within individual hamstring muscles, as well as in
general over the whole hamstring muscle.
Conclusion: Hamstring muscles were most active in the late-­
swing phase dur-
ing high-­
speed running. In this phase, the semimembranosus was most active
and the semitendinosus was least active. Within the biceps femoris long head,
the most proximal region was significantly more active in the late-­
swing phase,
compared to other muscle regions. For each muscle and location, peak muscle
activity occurred at similar hip and knee joint angles.
K E Y W O R D S
electromyography, gait analysis, hamstring injury, high-­
speed running
   | 955
SUSKENS et al.
1 | INTRODUCTION
Hamstring injuries are the most prevalent type of in-
juries in sports, generally occurring during high-­
speed
running.1–­4
It has been suggested that the biarticular ham-
string muscles (biceps femoris long head, semitendinosus
and semimembranosus) are most susceptible to injury
during the late-­
swing phase of the stride cycle of high-­
speed running.5–­7
According to computational models,
forces produced by the hamstring muscles are peaking in
the late swing, simultaneously with high velocity muscle
lengthening.8–­11
These muscles are accountable for the de-
celeration of hip flexion and knee extension,8–­11
and thus
absorb high levels of eccentric mechanical load during the
late-­swing phase.
A high contribution of biceps femoris long head during
strenuous exercise compared to the semitendinosus and
semimembranosus was associated with an increased risk
of a first-­
time injury.12
It has been suggested that hamstring
injuries occur because of an inadequate distribution of in-
dividual contributions of hamstring muscles, also known
as load sharing.12,13
Load sharing refers to the distribution
of muscle forces in a synergistic muscle group to jointly pro-
duce a joint moment.14
Forces exerted by individual muscle
and thus load sharing cannot be assessed non-­
invasively
in vivo. Distribution of muscle activity has therefore previ-
ously been used as a proxy of load sharing.15
Previous stud-
ies successfully assessed muscle activity through surface
electromyography (EMG),16
functional magnetic resonance
imaging (fMRI),12,17,18
and shear wave elastography.19,20
A
relatively high activity of the semitendinosus may protect
against injury, possibly because it would unload the most
frequently affected long head of the biceps femoris.17,21,22
Additional information regarding load sharing between
hamstring muscles during high-­
speed running may pro-
vide new information on the etiology of hamstring injuries.
It has previously been reported that activation patterns
differ both within and between the biceps femoris long
head and semitendinosus during high-­
speed running and
various exercises.23–­26
On average, peak muscle activity
during high-­speed running occurs in the late-­swing phase,
yet muscle activation patterns between hamstring mus-
cles differ substantially between athletes.25,27
Running
speed seems to have an influence on both the amplitude
and timing of muscle activity: Amplitude increases with
increasing running speed,25,28
and at near maximum run-
ning speed, peak activity of the biceps femoris long head
compared to the semitendinosus is delayed.28
While the
amplitude of muscle activity within individual ham-
string muscles can be heterogeneous,23–­26
it is unknown
whether regional peaks of this amplitude within individ-
ual muscles occur at the same hip and knee joint angles.
A better understanding of peak muscle activation patterns
within and between hamstring muscles is required to pro-
vide more insight into the etiology of hamstring injuries.
Furthermore, (distribution of) EMG activity within the
semimembranosus over the different phases of a stride
cycle during high-­
speed running has not previously been
reported. Especially for larger muscles as the hamstrings,
the application of multichannel EMG would be an appro-
priate method.29
The aims of this descriptive study were (1) to asses
muscle activity within and between the three hamstring
muscles (biceps femoris long head, semitendinosus and
semimembranosus) over one stride cycle during high-­
speed running, (2) to investigate the relative contribution
between muscles, and (3) to evaluate hip and knee joint
angles at instants of peak muscle activity within and be-
tween the three individual hamstring muscles.
2 | MATERIALS AND METHODS
2.1 | Participants
This study is a sub-­
study of a larger randomized con-
trolled trial (RCT), in which the efficacy of two hamstring
injury prevention exercises in male basketball players is
evaluated by diffusion tensor MRI (Dutch trial register
ID: NL7248). The main study consists of three arms of 24
participants: a Control group, NHE intervention, and the
Diver hamstring exercise intervention. Both the Control
group and the NHE intervention group were invited to
participate in the present study over the period of acces-
sibility of the laboratory. Participants were recruited from
basketball teams and via promotion at sports and hospi-
tal facilities as well as social media platforms. Inclusion
criteria were 16years of age or older, male, playing bas-
ketball, and the exclusion criterion was a hamstring in-
jury within the preceding 12months. All participants gave
written consent before the start of data collection. Study
protocol and testing procedure were approved by the med-
ical research ethics committee Academic Medical Center
Amsterdam (NL63496.018.17) and were in accordance
with the Declaration of Helsinki.
2.2 | Study preparation
2.2.1 | Multichannel electromyography and
electrode placement
Muscle activity distribution was assessed through mul-
tichannel EMG. Hamstrings of the left leg were studied
to align with a magnetic resonance imaging procedure in
the main study. The skin of the posterior thigh was shaved
956 |    SUSKENS et al.
and cleaned with alcohol (70%) before placing electrodes.
Starting posture for electrode placement were in accord-
ance with the SENIAM guidelines.30
The participants
were lying prone with the knee slightly flexed, to contract
the hamstrings in order to distinguish muscle belly from
tendon.30
The hamstrings were individually palpated to
determine proximal and distal margins of each muscle
belly. The superficial anatomical position of the ham-
string muscles and low volumes of subcutaneous fat tis-
sue in the participating athletes made manual palpation
adequate for identifying individual hamstring muscles.31
Fifteen electrode pairs (22×28mm, Blue Sensor N-­
00-­
S,
Ambu Medicotest A/S) were uniformly distributed along
the proximal-­
distal axis of each muscle belly: five over the
biceps femoris long head, four over the semitendinosus,
and six over the semimembranosus (Figure 1). The number
of electrode pairs per muscle was chosen to cover the skin
surface area evenly and in a comparable manner between
participants of different body height. The most proximal
and distal electrodes were placed against the proximal and
distal margins; the remainder was divided with an equal
distance between electrode pairs per muscle. The inter-­
electrode distance was 22mm, and the distance between
pairs depended on the individual's muscle length. The ref-
erence electrode was placed over the left anterior superior
iliac spine. Signals were differentially amplified and stored
on a computer through a wired connection (Porti7-­
16bt,
TMSi International BV, input impedance 1012
Ω, analog–­
digital conversion at 2000 samples per second, 22-­
bit reso-
lution). Cables were taped and secured to the leg with a soft
foam wrap to minimize movement artifacts.
2.2.2 | Maximal voluntary isometric
contraction
Three maximum voluntary isometric contractions
(MVIC) were performed for EMG normalization with
approximately 30 s rest in between. In prone position,
15° knee flexion with the ankle in neutral position, the
examiner fixated the foot manually. The participants
gradually increased knee flexion effort from rest to max-
imum and sustained the maximum for approximately
3 s.32
Participants were verbally encouraged to ensure
maximal effort.33
2.2.3 | Motion tracking
One cluster marker on the dorsal side of the sacrum and
two cluster markers at the lateral side of the left thigh
and left calf were used to assess hip and knee flexion-­
extension angles. One single marker was placed on the
outer side of the shoe, at the height of the lateral head
of the fifth metatarsal five to assess foot ground contact.
Three-­
dimensional coordinates were collected with three
Optotrak Certus cameras (Northern Digital), surrounding
a treadmill (Bonte Technology B.V.), with global orien-
tation: X; forward–­
backward, Y; left–­
right, Z; upward–­
downward. The motion capture system collected samples
at 100Hz. Kinematic and EMG recordings were synchro-
nized by a pulse, sent by the motion capture system and
received as extra input channel in the EMG system.
FIGURE 1 Posterior view of the left upper-­
leg showing
the electrode placement over the hamstring muscles and the
corresponding hamstring locations. On the lateral side, electrodes
in red: the biceps femoris long head (BF) is covered by five bi-­
polar
electrodes (locations, p: most proximal, pp: second most proximal,
mid: middle, dd: second most distal, d: most distal). In the middle,
in green: the semitendinosus (ST) covered by four bi-­
polar
electrodes (locations, p: most proximal, pp: second most proximal,
dd: second most distal, d: most distal). On the medial side, in blue:
the semimembranosus (SM) covered by six bi-­
polar electrodes
(locations, p: most proximal, pp: second most proximal, ppp: third
most proximal, ddd: third most distal, dd: second most distal, d:
most distal).
   | 957
SUSKENS et al.
2.3 | Data collection
Participants wore a safety harness during the high-­
speed
running trials and were instructed to run in the center
of the treadmill throughout the whole measurement.
Participants performed a five-­
minute warm-­
up, consist-
ing of jogging on the treadmill at self-­
selected speed and
optionally self-­
selected stretch exercises. After warm-­
up,
participants were verbally instructed how to run during
three experimental trials while muscle activity and kin-
ematic data were collected. Participants were instructed
to catch up with a gentle linear acceleration of the tread-
mill (approximately 0.88ms−2
), up to a running speed
which they subjectively could maintain for maximally
10 s. Participants were instructed to verbally express when
they reached this running speed, after which an examiner
manually terminated the acceleration of the treadmill.
The treadmill was then kept at a constant speed for ap-
proximately 3s, after which the treadmill was decelerated.
2.4 | Data analysis
2.4.1 | Kinematic data
The trial with the highest treadmill speed and in field
of view of the motion capture cameras was analyzed,
using MATLAB R2020b (The MathWorks). Three con-
secutive strides cycles were manually identified at the
highest speed during the phase at which running speed
was constant, based on characteristic changes in kin-
ematic time series of the foot marker.5
A distinct pat-
tern was present in the vertical displacement of the foot
marker (e.g., toe-­
off was identified as a constant value
of vertical displacement). A stride cycle was defined
from toe-­
off, to the next toe-­
off of the same foot.34
Hip
joint angles were calculated from the cluster marker
on the pelvis and thigh, using Euler decomposition in
the order Y–­
X–­
Z (sagittal plane flexion–­
coronal plane
flexion–­
transverse plane rotation).35
Knee joint angles
were calculated from the cluster markers on the thigh
and calf, using Euler decomposition in the order Y–­
X–­
Z
(sagittal plane flexion–­
coronal plane flexion–­
transverse
plane rotation).35
Per stride cycle, three phases were de-
termined: early-­
swing; from toe-­
off to maximum knee
flexion, late-­
swing; from maximum knee flexion to heel-­
strike, stance; from heel-­
strike to toe-­
off.
2.4.2 | Electromyographic data
For multichannel EMG data, both MVIC and run record-
ings were processed with a bi-­
directional second order
Butterworth band-­
pass filter of 25-­
500Hz, rectification
and a bi-­
directional second order Butterworth low-­
pass
filter of 25Hz. The maximum value of a single sample of
EMG activity in the three MVIC attempts of each elec-
trode location was used for normalization of the signal of
the corresponding electrode location during the run trial
(EMG in percentage maximal voluntary isometric con-
traction, %MVIC).36
Different cutoff frequencies for the
band-­
pass filter are presented in Figure S1.
Individual phases of three consecutive strides were
extracted from the multichannel EMG. Data were time
normalized per stride cycle (100 data samples over a
complete stride, 0%–­
100%), with the relative duration
of the early-­
swing, late-­
swing, and stance phase set at
a fixed percentage per phase, determined as the ratio of
the group average duration of the individual phases with
respect to the total stride duration. The group averaged
absolute durations of the three phases were 0.22±0.02,
0.20±0.02, and 0.11±0.01s for the early-­
swing, late-­
swing, and stance phase, respectively. The stride cycle
(1%–­
100%) was accordingly divided in the following rel-
ative durations: 1%–­
42% stride cycle for the early-­
swing
phase, 43%–­
80% stride cycle for the late-­
swing phase,
and 81%–­
100% stride cycle for the stance phase. Detailed
results of individual absolute durations are presented
in Table S1. Periods with evident contamination (e.g.,
movement artifacts) in the raw EMG data over the three
strides were manually labeled as NaN (not a number) in
Matlab to exclude these periods from analysis. Results
were averaged over three strides. Per percentage of the
stride cycle, muscle average EMG activity was calculated
across all electrode locations of the corresponding ham-
string muscles (in %MVIC). The relative contribution of
individual muscles was assessed as the ratio of the mean
normalized of the biceps femoris long head, the semi-
tendinosus and the semimembranosus, to the summated
normalized muscle activity of the three muscles (relative
contribution (%con) = [individual normalized muscle ac-
tivity]/[summed normalized muscle activity of all three
muscles]).17,37
2.4.3 | Peak muscle activity
Peak EMG activity was calculated over the stride cycle (1)
within muscles: at the instant that peak activity occurred for
each electrode location per muscle, (2) between muscles:
at the instant that the peak activity occurred in the mean
activity across the electrode locations per muscle, (3) over
the total hamstring muscle: at the instant that the peak ac-
tivity occurred in the mean over all 15 electrode locations.
For each time-­
point of peak EMG activity, the associated
hip and knee joint angles were extracted from the kinematic
958 |    SUSKENS et al.
time series, in degrees.27
Full leg extension was 0°, with pos-
itive values for flexion of the hip and knee joint.
2.5 | Statistical analysis
One-­
dimensional statistical parametric mapping (SPM) was
used to test for differences in muscle activity between elec-
trode locations within individual muscles and between mus-
cles.38
The whole stride cycle (1%–­
100%) was used as one
input. Repeated measures ANOVAs for one-­
dimensional
measures were used to test for differences between electrode
locations for each muscle individually, with electrode loca-
tion as a factor and normalized muscle activity (%MVIC)
as dependent variable. Repeated measures ANOVAs were
used to test for differences between muscles over the stride
cycle, with muscle as a factor and mean whole muscle nor-
malized muscle activity (%MVIC) as dependent variable.
Also the muscles' individual contribution was tested with a
repeated measures ANOVA, with muscle as factor and rela-
tive contribution (%con) as dependent variable. In all tests,
an F-­
ratio was estimated for each percent of the stride cycle
by the SPM Matlab tool and referenced to a critical F-­ratio
(F*) with an alpha of 0.05. Post hoc analyses were applied in
case of a significant difference, using paired samples t-­tests
for all combinations with Bonferroni corrections.
Statistical analysis on the occurrence of EMG peak mo-
ments were performed using IBM SPSS Statistics (IBM SPSS
Statistics for Windows, Version 27.0, IBM Corp.). One-­
way
ANOVA with repeated measures was used to test for dif-
ferences between hip and knee joint angles between EMG
peak moments (repeated within-­
subjects factors: Peak EMG
[biceps femoris long head within, semitendinosus within,
semimembranosus within, mean biceps femoris long head,
mean semitendinosus, mean semimembranosus, mean
hamstring muscles]) and degrees as dependent variable. A
Shapiro–­
Wilk test was used to test for normality distribu-
tion. Alpha was set to 0.05, and in case of a significant main
effect, post hoc tests were applied with Bonferroni correc-
tions. Hip and knee joint angles at peak activity were de-
scribed as means and standard deviations.
3 | RESULTS
3.1 | Data collection and participant
characteristics
The inclusion period for this study was 13months, while
the window of inclusion for the main study was 19months.
Within this 13-­
month period, 38 of the total included 48
participants of the larger RCT could participate. One of
the 38 participants did not show up at the scheduled time
slot. Eight measured data sets were not suitable for analy-
sis, as pelvis and foot markers were recorded improp-
erly. Data sets of 29 participants were used for analysis.
The mean age was 17±1 year; mass, 85±9 kg; height,
193±9 cm; maximal running speed, 7.6 ±0.5 ms−1
. Two
participants suffered an anterior cruciate ligament (ACL)
injury of the left leg in the past: one treated non-­
surgically
and one with a semitendinosus tendon graft reconstruc-
tion. Four cases of evident contamination were observed
in the raw EMG data sets of four individual participants:
once the second most distal electrode location of the sem-
itendinosus, once the most proximal electrode location of
the semimembranosus and twice the most distal electrode
location of the semimembranosus. The episodes contain-
ing these contaminations were discarded and are illus-
trated in Figures S2–­5.
3.2 | Distribution of activity
within muscles
Within the biceps femoris long head, there was a signifi-
cant main effect of electrode location on normalized mus-
cle activity (df(4112), F = 4.68, p 0.05, Figure 2A,B). This
effect occurred in the early-­
swing, late-­
swing, and stance
phases. Post hoc tests revealed that the most proximal
electrode location had a higher normalized muscle activity
compared to all other electrode locations. Both the second
most distal and most distal electrode location had a higher
normalized muscle activity compared to the second most
proximal and middle electrode in the early-­
swing phase.
A more detailed description of the post hoc tests for the
biceps femoris long head is illustrated in Figure S6.
Within the semitendinosus, there was a significant
main effect of electrode location on normalized muscle
activity (df(3,84), F = 5.65, p 0.05, Figure 2C,D). Post
hoc tests revealed that the second most proximal electrode
location had a lower normalized muscle activity com-
pared to the most proximal and second most distal elec-
trode location in the late-­
swing phase. A more detailed
description of the post hoc tests for the semitendinosus is
illustrated in Figure S7.
Within the semimembranosus, there was a significant
main effect of electrode location on normalized muscle
activity (df(5140), F = 4.19, p 0.05, Figure 2E,F). This
effect occurred in the early-­
swing and late-­
swing phase.
Post hoc tests revealed that the most distal electrode loca-
tions had a higher normalized muscle activity compared
to all other electrode locations in the early-­
swing-­
phase.
The second most distal electrode location had a higher
normalized muscle activity compared to the third most
proximal, second most proximal and third most distal elec-
trode location in the early-­
swing phase. A more detailed
   | 959
SUSKENS et al.
960 |    SUSKENS et al.
description of the post hoc tests for the semimembranosus
is illustrated in Figure S8. Individual hamstring muscle
distributions per participant are illustrated in Figure S11.
3.3 | Distribution of activity
between muscles
Between muscles, the overall normalized muscle activity
over one stride cycle during high-­
speed running differed
significantly in the early-­
swing phase, late-­
swing phase,
and over the transition between stance to early-­
swing
phase (df(2,56), F = 7.31, p 0.05, Figure 3A,B). Post hoc
tests revealed that the semitendinosus had a significantly
lower normalized muscle activity than the biceps femoris
long head and the semimembranosus in the early-­
swing
phase. The semitendinosus had also a significantly lower
normalized muscle activity than the semimembranosus in
the late-­
swing phase. A more detailed description of the
post hoc tests for the mean activity between muscles is il-
lustrated in Figure S9.
The relative contribution between hamstring muscles
over one stride cycle during high-­
speed running differed
significantly between muscles (df(2,56), F = 7.28, p 0.05,
Figure 4A,B). Post hoc tests revealed that the relative con-
tribution of the semitendinosus was lower compared to
the biceps femoris long head and the semimembranosus
during the early-­
swing and late-­
swing phase. A more de-
tailed description of the post hoc tests for the relative con-
tribution between muscles illustrated in Figure S10.
3.4 | Joint angles at peak EMG activity
The mean hip and knee angles at occurrence of peak
EMG activity were 65.4 ±15.0° and 57.3 ±22.9°, respec-
tively. There were no significant differences in hip (F (6,
28) = 1.0, p = 0.418) and knee (F(6, 28) = 1.6, p = 0.146)
joint angles at moment of peak EMG activity within and
between muscles. Detailed results of the joint angles are
presented in Table 1. Descriptive results are described in
Table S2 and Figure S12.
4 | DISCUSSION
In this study, hamstring muscle activity and relative con-
tribution were assessed with multichannel EMG over a
stride cycle during high-­
speed running in uninjured male
basketball players. The main findings were that during the
late-­
swing phase (i) when normalized muscle activity was
the highest, the semimembranosus muscle activity was
significantly higher than the semitendinosus, (ii) there
was heterogeneous activity within the biceps femoris long
head, the semitendinosus and the semimembranosus, and
(iii) peak EMG activity occurred at comparable hip and
knee joint angles for all three hamstring muscles.
4.1 | Comparison with literature
Hamstring muscle activity during high-­
speed running
was previously assessed with multichannel EMG for the
biceps femoris long head and semitendinosus.23,25
These
two studies investigated primarily the effect of running
speed on the amplitude of normalized muscle activity
within each muscle.23,25
One of these studies reported
within hamstring muscle activity distribution as a sub-­
analysis.25
In contrast to our findings, no differences were
found among three regions within the biceps femoris long
head and semitendinosus, when comparing muscle activ-
ity over a stride cycle during high-­
speed running.25
One
of multiple possible explanations is that heterogeneous
activity was possibly averaged out in the aforementioned
study, as means were calculated over multiple EMG chan-
nels to form three regions per muscle. Our results indi-
cate heterogeneous muscle activity within the hamstring
muscles if assessed using a configuration with multiple
regions during high-­
speed running. There was also a
difference in what MVIC was used for normalization of
the signal, which probably resulted in lower normalized
EMG activity in our study. The maximum value of a sin-
gle sample was used in our study probably resulted in a
relatively lower normalized EMG activity (Figures 2 and
3) compared to an averaged value over a 1-­
s epoch in the
aforementioned study.25
For comparisons between mus-
cles, existing literature is limited to single-­
channel EMG
FIGURE 2 Within hamstring muscles: group averaged mean muscle activity per electrode location per muscle during over a stride
during high-­
speed running. Early-­
swing phase: toe-­
off to maximal knee flexion, 1%–­
42%; Late-­
swing phase: maximal knee flexion to heel-­
strike, 43%–­
80%; Stance phase: heel-­
strike to toe-­
off, 81%–­
100%. (A) Biceps femoris long head. (C) Semitendinosus. (E) Semimembranosus.
(A, C, E) The solid lines represent the group averaged mean muscle activity (expressed in percentage of the maximal voluntary isometric
contraction, %MVIC) per electrode location per percentage of the stride cycle of 29 participants. Semi-­
transparent colored areas represent
plus/minus one standard deviation of the group averaged mean muscle activity. Abbreviations for the electrode locations: p: most proximal,
pp: second most proximal, ppp: third most proximal, mid: middle, ddd: third most distal, dd: second most distal, d: most distal. (B, D, F) The
solid black line is the F-­
ratio per percentage, determined by repeated measures ANOVA. The dashed horizontal line represents the critical
F-­ratio (F*).
   | 961
SUSKENS et al.
studies.28,39,40
None of these studies evaluated the semi-
membranosus activity.28,39,40
In the early-­
swing phase,
studies described a significantly higher muscle activity in
the semitendinosus compared to the biceps femoris long,
which is in contrast to our results.28,39,40
A possible ex-
planation can be the heterogeneous activity distribution
within the individual hamstring muscles. We measured
higher normalized muscle activity in the proximal and
distal regions of the biceps femoris long head during the
early-­
swing phase compared to the middle electrode loca-
tion, which roughly corresponds to the electrode location
used in the aforementioned studies.28,39,40
In the late-­swing
phase, no significant differences between the muscle ac-
tivity of the biceps femoris long head and semitendino-
sus during high-­
speed running were reported, which
is in line with our results.28,39,40
An interesting observa-
tion in our results was the decrease of mean normalized
muscle activity of all three hamstring muscles just before
heel-­
strike, at the end of the late-­
swing phase (Figure 3).
Here, the semitendinosus and semimembranosus activity
decreased rapidly, while the biceps femoris long head re-
mained more active into the stance phase. This effect was
statistically significant when comparing relative contribu-
tions between muscles (Figure 4), yet not when looking at
normalized muscle activity (Figure 3). The higher contri-
bution of the biceps femoris long head in the late-­
swing
phase was possibly again caused by the heterogeneous
activity of this muscle. The most proximal electrode loca-
tion showed again significantly higher normalized muscle
activity in the late-­
swing phase compared to the two dis-
tal electrode location. This proximal location corresponds
to the most frequently injured location within the biceps
femoris long head.41,42
This is also the phase during high-­
speed running and location within the biceps femoris long
head with the highest strain according to model stud-
ies.43,44
It would be interesting to examine neural drive
between the hamstring muscles in the late-­
swing phase
during high-­
speed running and the relationship between
activity levels in the proximal region of the biceps femoris
long head and injury occurrence.45,46
FIGURE 3 Between hamstring muscles: group averaged muscle activity per hamstring muscle over a stride cycle during high-­
speed
running. Early-­
swing phase: toe-­
off to maximal knee flexion, 1%–­
42%; Late-­
swing phase: maximal knee flexion to heel-­
strike, 43%–­
80%;
Stance phase: heel-­
strike to toe-­
off, 81%–­
100%. (A) The solid lines represent the group averaged muscle activity (expressed in percentage
of the maximal voluntary isometric contraction, %MVIC) per muscle per percentage over a stride cycle during high-­
speed running of 29
participants. Semi-­
transparent colored areas represent plus/minus one standard deviation of the group averaged muscle activity. (B) The
solid black line is the F-­
ratio per percentage, determined by a repeated measures ANOVA. The dashed horizontal line represents the critical
F-­ratio (F*).
962 |    SUSKENS et al.
Hip and knee joint angles at peak EMG activity for dif-
ferent electrode location did not differ significantly. All
peak EMG activities, both within individual muscles as
well as over the mean of each of the muscles, occurred in
the late-­
swing phase. These results correspond to results
of a previous study in which the peak EMG activity was
compared between sprinting and a variety of hamstring
exercises for individual hamstring muscles.27
The reported
hip and joint angles at peak EMG activity of the biceps
femoris long head, semitendinosus and semimembrano-
sus were within one standard deviation of our results.27
All
peak EMG activities occurred at high musculotendinous
FIGURE 4 Between hamstring muscles: group averaged relative contribution per muscle over a stride cycle during high-­
speed running.
Early-­
swing phase: toe-­
off to maximal knee flexion, 1%–­
42%; Late-­
swing phase: maximal knee flexion to heel-­
strike, 43%–­
80%; Stance
phase: heel-­
strike to toe-­
off, 81%–­
100%. (A) The solid lines represent the group averaged relative contribution (normalized muscle activity
per muscle expressed in percentage of the summed muscle activity, %con) per percentage over a stride cycle during high-­
speed running of
29 participants. Semi-­
transparent colored areas represent plus/minus one standard deviation of the group averaged relative contributions.
(B) The solid black line is the F-­
ratio per percentage, determined by a repeated measures ANOVA. The dashed horizontal line represents the
critical F-­ratio (F*).
Peak EMG Muscle Hip joint angle Knee joint angle
Single-­channel per
muscle
Biceps femoris long head 65.3±18.2 65.1±28.4
Semitendinosus 69.0±9.3 63.3±20.1
Semimembranosus 66.5±17.3 58.8±22.3
The mean across
corresponding
channels per
muscle
Biceps femoris long head 62.9±15.5 54.9±26.2
Semitendinosus 61.3 ±17.6 52.2 ±22.0
Semimembranosus 65.1 ±13.2 52.9 ±19.0
The mean of all
channels
Hamstring muscle 67.9 ±11.7 54.0 ±20.0
Note: Values are mean±standard deviation, all reported in degrees. Positive values represent flexion from
neutral position.
TABLE 1 Group average hip and knee
joint angles at occurrence of peak EMG
activity during high-­
speed running.
   | 963
SUSKENS et al.
length, when the hamstring muscles perform the largest
amount of negative work.6
This indicates that high muscle
activity, muscle strain, and negative power coincide and
may explain why the late-­
swing phase is associated with
hamstring injury occurrence.
The strength of this study is the use of multichannel
EMG, compared to single electrode usage. It has previ-
ously been shown that heterogeneous muscle activity can
cause an over-­or underestimation when using conven-
tional single-­
channel EMG recordings.24,26
To highlight
the importance, we repeated the between hamstring anal-
yses with the electrode location per muscle which corre-
sponded most to the SENIAM guidelines.30
As a result, the
between-­
muscle difference in normalized muscle activity
in the late-­
swing phase disappeared (Figure S13). This ob-
servation, especially because it appears in the late-­
swing
phase, signifies the additional value of using multiple
EMG channels per muscle. Future studies should con-
firm this by comparing multichannel EMG with SENIAM
guidelines.
4.2 | Limitations
One of the limitations of this study is that inclusion was
restricted to uninjured basketball players, which might
limit generalizability to other and injured athletes.
Furthermore, an inherent limitation of using EMG is
cross-­
talk between muscles. With multichannel EMG,
electrode locations are closer to proximal and distal mus-
cle borders compared to conventional EMG, which may
be more prone to cross-­
talk. Given the expertise in clini-
cal care and based on comparisons with MRI in the larger
RCT, manual palpation was considered accurate for iden-
tifying hamstring muscles. By careful electrode placement
over the targeted muscle belly, minimizing inter-­
electrode
to 22mm and using differential amplification, cross-­
talk
and electrode placement over tendon was minimized as
much as possible, but cannot be completely ruled out. It
is furthermore unknown to what extent the influence is
of the tendinous inscription within the semitendinosus
and electrode displacement by skin displacement because
of movement.47
Future studies should consider obtaining
multiple MVIC values for normalization over a variety of
hip and knee joint angles, as a single MVIC can result in
a fractional under-­or overestimation of normalized mus-
cle activity.48
The approximately 4 kg extra weight of the
safety harness and EMG registration device, attached on
the backside of the harness, had an unknown effect on the
posture of the participants during high-­speed running. We
did not exclude the participants with a history of a ham-
string injury, older than 12months, or participants who
had a history of ACL reconstruction with semitendinosus
tendon graft. They might have long-­
lasting effects on
hamstring muscle activity and should be considered when
assessing unilateral muscle activity.49–­52
Finally, partici-
pants were tested on a treadmill and not in overground
running to allow data acquisition. Treadmill-­
based run-
ning analysis is comparable to over ground running
and had as benefit that running speed can be regulated
effectively.53
5 | Conclusion
This study comprehensively described the distribution
of hamstring muscle activity during high-­
speed running,
both within and between muscles. Our findings were
that (i) when the hamstring muscles were most active
during high-­
speed running, in the late-­
swing phase, the
semimembranosus was most active; (ii) contrasting, the
semitendinosus was least active in the late-­
swing phase
during high-­
speed running; (iii) within the biceps femo-
ris long head, the most proximal region was significantly
more active in the late-­
swing phase, compared to other
muscle regions; and (iv) peak muscle activity, assessed lo-
cally within individual hamstring muscles, as well as in
general over the whole muscle, occurred at similar hip
and knee joint angles during high-­
speed running.
6 | Perspective
The present study provides novel information about the
distribution of muscle activity of the hamstring muscles
during high-­
speed running. This comprehensive study
showed that when the hamstring muscles are most active,
in the late-­
swing phase, the level of muscle activity of the
semimembranosus is significantly higher compared to the
semitendinosus. Also in the late-­
swing phase during high-­
speed running, the level of muscle activity in the most prox-
imal part of the biceps femoris long head was significantly
more active compared to other regions within the same
muscle. This location within the biceps femoris long head
corresponds to the most injurious area of the hamstring
muscle. Peaks in muscle activity occurred at similar hip and
knee joint angles during high-­
speed running. Future stud-
ies should examine if preventive interventions have an ef-
fect on the activity distribution during high-­
speed running.
ACKNOWLEDGMENTS
The authors would like to thank LB Gerritsen for contri-
bution in data collection, Dr. GS Faber for his contribu-
tion to the measurement setup, and Dr. SM Bruijn for his
contribution to the data analysis and all participants for
their participation.
964 |    SUSKENS et al.
FUNDING INFORMATION
This work was performed with participants from the
National Basketball Association (NBA)/General Electric
(GE) Healthcare Orthopedics and Sports Medicine
Collaboration. This work was supported by the Marti-­
Keuning Eckhardt Foundation.
CONFLICT OF INTEREST STATEMENT
The authors have no competing interests to declare that
are relevant to the content of this article.
DATA AVAILABILITY STATEMENT
The data that support the findings of this study are avail-
able from the corresponding author upon reasonable
request.
CONSENT FOR PUBLICATION
Informed consent was obtained from all individual par-
ticipants included in the study.
ORCID
Jozef J. M. Suskens https://orcid.
org/0000-0003-0878-3946
Huub Maas https://orcid.org/0000-0002-2304-2735
Jaap H. van Dieën https://orcid.
org/0000-0002-7719-5585
REFERENCES
1. Ekstrand J, Hagglund M, Walden M. Epidemiology of mus-
cle injuries in professional football (soccer). Am J Sports Med.
2011;39(6):1226-­1232.
2. Brooks JHM. Epidemiology of injuries in English profes-
sional rugby union: part 1 match injuries. Br J Sports Med.
2005;39(10):757-­766.
3. Orchard JW, Seward H, Orchard JJ. Results of 2 decades of in-
jury surveillance and public release of data in the Australian
Football League. Am J Sports Med. 2013;41(4):734-­741.
4. Roe M, Murphy JC, Gissane C, Blake C. Hamstring injuries
in elite Gaelic football: an 8-­
year investigation to identify in-
jury rates, time-­
loss patterns and players at increased risk. Br J
Sports Med. 2018;52(15):982-­988.
5. Heiderscheit BC, Hoerth DM, Chumanov ES, Swanson SC,
Thelen BJ, Thelen DG. Identifying the time of occurrence of a
hamstring strain injury during treadmill running: a case study.
Clin Biomech (Bristol, Avon). 2005;20(10):1072-­1078.
6. Schache AG, Dorn TW, Blanch PD, Brown NA, Pandy MG.
Mechanics of the human hamstring muscles during sprinting.
Med Sci Sports Exerc. 2012;44(4):647-­658.
7. Nagano Y, Higashihara A, Takahashi K, Fukubayashi T.
Mechanics of the muscles crossing the hip joint during sprint
running. J Sports Sci. 2014;32(18):1722-­1728.
8. Chumanov ES, Heiderscheit BC, Thelen DG. Hamstring mus-
culotendon dynamics during stance and swing phases of high-­
speed running. Med Sci Sports Exerc. 2011;43(3):525-­532.
9. Schache AG, Dorn TW, Wrigley TV, Brown NAT, Pandy
MG. Stretch and activation of the human biarticular
hamstrings across a range of running speeds. Eur J Appl Physiol.
2013;113(11):2813-­2828.
10. Higashihara A, Nagano Y, Ono T, Fukubayashi T. Relationship
between the peak time of hamstring stretch and activation
during sprinting. Eur J Sport Sci. 2016;16(1):36-­41.
11. Yu B, Queen RM, Abbey AN, Liu Y, Moorman CT, Garrett WE.
Hamstring muscle kinematics and activation during over-
ground sprinting. J Biomech. 2008;41(15):3121-­3126.
12. Schuermans J, Van Tiggelen D, Danneels L, Witvrouw E.
Susceptibility to hamstring injuries in soccer: a prospective
study using muscle functional magnetic resonance imaging.
Am J Sports Med. 2016;44(5):1276-­1285.
13. Schuermans J, Danneels L, Van Tiggelen D, Palmans T,
Witvrouw E. Proximal neuromuscular control protects against
hamstring injuries in male soccer players: a prospective study
with electromyography time-­
series analysis during maximal
sprinting. Am J Sports Med. 2017;45(6):1315-­1325.
14. Dul J, Townsend MA, Shiavi R, Johnson GE. Muscular syner-
gism—­
I. On criteria for load sharing between synergistic mus-
cles. J Biomech. 1984;17(9):663-­673.
15. Lloyd DG, Buchanan TS. A model of load sharing between
muscles and soft tissues at the human knee during static tasks.
J Biomech Eng. 1996;118(3):367-­376.
16. Praagman M, Chadwick EKJ, Van Der Helm FCT, Veeger HEJ.
The effect of elbow angle and external moment on load sharing
of elbow muscles. J Electromyogr Kinesiol. 2010;20(5):912-­922.
17. Schuermans J, Van Tiggelen D, Danneels L, Witvrouw E. Biceps
femoris and semitendinosus–­
teammates or competitors? New
insights into hamstring injury mechanisms in male foot-
ball players: a muscle functional MRI study. Br J Sports Med.
2014;48(22):1599-­1606.
18. Bourne MN, Opar DA, Williams MD, Al Najjar A, Shield AJ.
Muscle activation patterns in the Nordic hamstring exer-
cise: impact of prior strain injury. Scand J Med Sci Sports.
2016;26(6):666-­674.
19. Mendes B, Firmino T, Oliveira R, et al. Effects of knee flexor
submaximal isometric contraction until exhaustion on sem-
itendinosus and biceps femoris long head shear modulus in
healthy individuals. Sci Rep. 2020;10(1):16433.
20. Evangelidis PE, Shan X, Otsuka S, Yang C, Yamagishi T,
Kawakami Y. Hamstrings load bearing in different contraction
types and intensities: a shear-­
wave and B-­
mode ultrasono-
graphic study. PLoS One. 2021;16(5):e0251939.
21. Woods C, Hawkins RD, Maltby S, Hulse M, Thomas A, Hodson
A. The Football Association Medical Research Programme: an
audit of injuries in professional football—­analysis of hamstring
injuries. Br J Sports Med. 2004;38(1):36-­41.
22. Gronwald T, Klein C, Hoenig T, et al. Hamstring injury patterns
in professional male football (soccer): a systematic video analy-
sis of 52 cases. Br J Sports Med. 2022;56(3):165-­171.
23. Schlink BR, Nordin AD, Diekfuss JA, Myer GD. Quantification
of global myoelectric spatial activations to delineate Normal
hamstring function at progressive running speeds: a technical
report. J Strength Cond Res. 2022;36(3):867-­870.
24. Hegyi A, Csala D, Peter A, Finni T, Cronin NJ. High-­
density
electromyography activity in various hamstring exercises.
Scand J Med Sci Sports. 2019;29(1):34-­43.
25. Hegyi A, GonÇAlves BAM, Finni T, Cronin NJ. Individual
region-­
and muscle-­
specific hamstring activity at different run-
ning speeds. Med Sci Sports Exerc. 2019;51(11):2274-­2285.
   | 965
SUSKENS et al.
26. Hegyi A, Peter A, Finni T, Cronin NJ. Region-­
dependent ham-
strings activity in Nordic hamstring exercise and stiff-­
leg dead-
lift defined with high-­
density electromyography. Scand J Med
Sci Sports. 2018;28(3):992-­1000.
27. van den Tillaar R, Solheim JAB, Bencke J. Comparison of ham-
string muscle activation during high-­
speed running and vari-
ous hamstring strengthening exercises. Int J Sports Phys Ther.
2017;12(5):718-­727.
28. Higashihara A, Ono T, Kubota J, Okuwaki T, Fukubayashi
T. Functional differences in the activity of the ham-
string muscles with increasing running speed. J Sports Sci.
2010;28(10):1085-­1092.
29. Vieira TM, Botter A. The accurate assessment of muscle exci-
tation requires the detection of multiple surface electromyo-
grams. Exerc Sport Sci Rev. 2021;49(1):23-­34.
30. Hermens H, Freriks B, Merletti R, et al. European
Recommendations for Surface Electromyography: Results of the
SENIAM Project. Roessingh Research and Development b.v..
1999. http://www.seniam.org/pdf/contents8.PDF
31. Storey RN, Meikle GR, Stringer MD, Woodley SJ. Proximal
hamstring morphology and morphometry in men: an an-
atomic and MRI investigation. Scand J Med Sci Sports.
2016;26(12):1480-­1489.
32. Rutherford DJ, Hubley-­
Kozey CL, Stanish WD. Maximal volun-
tary isometric contraction exercises: a methodological investi-
gation in moderate knee osteoarthritis. J Electromyogr Kinesiol.
2011;21(1):154-­160.
33. McNair PJ, Depledge J, Brettkelly M, Stanley SN. Verbal encour-
agement: effects on maximum effort voluntary muscle: action.
Br J Sports Med. 1996;30(3):243-­245.
34. Kenneally-­
Dabrowski CJB, Brown NAT, Lai AKM, Perriman D,
Spratford W, Serpell BG. Late swing or early stance? A narra-
tive review of hamstring injury mechanisms during high-­
speed
running. Scand J Med Sci Sports. 2019;29(8):1083-­1091.
35. Kingma I, de Looze MP, Toussaint HM, Klijnsma HG, Bruijnen
TBM. Validation of a full body 3-­
D dynamic linked segment
model. Hum Mov Sci. 1996;15(6):833-­860.
36. Halaki M, Gi K. Normalization of EMG Signals: To Normalize or
Not to Normalize and What to Normalize to? . InTech; 2012.
37. Avrillon S, Guilhem G, Barthelemy A, Hug F. Coordination of
hamstrings is individual specific and is related to motor perfor-
mance. J Appl Physiol. 2018;125(4):1069-­1079. https://pubmed.
ncbi.nlm.nih.gov/29975603
38. Pataky TC. One-­
dimensional statistical parametric map-
ping in Python. Comput Methods Biomech Biomed Engin.
2012;15(3):295-­301.
39. Higashihara A, Nagano Y, Ono T, Fukubayashi T. Differences
in activation properties of the hamstring muscles during over-
ground sprinting. Gait Posture. 2015;42(3):360-­364.
40. Higashihara A, Nagano Y, Ono T, Fukubayashi T. Differences
in hamstring activation characteristics between the acceler-
ation and maximum-­
speed phases of sprinting. J Sports Sci.
2018;36(12):1313-­1318.
41. Askling CM, Tengvar M, Saartok T, Thorstensson A. Acute first-­
time hamstring strains during high-­
speed running: a longitudi-
nal study including clinical and magnetic resonance imaging
findings. Am J Sports Med. 2007;35(2):197-­206.
42. Silder A, Heiderscheit BC, Thelen DG, Enright T, Tuite
MJ. MR observations of long-­
term musculotendon remod-
eling following a hamstring strain injury. Skeletal Radiol.
2008;37(12):1101-­1109.
43. Fiorentino NM, Blemker SS. Musculotendon variability in-
fluences tissue strains experienced by the biceps femoris
long head muscle during high-­
speed running. J Biomech.
2014;47(13):3325-­3333.
44. Silder A, Reeder SB, Thelen DG. The influence of prior ham-
string injury on lengthening muscle tissue mechanics. J
Biomech. 2010;43(12):2254-­2260.
45. Avrillon S, Del Vecchio A, Farina D, et al. Individual differences
in the neural strategies to control the lateral and medial head of
the quadriceps during a mechanically constrained task. J Appl
Physiol. 2021;130(1):269-­281.
46. Kenneally-­
Dabrowski C, Brown NAT, Warmenhoven J, et al.
Late swing running mechanics influence hamstring injury sus-
ceptibility in elite rugby athletes: a prospective exploratory
analysis. J Biomech. 2019;92:112-­119.
47. van der Made AD, Wieldraaijer T, Kerkhoffs GM, et al. The ham-
string muscle complex. Knee Surg Sports Traumatol Arthrosc.
2015;23(7):2115-­2122.
48. Hegyi A, Csala D, Kovács B, et al. Superimposing hip extension
on knee flexion evokes higher activation in biceps femoris than
knee flexion alone. J Electromyogr Kinesiol. 2021;58:102541.
49. Collings TJ, Diamond LE, Barrett RS, et al. Impact of prior ante-
rior cruciate ligament, hamstring or groin injury on lower limb
strength and jump kinetics in elite female footballers. Phys Ther
Sport. 2021;52:297-­304.
50. Opar DA, Williams MD, Timmins RG, Dear NM, Shield AJ.
Knee flexor strength and bicep femoris electromyographical ac-
tivity is lower in previously strained hamstrings. J Electromyogr
Kinesiol. 2013;23(3):696-­703.
51. Messer DJ, Shield AJ, Williams MD, Timmins RG, Bourne MN.
Hamstring muscle activation and morphology are significantly
altered 1–­
6years after anterior cruciate ligament reconstruc-
tion with semitendinosus graft. Knee Surg Sports Traumatol
Arthrosc. 2020;28(3):733-­741.
52. Kositsky A, Barrett RS, du Moulin W, Diamond LE, Saxby DJ.
Semitendinosus muscle morphology in relation to surface elec-
trode placement in anterior cruciate ligament reconstructed
and contralateral legs. Front sports act living. 2022;4:1-­9.
53. Riley PO, Dicharry JAY, Franz J, Croce UD, Wilder RP,
Kerrigan DC. A kinematics and kinetic comparison of
overground and treadmill running. Med Sci Sports Exerc.
2008;40(6):1093-­1100.
SUPPORTING INFORMATION
Additional supporting information can be found online
in the Supporting Information section at the end of this
article.
How to cite this article: Suskens JJM, Tol JL,
Kerkhoffs GMMJ, Maas H, van Dieën JH, Reurink G.
Activity distribution among the hamstring muscles
during high-speed running: A descriptive
multichannel surface EMG study. Scand J Med Sci
Sports. 2023;33:954-965. doi:10.1111/sms.14326

More Related Content

Similar to Activity_distribution_among_the_hamstring_muscles_.pdf

ActivMotion Bar Study
ActivMotion Bar StudyActivMotion Bar Study
ActivMotion Bar StudyGreg Maurer
 
Review of Software to Analyse the Physical Conditions of the Athletes using sEMG
Review of Software to Analyse the Physical Conditions of the Athletes using sEMGReview of Software to Analyse the Physical Conditions of the Athletes using sEMG
Review of Software to Analyse the Physical Conditions of the Athletes using sEMGijtsrd
 
Nikos Malliaropoulos - Rehabilitation of hamstring injuries
Nikos Malliaropoulos - Rehabilitation of hamstring injuries Nikos Malliaropoulos - Rehabilitation of hamstring injuries
Nikos Malliaropoulos - Rehabilitation of hamstring injuries MuscleTech Network
 
Slater and hart, 2017 agachamento
Slater and hart, 2017 agachamentoSlater and hart, 2017 agachamento
Slater and hart, 2017 agachamentoFábio Lanferdini
 
Motor Unit Conduction Velocity During Sustained Contraction Of The Vastus Med...
Motor Unit Conduction Velocity During Sustained Contraction Of The Vastus Med...Motor Unit Conduction Velocity During Sustained Contraction Of The Vastus Med...
Motor Unit Conduction Velocity During Sustained Contraction Of The Vastus Med...Nosrat hedayatpour
 
Acquisition of sEMG Signals During Human Ankle Movement
Acquisition of sEMG Signals During Human Ankle MovementAcquisition of sEMG Signals During Human Ankle Movement
Acquisition of sEMG Signals During Human Ankle MovementIJERD Editor
 
Effect of Sit To Sit And Activity On Forward Bending Test
Effect of Sit To Sit And Activity On Forward Bending TestEffect of Sit To Sit And Activity On Forward Bending Test
Effect of Sit To Sit And Activity On Forward Bending TestApeksha Besekar
 
Tahran 2020 modified posterior shoulder stretching exercises sis
Tahran 2020   modified posterior shoulder stretching exercises sisTahran 2020   modified posterior shoulder stretching exercises sis
Tahran 2020 modified posterior shoulder stretching exercises sisOLGUINHUERTACRISTIAN
 
Comparative Analysis of Hip Muscle Activation During Common Closed-Chain Reha...
Comparative Analysis of Hip Muscle Activation During Common Closed-Chain Reha...Comparative Analysis of Hip Muscle Activation During Common Closed-Chain Reha...
Comparative Analysis of Hip Muscle Activation During Common Closed-Chain Reha...Christopher Connelly, CSCS, EP-C
 
Muscle activation during various hamstring exercises
Muscle activation during various hamstring exercisesMuscle activation during various hamstring exercises
Muscle activation during various hamstring exercisesFernando Farias
 
Non-uniform electromyographic activity during fatigue and recovery of the vas...
Non-uniform electromyographic activity during fatigue and recovery of the vas...Non-uniform electromyographic activity during fatigue and recovery of the vas...
Non-uniform electromyographic activity during fatigue and recovery of the vas...Nosrat hedayatpour
 
ISMST 2015 Abstract 2 - The influence of medical shockwaves on muscle activat...
ISMST 2015 Abstract 2 - The influence of medical shockwaves on muscle activat...ISMST 2015 Abstract 2 - The influence of medical shockwaves on muscle activat...
ISMST 2015 Abstract 2 - The influence of medical shockwaves on muscle activat...Kenneth Craig
 
Crimson Publishers- The Effect of Medial Hamstring Weakness on Soft Tissue Lo...
Crimson Publishers- The Effect of Medial Hamstring Weakness on Soft Tissue Lo...Crimson Publishers- The Effect of Medial Hamstring Weakness on Soft Tissue Lo...
Crimson Publishers- The Effect of Medial Hamstring Weakness on Soft Tissue Lo...CrimsonPublishers-SBB
 
2004 anterior cruciate ligament assisi
2004 anterior cruciate ligament assisi2004 anterior cruciate ligament assisi
2004 anterior cruciate ligament assisiGUIDO MARIA FILIPPI
 
2004 anterior cruciate ligament assisi
2004 anterior cruciate ligament assisi2004 anterior cruciate ligament assisi
2004 anterior cruciate ligament assisiGUIDO MARIA FILIPPI
 

Similar to Activity_distribution_among_the_hamstring_muscles_.pdf (20)

BEGOVIC ET AL. 2014
BEGOVIC ET AL. 2014BEGOVIC ET AL. 2014
BEGOVIC ET AL. 2014
 
Walter_Baccinelli_tesi
Walter_Baccinelli_tesiWalter_Baccinelli_tesi
Walter_Baccinelli_tesi
 
ActivMotion Bar Study
ActivMotion Bar StudyActivMotion Bar Study
ActivMotion Bar Study
 
Hamstrings injuries
Hamstrings injuriesHamstrings injuries
Hamstrings injuries
 
Emg mapping
Emg mappingEmg mapping
Emg mapping
 
Review of Software to Analyse the Physical Conditions of the Athletes using sEMG
Review of Software to Analyse the Physical Conditions of the Athletes using sEMGReview of Software to Analyse the Physical Conditions of the Athletes using sEMG
Review of Software to Analyse the Physical Conditions of the Athletes using sEMG
 
Nikos Malliaropoulos - Rehabilitation of hamstring injuries
Nikos Malliaropoulos - Rehabilitation of hamstring injuries Nikos Malliaropoulos - Rehabilitation of hamstring injuries
Nikos Malliaropoulos - Rehabilitation of hamstring injuries
 
Slater and hart, 2017 agachamento
Slater and hart, 2017 agachamentoSlater and hart, 2017 agachamento
Slater and hart, 2017 agachamento
 
Motor Unit Conduction Velocity During Sustained Contraction Of The Vastus Med...
Motor Unit Conduction Velocity During Sustained Contraction Of The Vastus Med...Motor Unit Conduction Velocity During Sustained Contraction Of The Vastus Med...
Motor Unit Conduction Velocity During Sustained Contraction Of The Vastus Med...
 
Acquisition of sEMG Signals During Human Ankle Movement
Acquisition of sEMG Signals During Human Ankle MovementAcquisition of sEMG Signals During Human Ankle Movement
Acquisition of sEMG Signals During Human Ankle Movement
 
Effect of Sit To Sit And Activity On Forward Bending Test
Effect of Sit To Sit And Activity On Forward Bending TestEffect of Sit To Sit And Activity On Forward Bending Test
Effect of Sit To Sit And Activity On Forward Bending Test
 
Emg pilates
Emg pilatesEmg pilates
Emg pilates
 
Tahran 2020 modified posterior shoulder stretching exercises sis
Tahran 2020   modified posterior shoulder stretching exercises sisTahran 2020   modified posterior shoulder stretching exercises sis
Tahran 2020 modified posterior shoulder stretching exercises sis
 
Comparative Analysis of Hip Muscle Activation During Common Closed-Chain Reha...
Comparative Analysis of Hip Muscle Activation During Common Closed-Chain Reha...Comparative Analysis of Hip Muscle Activation During Common Closed-Chain Reha...
Comparative Analysis of Hip Muscle Activation During Common Closed-Chain Reha...
 
Muscle activation during various hamstring exercises
Muscle activation during various hamstring exercisesMuscle activation during various hamstring exercises
Muscle activation during various hamstring exercises
 
Non-uniform electromyographic activity during fatigue and recovery of the vas...
Non-uniform electromyographic activity during fatigue and recovery of the vas...Non-uniform electromyographic activity during fatigue and recovery of the vas...
Non-uniform electromyographic activity during fatigue and recovery of the vas...
 
ISMST 2015 Abstract 2 - The influence of medical shockwaves on muscle activat...
ISMST 2015 Abstract 2 - The influence of medical shockwaves on muscle activat...ISMST 2015 Abstract 2 - The influence of medical shockwaves on muscle activat...
ISMST 2015 Abstract 2 - The influence of medical shockwaves on muscle activat...
 
Crimson Publishers- The Effect of Medial Hamstring Weakness on Soft Tissue Lo...
Crimson Publishers- The Effect of Medial Hamstring Weakness on Soft Tissue Lo...Crimson Publishers- The Effect of Medial Hamstring Weakness on Soft Tissue Lo...
Crimson Publishers- The Effect of Medial Hamstring Weakness on Soft Tissue Lo...
 
2004 anterior cruciate ligament assisi
2004 anterior cruciate ligament assisi2004 anterior cruciate ligament assisi
2004 anterior cruciate ligament assisi
 
2004 anterior cruciate ligament assisi
2004 anterior cruciate ligament assisi2004 anterior cruciate ligament assisi
2004 anterior cruciate ligament assisi
 

Recently uploaded

EPANDING THE CONTENT OF AN OUTLINE using notes.pptx
EPANDING THE CONTENT OF AN OUTLINE using notes.pptxEPANDING THE CONTENT OF AN OUTLINE using notes.pptx
EPANDING THE CONTENT OF AN OUTLINE using notes.pptxRaymartEstabillo3
 
Incoming and Outgoing Shipments in 1 STEP Using Odoo 17
Incoming and Outgoing Shipments in 1 STEP Using Odoo 17Incoming and Outgoing Shipments in 1 STEP Using Odoo 17
Incoming and Outgoing Shipments in 1 STEP Using Odoo 17Celine George
 
Painted Grey Ware.pptx, PGW Culture of India
Painted Grey Ware.pptx, PGW Culture of IndiaPainted Grey Ware.pptx, PGW Culture of India
Painted Grey Ware.pptx, PGW Culture of IndiaVirag Sontakke
 
CARE OF CHILD IN INCUBATOR..........pptx
CARE OF CHILD IN INCUBATOR..........pptxCARE OF CHILD IN INCUBATOR..........pptx
CARE OF CHILD IN INCUBATOR..........pptxGaneshChakor2
 
“Oh GOSH! Reflecting on Hackteria's Collaborative Practices in a Global Do-It...
“Oh GOSH! Reflecting on Hackteria's Collaborative Practices in a Global Do-It...“Oh GOSH! Reflecting on Hackteria's Collaborative Practices in a Global Do-It...
“Oh GOSH! Reflecting on Hackteria's Collaborative Practices in a Global Do-It...Marc Dusseiller Dusjagr
 
Proudly South Africa powerpoint Thorisha.pptx
Proudly South Africa powerpoint Thorisha.pptxProudly South Africa powerpoint Thorisha.pptx
Proudly South Africa powerpoint Thorisha.pptxthorishapillay1
 
MARGINALIZATION (Different learners in Marginalized Group
MARGINALIZATION (Different learners in Marginalized GroupMARGINALIZATION (Different learners in Marginalized Group
MARGINALIZATION (Different learners in Marginalized GroupJonathanParaisoCruz
 
Final demo Grade 9 for demo Plan dessert.pptx
Final demo Grade 9 for demo Plan dessert.pptxFinal demo Grade 9 for demo Plan dessert.pptx
Final demo Grade 9 for demo Plan dessert.pptxAvyJaneVismanos
 
18-04-UA_REPORT_MEDIALITERAСY_INDEX-DM_23-1-final-eng.pdf
18-04-UA_REPORT_MEDIALITERAСY_INDEX-DM_23-1-final-eng.pdf18-04-UA_REPORT_MEDIALITERAСY_INDEX-DM_23-1-final-eng.pdf
18-04-UA_REPORT_MEDIALITERAСY_INDEX-DM_23-1-final-eng.pdfssuser54595a
 
Hierarchy of management that covers different levels of management
Hierarchy of management that covers different levels of managementHierarchy of management that covers different levels of management
Hierarchy of management that covers different levels of managementmkooblal
 
Earth Day Presentation wow hello nice great
Earth Day Presentation wow hello nice greatEarth Day Presentation wow hello nice great
Earth Day Presentation wow hello nice greatYousafMalik24
 
Software Engineering Methodologies (overview)
Software Engineering Methodologies (overview)Software Engineering Methodologies (overview)
Software Engineering Methodologies (overview)eniolaolutunde
 
Meghan Sutherland In Media Res Media Component
Meghan Sutherland In Media Res Media ComponentMeghan Sutherland In Media Res Media Component
Meghan Sutherland In Media Res Media ComponentInMediaRes1
 
Introduction to ArtificiaI Intelligence in Higher Education
Introduction to ArtificiaI Intelligence in Higher EducationIntroduction to ArtificiaI Intelligence in Higher Education
Introduction to ArtificiaI Intelligence in Higher Educationpboyjonauth
 
DATA STRUCTURE AND ALGORITHM for beginners
DATA STRUCTURE AND ALGORITHM for beginnersDATA STRUCTURE AND ALGORITHM for beginners
DATA STRUCTURE AND ALGORITHM for beginnersSabitha Banu
 
call girls in Kamla Market (DELHI) 🔝 >༒9953330565🔝 genuine Escort Service 🔝✔️✔️
call girls in Kamla Market (DELHI) 🔝 >༒9953330565🔝 genuine Escort Service 🔝✔️✔️call girls in Kamla Market (DELHI) 🔝 >༒9953330565🔝 genuine Escort Service 🔝✔️✔️
call girls in Kamla Market (DELHI) 🔝 >༒9953330565🔝 genuine Escort Service 🔝✔️✔️9953056974 Low Rate Call Girls In Saket, Delhi NCR
 
Presiding Officer Training module 2024 lok sabha elections
Presiding Officer Training module 2024 lok sabha electionsPresiding Officer Training module 2024 lok sabha elections
Presiding Officer Training module 2024 lok sabha electionsanshu789521
 

Recently uploaded (20)

Model Call Girl in Tilak Nagar Delhi reach out to us at 🔝9953056974🔝
Model Call Girl in Tilak Nagar Delhi reach out to us at 🔝9953056974🔝Model Call Girl in Tilak Nagar Delhi reach out to us at 🔝9953056974🔝
Model Call Girl in Tilak Nagar Delhi reach out to us at 🔝9953056974🔝
 
EPANDING THE CONTENT OF AN OUTLINE using notes.pptx
EPANDING THE CONTENT OF AN OUTLINE using notes.pptxEPANDING THE CONTENT OF AN OUTLINE using notes.pptx
EPANDING THE CONTENT OF AN OUTLINE using notes.pptx
 
Incoming and Outgoing Shipments in 1 STEP Using Odoo 17
Incoming and Outgoing Shipments in 1 STEP Using Odoo 17Incoming and Outgoing Shipments in 1 STEP Using Odoo 17
Incoming and Outgoing Shipments in 1 STEP Using Odoo 17
 
Painted Grey Ware.pptx, PGW Culture of India
Painted Grey Ware.pptx, PGW Culture of IndiaPainted Grey Ware.pptx, PGW Culture of India
Painted Grey Ware.pptx, PGW Culture of India
 
TataKelola dan KamSiber Kecerdasan Buatan v022.pdf
TataKelola dan KamSiber Kecerdasan Buatan v022.pdfTataKelola dan KamSiber Kecerdasan Buatan v022.pdf
TataKelola dan KamSiber Kecerdasan Buatan v022.pdf
 
CARE OF CHILD IN INCUBATOR..........pptx
CARE OF CHILD IN INCUBATOR..........pptxCARE OF CHILD IN INCUBATOR..........pptx
CARE OF CHILD IN INCUBATOR..........pptx
 
“Oh GOSH! Reflecting on Hackteria's Collaborative Practices in a Global Do-It...
“Oh GOSH! Reflecting on Hackteria's Collaborative Practices in a Global Do-It...“Oh GOSH! Reflecting on Hackteria's Collaborative Practices in a Global Do-It...
“Oh GOSH! Reflecting on Hackteria's Collaborative Practices in a Global Do-It...
 
Proudly South Africa powerpoint Thorisha.pptx
Proudly South Africa powerpoint Thorisha.pptxProudly South Africa powerpoint Thorisha.pptx
Proudly South Africa powerpoint Thorisha.pptx
 
MARGINALIZATION (Different learners in Marginalized Group
MARGINALIZATION (Different learners in Marginalized GroupMARGINALIZATION (Different learners in Marginalized Group
MARGINALIZATION (Different learners in Marginalized Group
 
Final demo Grade 9 for demo Plan dessert.pptx
Final demo Grade 9 for demo Plan dessert.pptxFinal demo Grade 9 for demo Plan dessert.pptx
Final demo Grade 9 for demo Plan dessert.pptx
 
18-04-UA_REPORT_MEDIALITERAСY_INDEX-DM_23-1-final-eng.pdf
18-04-UA_REPORT_MEDIALITERAСY_INDEX-DM_23-1-final-eng.pdf18-04-UA_REPORT_MEDIALITERAСY_INDEX-DM_23-1-final-eng.pdf
18-04-UA_REPORT_MEDIALITERAСY_INDEX-DM_23-1-final-eng.pdf
 
Hierarchy of management that covers different levels of management
Hierarchy of management that covers different levels of managementHierarchy of management that covers different levels of management
Hierarchy of management that covers different levels of management
 
Earth Day Presentation wow hello nice great
Earth Day Presentation wow hello nice greatEarth Day Presentation wow hello nice great
Earth Day Presentation wow hello nice great
 
Software Engineering Methodologies (overview)
Software Engineering Methodologies (overview)Software Engineering Methodologies (overview)
Software Engineering Methodologies (overview)
 
Meghan Sutherland In Media Res Media Component
Meghan Sutherland In Media Res Media ComponentMeghan Sutherland In Media Res Media Component
Meghan Sutherland In Media Res Media Component
 
Introduction to ArtificiaI Intelligence in Higher Education
Introduction to ArtificiaI Intelligence in Higher EducationIntroduction to ArtificiaI Intelligence in Higher Education
Introduction to ArtificiaI Intelligence in Higher Education
 
DATA STRUCTURE AND ALGORITHM for beginners
DATA STRUCTURE AND ALGORITHM for beginnersDATA STRUCTURE AND ALGORITHM for beginners
DATA STRUCTURE AND ALGORITHM for beginners
 
9953330565 Low Rate Call Girls In Rohini Delhi NCR
9953330565 Low Rate Call Girls In Rohini  Delhi NCR9953330565 Low Rate Call Girls In Rohini  Delhi NCR
9953330565 Low Rate Call Girls In Rohini Delhi NCR
 
call girls in Kamla Market (DELHI) 🔝 >༒9953330565🔝 genuine Escort Service 🔝✔️✔️
call girls in Kamla Market (DELHI) 🔝 >༒9953330565🔝 genuine Escort Service 🔝✔️✔️call girls in Kamla Market (DELHI) 🔝 >༒9953330565🔝 genuine Escort Service 🔝✔️✔️
call girls in Kamla Market (DELHI) 🔝 >༒9953330565🔝 genuine Escort Service 🔝✔️✔️
 
Presiding Officer Training module 2024 lok sabha elections
Presiding Officer Training module 2024 lok sabha electionsPresiding Officer Training module 2024 lok sabha elections
Presiding Officer Training module 2024 lok sabha elections
 

Activity_distribution_among_the_hamstring_muscles_.pdf

  • 1. 954 |  Scand J Med Sci Sports. 2023;33:954–965. wileyonlinelibrary.com/journal/sms Received: 30 May 2022 | Revised: 27 January 2023 | Accepted: 2 February 2023 DOI: 10.1111/sms.14326 O R I G I N A L A R T I C L E Activity distribution among the hamstring muscles during high-­ speed running: A descriptive multichannel surface EMG study Jozef J. M. Suskens1,2,3 | Johannes L. Tol2,3,4 | Gino M. M. J. Kerkhoffs1,2,3 | Huub Maas2,5 | Jaap H. van Dieën2,5 | Gustaaf Reurink2,3 This is an open access article under the terms of the Creative Commons Attribution License, which permits use, distribution and reproduction in any medium, provided the original work is properly cited. © 2023 The Authors. Scandinavian Journal of Medicine Science In Sports published by John Wiley Sons Ltd. 1 Department of Orthopedic Surgery and Sports Medicine, Amsterdam UMC Location University of Amsterdam, Amsterdam, The Netherlands 2 Amsterdam Movement Sciences, Amsterdam, The Netherlands 3 Amsterdam Collaboration on Health and Safety in Sports (ACHSS), AMC/VUmc IOC Research Center, Amsterdam, The Netherlands 4 Aspetar Orthopaedic and Sports Medicine Hospital, Doha, Qatar 5 Department of Human Movement Sciences, Faculty of Behavioural and Movement Sciences, Vrije Universiteit, Amsterdam, The Netherlands Correspondence Jozef J. M. Suskens, Department of Orthopaedic Surgery, Amsterdam UMC, Amsterdam, The Netherlands. Email: j.j.suskens@amsterdamumc.nl Funding information Marti-­ Keuning Eckhardt Foundation; National Basketball Association (NBA)/ General Electric (GE) Healthcare Orthopedics and Sports Medicine Collaboration Abstract Purpose: This study assessed activity distribution among the hamstring muscles during high-­ speed running. The objective was to compare within and between muscle activity, relative contribution and hip and knee joint angles at peak mus- cle activity during high-­ speed running. Methods: Through multichannel electromyography, we measured muscle activ- ity in male basketball players during high-­ speed running on a treadmill at 15 locations: five for biceps femoris long head, four for semitendinosus, and six for semimembranosus. Muscle activity was calculated for each location within each hamstring muscle individually for each percent of a stride cycle. Results: Twenty-­ nine non-­ injured basketball players were included (mean age: 17±1years; mass, 85±9 kg; height, 193±9 cm). Heterogeneous activity was found for all individual hamstring muscles across multiple events of the stride cycle. In the late-­ swing phase, muscle activity and relative contribution of the semimembranosus was significantly higher than of the semitendinosus. There was no significant difference in hip and knee joint angles at instant of peak mus- cle activity, assessed locally within individual hamstring muscles, as well as in general over the whole hamstring muscle. Conclusion: Hamstring muscles were most active in the late-­ swing phase dur- ing high-­ speed running. In this phase, the semimembranosus was most active and the semitendinosus was least active. Within the biceps femoris long head, the most proximal region was significantly more active in the late-­ swing phase, compared to other muscle regions. For each muscle and location, peak muscle activity occurred at similar hip and knee joint angles. K E Y W O R D S electromyography, gait analysis, hamstring injury, high-­ speed running
  • 2.    | 955 SUSKENS et al. 1 | INTRODUCTION Hamstring injuries are the most prevalent type of in- juries in sports, generally occurring during high-­ speed running.1–­4 It has been suggested that the biarticular ham- string muscles (biceps femoris long head, semitendinosus and semimembranosus) are most susceptible to injury during the late-­ swing phase of the stride cycle of high-­ speed running.5–­7 According to computational models, forces produced by the hamstring muscles are peaking in the late swing, simultaneously with high velocity muscle lengthening.8–­11 These muscles are accountable for the de- celeration of hip flexion and knee extension,8–­11 and thus absorb high levels of eccentric mechanical load during the late-­swing phase. A high contribution of biceps femoris long head during strenuous exercise compared to the semitendinosus and semimembranosus was associated with an increased risk of a first-­ time injury.12 It has been suggested that hamstring injuries occur because of an inadequate distribution of in- dividual contributions of hamstring muscles, also known as load sharing.12,13 Load sharing refers to the distribution of muscle forces in a synergistic muscle group to jointly pro- duce a joint moment.14 Forces exerted by individual muscle and thus load sharing cannot be assessed non-­ invasively in vivo. Distribution of muscle activity has therefore previ- ously been used as a proxy of load sharing.15 Previous stud- ies successfully assessed muscle activity through surface electromyography (EMG),16 functional magnetic resonance imaging (fMRI),12,17,18 and shear wave elastography.19,20 A relatively high activity of the semitendinosus may protect against injury, possibly because it would unload the most frequently affected long head of the biceps femoris.17,21,22 Additional information regarding load sharing between hamstring muscles during high-­ speed running may pro- vide new information on the etiology of hamstring injuries. It has previously been reported that activation patterns differ both within and between the biceps femoris long head and semitendinosus during high-­ speed running and various exercises.23–­26 On average, peak muscle activity during high-­speed running occurs in the late-­swing phase, yet muscle activation patterns between hamstring mus- cles differ substantially between athletes.25,27 Running speed seems to have an influence on both the amplitude and timing of muscle activity: Amplitude increases with increasing running speed,25,28 and at near maximum run- ning speed, peak activity of the biceps femoris long head compared to the semitendinosus is delayed.28 While the amplitude of muscle activity within individual ham- string muscles can be heterogeneous,23–­26 it is unknown whether regional peaks of this amplitude within individ- ual muscles occur at the same hip and knee joint angles. A better understanding of peak muscle activation patterns within and between hamstring muscles is required to pro- vide more insight into the etiology of hamstring injuries. Furthermore, (distribution of) EMG activity within the semimembranosus over the different phases of a stride cycle during high-­ speed running has not previously been reported. Especially for larger muscles as the hamstrings, the application of multichannel EMG would be an appro- priate method.29 The aims of this descriptive study were (1) to asses muscle activity within and between the three hamstring muscles (biceps femoris long head, semitendinosus and semimembranosus) over one stride cycle during high-­ speed running, (2) to investigate the relative contribution between muscles, and (3) to evaluate hip and knee joint angles at instants of peak muscle activity within and be- tween the three individual hamstring muscles. 2 | MATERIALS AND METHODS 2.1 | Participants This study is a sub-­ study of a larger randomized con- trolled trial (RCT), in which the efficacy of two hamstring injury prevention exercises in male basketball players is evaluated by diffusion tensor MRI (Dutch trial register ID: NL7248). The main study consists of three arms of 24 participants: a Control group, NHE intervention, and the Diver hamstring exercise intervention. Both the Control group and the NHE intervention group were invited to participate in the present study over the period of acces- sibility of the laboratory. Participants were recruited from basketball teams and via promotion at sports and hospi- tal facilities as well as social media platforms. Inclusion criteria were 16years of age or older, male, playing bas- ketball, and the exclusion criterion was a hamstring in- jury within the preceding 12months. All participants gave written consent before the start of data collection. Study protocol and testing procedure were approved by the med- ical research ethics committee Academic Medical Center Amsterdam (NL63496.018.17) and were in accordance with the Declaration of Helsinki. 2.2 | Study preparation 2.2.1 | Multichannel electromyography and electrode placement Muscle activity distribution was assessed through mul- tichannel EMG. Hamstrings of the left leg were studied to align with a magnetic resonance imaging procedure in the main study. The skin of the posterior thigh was shaved
  • 3. 956 |    SUSKENS et al. and cleaned with alcohol (70%) before placing electrodes. Starting posture for electrode placement were in accord- ance with the SENIAM guidelines.30 The participants were lying prone with the knee slightly flexed, to contract the hamstrings in order to distinguish muscle belly from tendon.30 The hamstrings were individually palpated to determine proximal and distal margins of each muscle belly. The superficial anatomical position of the ham- string muscles and low volumes of subcutaneous fat tis- sue in the participating athletes made manual palpation adequate for identifying individual hamstring muscles.31 Fifteen electrode pairs (22×28mm, Blue Sensor N-­ 00-­ S, Ambu Medicotest A/S) were uniformly distributed along the proximal-­ distal axis of each muscle belly: five over the biceps femoris long head, four over the semitendinosus, and six over the semimembranosus (Figure 1). The number of electrode pairs per muscle was chosen to cover the skin surface area evenly and in a comparable manner between participants of different body height. The most proximal and distal electrodes were placed against the proximal and distal margins; the remainder was divided with an equal distance between electrode pairs per muscle. The inter-­ electrode distance was 22mm, and the distance between pairs depended on the individual's muscle length. The ref- erence electrode was placed over the left anterior superior iliac spine. Signals were differentially amplified and stored on a computer through a wired connection (Porti7-­ 16bt, TMSi International BV, input impedance 1012 Ω, analog–­ digital conversion at 2000 samples per second, 22-­ bit reso- lution). Cables were taped and secured to the leg with a soft foam wrap to minimize movement artifacts. 2.2.2 | Maximal voluntary isometric contraction Three maximum voluntary isometric contractions (MVIC) were performed for EMG normalization with approximately 30 s rest in between. In prone position, 15° knee flexion with the ankle in neutral position, the examiner fixated the foot manually. The participants gradually increased knee flexion effort from rest to max- imum and sustained the maximum for approximately 3 s.32 Participants were verbally encouraged to ensure maximal effort.33 2.2.3 | Motion tracking One cluster marker on the dorsal side of the sacrum and two cluster markers at the lateral side of the left thigh and left calf were used to assess hip and knee flexion-­ extension angles. One single marker was placed on the outer side of the shoe, at the height of the lateral head of the fifth metatarsal five to assess foot ground contact. Three-­ dimensional coordinates were collected with three Optotrak Certus cameras (Northern Digital), surrounding a treadmill (Bonte Technology B.V.), with global orien- tation: X; forward–­ backward, Y; left–­ right, Z; upward–­ downward. The motion capture system collected samples at 100Hz. Kinematic and EMG recordings were synchro- nized by a pulse, sent by the motion capture system and received as extra input channel in the EMG system. FIGURE 1 Posterior view of the left upper-­ leg showing the electrode placement over the hamstring muscles and the corresponding hamstring locations. On the lateral side, electrodes in red: the biceps femoris long head (BF) is covered by five bi-­ polar electrodes (locations, p: most proximal, pp: second most proximal, mid: middle, dd: second most distal, d: most distal). In the middle, in green: the semitendinosus (ST) covered by four bi-­ polar electrodes (locations, p: most proximal, pp: second most proximal, dd: second most distal, d: most distal). On the medial side, in blue: the semimembranosus (SM) covered by six bi-­ polar electrodes (locations, p: most proximal, pp: second most proximal, ppp: third most proximal, ddd: third most distal, dd: second most distal, d: most distal).
  • 4.    | 957 SUSKENS et al. 2.3 | Data collection Participants wore a safety harness during the high-­ speed running trials and were instructed to run in the center of the treadmill throughout the whole measurement. Participants performed a five-­ minute warm-­ up, consist- ing of jogging on the treadmill at self-­ selected speed and optionally self-­ selected stretch exercises. After warm-­ up, participants were verbally instructed how to run during three experimental trials while muscle activity and kin- ematic data were collected. Participants were instructed to catch up with a gentle linear acceleration of the tread- mill (approximately 0.88ms−2 ), up to a running speed which they subjectively could maintain for maximally 10 s. Participants were instructed to verbally express when they reached this running speed, after which an examiner manually terminated the acceleration of the treadmill. The treadmill was then kept at a constant speed for ap- proximately 3s, after which the treadmill was decelerated. 2.4 | Data analysis 2.4.1 | Kinematic data The trial with the highest treadmill speed and in field of view of the motion capture cameras was analyzed, using MATLAB R2020b (The MathWorks). Three con- secutive strides cycles were manually identified at the highest speed during the phase at which running speed was constant, based on characteristic changes in kin- ematic time series of the foot marker.5 A distinct pat- tern was present in the vertical displacement of the foot marker (e.g., toe-­ off was identified as a constant value of vertical displacement). A stride cycle was defined from toe-­ off, to the next toe-­ off of the same foot.34 Hip joint angles were calculated from the cluster marker on the pelvis and thigh, using Euler decomposition in the order Y–­ X–­ Z (sagittal plane flexion–­ coronal plane flexion–­ transverse plane rotation).35 Knee joint angles were calculated from the cluster markers on the thigh and calf, using Euler decomposition in the order Y–­ X–­ Z (sagittal plane flexion–­ coronal plane flexion–­ transverse plane rotation).35 Per stride cycle, three phases were de- termined: early-­ swing; from toe-­ off to maximum knee flexion, late-­ swing; from maximum knee flexion to heel-­ strike, stance; from heel-­ strike to toe-­ off. 2.4.2 | Electromyographic data For multichannel EMG data, both MVIC and run record- ings were processed with a bi-­ directional second order Butterworth band-­ pass filter of 25-­ 500Hz, rectification and a bi-­ directional second order Butterworth low-­ pass filter of 25Hz. The maximum value of a single sample of EMG activity in the three MVIC attempts of each elec- trode location was used for normalization of the signal of the corresponding electrode location during the run trial (EMG in percentage maximal voluntary isometric con- traction, %MVIC).36 Different cutoff frequencies for the band-­ pass filter are presented in Figure S1. Individual phases of three consecutive strides were extracted from the multichannel EMG. Data were time normalized per stride cycle (100 data samples over a complete stride, 0%–­ 100%), with the relative duration of the early-­ swing, late-­ swing, and stance phase set at a fixed percentage per phase, determined as the ratio of the group average duration of the individual phases with respect to the total stride duration. The group averaged absolute durations of the three phases were 0.22±0.02, 0.20±0.02, and 0.11±0.01s for the early-­ swing, late-­ swing, and stance phase, respectively. The stride cycle (1%–­ 100%) was accordingly divided in the following rel- ative durations: 1%–­ 42% stride cycle for the early-­ swing phase, 43%–­ 80% stride cycle for the late-­ swing phase, and 81%–­ 100% stride cycle for the stance phase. Detailed results of individual absolute durations are presented in Table S1. Periods with evident contamination (e.g., movement artifacts) in the raw EMG data over the three strides were manually labeled as NaN (not a number) in Matlab to exclude these periods from analysis. Results were averaged over three strides. Per percentage of the stride cycle, muscle average EMG activity was calculated across all electrode locations of the corresponding ham- string muscles (in %MVIC). The relative contribution of individual muscles was assessed as the ratio of the mean normalized of the biceps femoris long head, the semi- tendinosus and the semimembranosus, to the summated normalized muscle activity of the three muscles (relative contribution (%con) = [individual normalized muscle ac- tivity]/[summed normalized muscle activity of all three muscles]).17,37 2.4.3 | Peak muscle activity Peak EMG activity was calculated over the stride cycle (1) within muscles: at the instant that peak activity occurred for each electrode location per muscle, (2) between muscles: at the instant that the peak activity occurred in the mean activity across the electrode locations per muscle, (3) over the total hamstring muscle: at the instant that the peak ac- tivity occurred in the mean over all 15 electrode locations. For each time-­ point of peak EMG activity, the associated hip and knee joint angles were extracted from the kinematic
  • 5. 958 |    SUSKENS et al. time series, in degrees.27 Full leg extension was 0°, with pos- itive values for flexion of the hip and knee joint. 2.5 | Statistical analysis One-­ dimensional statistical parametric mapping (SPM) was used to test for differences in muscle activity between elec- trode locations within individual muscles and between mus- cles.38 The whole stride cycle (1%–­ 100%) was used as one input. Repeated measures ANOVAs for one-­ dimensional measures were used to test for differences between electrode locations for each muscle individually, with electrode loca- tion as a factor and normalized muscle activity (%MVIC) as dependent variable. Repeated measures ANOVAs were used to test for differences between muscles over the stride cycle, with muscle as a factor and mean whole muscle nor- malized muscle activity (%MVIC) as dependent variable. Also the muscles' individual contribution was tested with a repeated measures ANOVA, with muscle as factor and rela- tive contribution (%con) as dependent variable. In all tests, an F-­ ratio was estimated for each percent of the stride cycle by the SPM Matlab tool and referenced to a critical F-­ratio (F*) with an alpha of 0.05. Post hoc analyses were applied in case of a significant difference, using paired samples t-­tests for all combinations with Bonferroni corrections. Statistical analysis on the occurrence of EMG peak mo- ments were performed using IBM SPSS Statistics (IBM SPSS Statistics for Windows, Version 27.0, IBM Corp.). One-­ way ANOVA with repeated measures was used to test for dif- ferences between hip and knee joint angles between EMG peak moments (repeated within-­ subjects factors: Peak EMG [biceps femoris long head within, semitendinosus within, semimembranosus within, mean biceps femoris long head, mean semitendinosus, mean semimembranosus, mean hamstring muscles]) and degrees as dependent variable. A Shapiro–­ Wilk test was used to test for normality distribu- tion. Alpha was set to 0.05, and in case of a significant main effect, post hoc tests were applied with Bonferroni correc- tions. Hip and knee joint angles at peak activity were de- scribed as means and standard deviations. 3 | RESULTS 3.1 | Data collection and participant characteristics The inclusion period for this study was 13months, while the window of inclusion for the main study was 19months. Within this 13-­ month period, 38 of the total included 48 participants of the larger RCT could participate. One of the 38 participants did not show up at the scheduled time slot. Eight measured data sets were not suitable for analy- sis, as pelvis and foot markers were recorded improp- erly. Data sets of 29 participants were used for analysis. The mean age was 17±1 year; mass, 85±9 kg; height, 193±9 cm; maximal running speed, 7.6 ±0.5 ms−1 . Two participants suffered an anterior cruciate ligament (ACL) injury of the left leg in the past: one treated non-­ surgically and one with a semitendinosus tendon graft reconstruc- tion. Four cases of evident contamination were observed in the raw EMG data sets of four individual participants: once the second most distal electrode location of the sem- itendinosus, once the most proximal electrode location of the semimembranosus and twice the most distal electrode location of the semimembranosus. The episodes contain- ing these contaminations were discarded and are illus- trated in Figures S2–­5. 3.2 | Distribution of activity within muscles Within the biceps femoris long head, there was a signifi- cant main effect of electrode location on normalized mus- cle activity (df(4112), F = 4.68, p 0.05, Figure 2A,B). This effect occurred in the early-­ swing, late-­ swing, and stance phases. Post hoc tests revealed that the most proximal electrode location had a higher normalized muscle activity compared to all other electrode locations. Both the second most distal and most distal electrode location had a higher normalized muscle activity compared to the second most proximal and middle electrode in the early-­ swing phase. A more detailed description of the post hoc tests for the biceps femoris long head is illustrated in Figure S6. Within the semitendinosus, there was a significant main effect of electrode location on normalized muscle activity (df(3,84), F = 5.65, p 0.05, Figure 2C,D). Post hoc tests revealed that the second most proximal electrode location had a lower normalized muscle activity com- pared to the most proximal and second most distal elec- trode location in the late-­ swing phase. A more detailed description of the post hoc tests for the semitendinosus is illustrated in Figure S7. Within the semimembranosus, there was a significant main effect of electrode location on normalized muscle activity (df(5140), F = 4.19, p 0.05, Figure 2E,F). This effect occurred in the early-­ swing and late-­ swing phase. Post hoc tests revealed that the most distal electrode loca- tions had a higher normalized muscle activity compared to all other electrode locations in the early-­ swing-­ phase. The second most distal electrode location had a higher normalized muscle activity compared to the third most proximal, second most proximal and third most distal elec- trode location in the early-­ swing phase. A more detailed
  • 7. 960 |    SUSKENS et al. description of the post hoc tests for the semimembranosus is illustrated in Figure S8. Individual hamstring muscle distributions per participant are illustrated in Figure S11. 3.3 | Distribution of activity between muscles Between muscles, the overall normalized muscle activity over one stride cycle during high-­ speed running differed significantly in the early-­ swing phase, late-­ swing phase, and over the transition between stance to early-­ swing phase (df(2,56), F = 7.31, p 0.05, Figure 3A,B). Post hoc tests revealed that the semitendinosus had a significantly lower normalized muscle activity than the biceps femoris long head and the semimembranosus in the early-­ swing phase. The semitendinosus had also a significantly lower normalized muscle activity than the semimembranosus in the late-­ swing phase. A more detailed description of the post hoc tests for the mean activity between muscles is il- lustrated in Figure S9. The relative contribution between hamstring muscles over one stride cycle during high-­ speed running differed significantly between muscles (df(2,56), F = 7.28, p 0.05, Figure 4A,B). Post hoc tests revealed that the relative con- tribution of the semitendinosus was lower compared to the biceps femoris long head and the semimembranosus during the early-­ swing and late-­ swing phase. A more de- tailed description of the post hoc tests for the relative con- tribution between muscles illustrated in Figure S10. 3.4 | Joint angles at peak EMG activity The mean hip and knee angles at occurrence of peak EMG activity were 65.4 ±15.0° and 57.3 ±22.9°, respec- tively. There were no significant differences in hip (F (6, 28) = 1.0, p = 0.418) and knee (F(6, 28) = 1.6, p = 0.146) joint angles at moment of peak EMG activity within and between muscles. Detailed results of the joint angles are presented in Table 1. Descriptive results are described in Table S2 and Figure S12. 4 | DISCUSSION In this study, hamstring muscle activity and relative con- tribution were assessed with multichannel EMG over a stride cycle during high-­ speed running in uninjured male basketball players. The main findings were that during the late-­ swing phase (i) when normalized muscle activity was the highest, the semimembranosus muscle activity was significantly higher than the semitendinosus, (ii) there was heterogeneous activity within the biceps femoris long head, the semitendinosus and the semimembranosus, and (iii) peak EMG activity occurred at comparable hip and knee joint angles for all three hamstring muscles. 4.1 | Comparison with literature Hamstring muscle activity during high-­ speed running was previously assessed with multichannel EMG for the biceps femoris long head and semitendinosus.23,25 These two studies investigated primarily the effect of running speed on the amplitude of normalized muscle activity within each muscle.23,25 One of these studies reported within hamstring muscle activity distribution as a sub-­ analysis.25 In contrast to our findings, no differences were found among three regions within the biceps femoris long head and semitendinosus, when comparing muscle activ- ity over a stride cycle during high-­ speed running.25 One of multiple possible explanations is that heterogeneous activity was possibly averaged out in the aforementioned study, as means were calculated over multiple EMG chan- nels to form three regions per muscle. Our results indi- cate heterogeneous muscle activity within the hamstring muscles if assessed using a configuration with multiple regions during high-­ speed running. There was also a difference in what MVIC was used for normalization of the signal, which probably resulted in lower normalized EMG activity in our study. The maximum value of a sin- gle sample was used in our study probably resulted in a relatively lower normalized EMG activity (Figures 2 and 3) compared to an averaged value over a 1-­ s epoch in the aforementioned study.25 For comparisons between mus- cles, existing literature is limited to single-­ channel EMG FIGURE 2 Within hamstring muscles: group averaged mean muscle activity per electrode location per muscle during over a stride during high-­ speed running. Early-­ swing phase: toe-­ off to maximal knee flexion, 1%–­ 42%; Late-­ swing phase: maximal knee flexion to heel-­ strike, 43%–­ 80%; Stance phase: heel-­ strike to toe-­ off, 81%–­ 100%. (A) Biceps femoris long head. (C) Semitendinosus. (E) Semimembranosus. (A, C, E) The solid lines represent the group averaged mean muscle activity (expressed in percentage of the maximal voluntary isometric contraction, %MVIC) per electrode location per percentage of the stride cycle of 29 participants. Semi-­ transparent colored areas represent plus/minus one standard deviation of the group averaged mean muscle activity. Abbreviations for the electrode locations: p: most proximal, pp: second most proximal, ppp: third most proximal, mid: middle, ddd: third most distal, dd: second most distal, d: most distal. (B, D, F) The solid black line is the F-­ ratio per percentage, determined by repeated measures ANOVA. The dashed horizontal line represents the critical F-­ratio (F*).
  • 8.    | 961 SUSKENS et al. studies.28,39,40 None of these studies evaluated the semi- membranosus activity.28,39,40 In the early-­ swing phase, studies described a significantly higher muscle activity in the semitendinosus compared to the biceps femoris long, which is in contrast to our results.28,39,40 A possible ex- planation can be the heterogeneous activity distribution within the individual hamstring muscles. We measured higher normalized muscle activity in the proximal and distal regions of the biceps femoris long head during the early-­ swing phase compared to the middle electrode loca- tion, which roughly corresponds to the electrode location used in the aforementioned studies.28,39,40 In the late-­swing phase, no significant differences between the muscle ac- tivity of the biceps femoris long head and semitendino- sus during high-­ speed running were reported, which is in line with our results.28,39,40 An interesting observa- tion in our results was the decrease of mean normalized muscle activity of all three hamstring muscles just before heel-­ strike, at the end of the late-­ swing phase (Figure 3). Here, the semitendinosus and semimembranosus activity decreased rapidly, while the biceps femoris long head re- mained more active into the stance phase. This effect was statistically significant when comparing relative contribu- tions between muscles (Figure 4), yet not when looking at normalized muscle activity (Figure 3). The higher contri- bution of the biceps femoris long head in the late-­ swing phase was possibly again caused by the heterogeneous activity of this muscle. The most proximal electrode loca- tion showed again significantly higher normalized muscle activity in the late-­ swing phase compared to the two dis- tal electrode location. This proximal location corresponds to the most frequently injured location within the biceps femoris long head.41,42 This is also the phase during high-­ speed running and location within the biceps femoris long head with the highest strain according to model stud- ies.43,44 It would be interesting to examine neural drive between the hamstring muscles in the late-­ swing phase during high-­ speed running and the relationship between activity levels in the proximal region of the biceps femoris long head and injury occurrence.45,46 FIGURE 3 Between hamstring muscles: group averaged muscle activity per hamstring muscle over a stride cycle during high-­ speed running. Early-­ swing phase: toe-­ off to maximal knee flexion, 1%–­ 42%; Late-­ swing phase: maximal knee flexion to heel-­ strike, 43%–­ 80%; Stance phase: heel-­ strike to toe-­ off, 81%–­ 100%. (A) The solid lines represent the group averaged muscle activity (expressed in percentage of the maximal voluntary isometric contraction, %MVIC) per muscle per percentage over a stride cycle during high-­ speed running of 29 participants. Semi-­ transparent colored areas represent plus/minus one standard deviation of the group averaged muscle activity. (B) The solid black line is the F-­ ratio per percentage, determined by a repeated measures ANOVA. The dashed horizontal line represents the critical F-­ratio (F*).
  • 9. 962 |    SUSKENS et al. Hip and knee joint angles at peak EMG activity for dif- ferent electrode location did not differ significantly. All peak EMG activities, both within individual muscles as well as over the mean of each of the muscles, occurred in the late-­ swing phase. These results correspond to results of a previous study in which the peak EMG activity was compared between sprinting and a variety of hamstring exercises for individual hamstring muscles.27 The reported hip and joint angles at peak EMG activity of the biceps femoris long head, semitendinosus and semimembrano- sus were within one standard deviation of our results.27 All peak EMG activities occurred at high musculotendinous FIGURE 4 Between hamstring muscles: group averaged relative contribution per muscle over a stride cycle during high-­ speed running. Early-­ swing phase: toe-­ off to maximal knee flexion, 1%–­ 42%; Late-­ swing phase: maximal knee flexion to heel-­ strike, 43%–­ 80%; Stance phase: heel-­ strike to toe-­ off, 81%–­ 100%. (A) The solid lines represent the group averaged relative contribution (normalized muscle activity per muscle expressed in percentage of the summed muscle activity, %con) per percentage over a stride cycle during high-­ speed running of 29 participants. Semi-­ transparent colored areas represent plus/minus one standard deviation of the group averaged relative contributions. (B) The solid black line is the F-­ ratio per percentage, determined by a repeated measures ANOVA. The dashed horizontal line represents the critical F-­ratio (F*). Peak EMG Muscle Hip joint angle Knee joint angle Single-­channel per muscle Biceps femoris long head 65.3±18.2 65.1±28.4 Semitendinosus 69.0±9.3 63.3±20.1 Semimembranosus 66.5±17.3 58.8±22.3 The mean across corresponding channels per muscle Biceps femoris long head 62.9±15.5 54.9±26.2 Semitendinosus 61.3 ±17.6 52.2 ±22.0 Semimembranosus 65.1 ±13.2 52.9 ±19.0 The mean of all channels Hamstring muscle 67.9 ±11.7 54.0 ±20.0 Note: Values are mean±standard deviation, all reported in degrees. Positive values represent flexion from neutral position. TABLE 1 Group average hip and knee joint angles at occurrence of peak EMG activity during high-­ speed running.
  • 10.    | 963 SUSKENS et al. length, when the hamstring muscles perform the largest amount of negative work.6 This indicates that high muscle activity, muscle strain, and negative power coincide and may explain why the late-­ swing phase is associated with hamstring injury occurrence. The strength of this study is the use of multichannel EMG, compared to single electrode usage. It has previ- ously been shown that heterogeneous muscle activity can cause an over-­or underestimation when using conven- tional single-­ channel EMG recordings.24,26 To highlight the importance, we repeated the between hamstring anal- yses with the electrode location per muscle which corre- sponded most to the SENIAM guidelines.30 As a result, the between-­ muscle difference in normalized muscle activity in the late-­ swing phase disappeared (Figure S13). This ob- servation, especially because it appears in the late-­ swing phase, signifies the additional value of using multiple EMG channels per muscle. Future studies should con- firm this by comparing multichannel EMG with SENIAM guidelines. 4.2 | Limitations One of the limitations of this study is that inclusion was restricted to uninjured basketball players, which might limit generalizability to other and injured athletes. Furthermore, an inherent limitation of using EMG is cross-­ talk between muscles. With multichannel EMG, electrode locations are closer to proximal and distal mus- cle borders compared to conventional EMG, which may be more prone to cross-­ talk. Given the expertise in clini- cal care and based on comparisons with MRI in the larger RCT, manual palpation was considered accurate for iden- tifying hamstring muscles. By careful electrode placement over the targeted muscle belly, minimizing inter-­ electrode to 22mm and using differential amplification, cross-­ talk and electrode placement over tendon was minimized as much as possible, but cannot be completely ruled out. It is furthermore unknown to what extent the influence is of the tendinous inscription within the semitendinosus and electrode displacement by skin displacement because of movement.47 Future studies should consider obtaining multiple MVIC values for normalization over a variety of hip and knee joint angles, as a single MVIC can result in a fractional under-­or overestimation of normalized mus- cle activity.48 The approximately 4 kg extra weight of the safety harness and EMG registration device, attached on the backside of the harness, had an unknown effect on the posture of the participants during high-­speed running. We did not exclude the participants with a history of a ham- string injury, older than 12months, or participants who had a history of ACL reconstruction with semitendinosus tendon graft. They might have long-­ lasting effects on hamstring muscle activity and should be considered when assessing unilateral muscle activity.49–­52 Finally, partici- pants were tested on a treadmill and not in overground running to allow data acquisition. Treadmill-­ based run- ning analysis is comparable to over ground running and had as benefit that running speed can be regulated effectively.53 5 | Conclusion This study comprehensively described the distribution of hamstring muscle activity during high-­ speed running, both within and between muscles. Our findings were that (i) when the hamstring muscles were most active during high-­ speed running, in the late-­ swing phase, the semimembranosus was most active; (ii) contrasting, the semitendinosus was least active in the late-­ swing phase during high-­ speed running; (iii) within the biceps femo- ris long head, the most proximal region was significantly more active in the late-­ swing phase, compared to other muscle regions; and (iv) peak muscle activity, assessed lo- cally within individual hamstring muscles, as well as in general over the whole muscle, occurred at similar hip and knee joint angles during high-­ speed running. 6 | Perspective The present study provides novel information about the distribution of muscle activity of the hamstring muscles during high-­ speed running. This comprehensive study showed that when the hamstring muscles are most active, in the late-­ swing phase, the level of muscle activity of the semimembranosus is significantly higher compared to the semitendinosus. Also in the late-­ swing phase during high-­ speed running, the level of muscle activity in the most prox- imal part of the biceps femoris long head was significantly more active compared to other regions within the same muscle. This location within the biceps femoris long head corresponds to the most injurious area of the hamstring muscle. Peaks in muscle activity occurred at similar hip and knee joint angles during high-­ speed running. Future stud- ies should examine if preventive interventions have an ef- fect on the activity distribution during high-­ speed running. ACKNOWLEDGMENTS The authors would like to thank LB Gerritsen for contri- bution in data collection, Dr. GS Faber for his contribu- tion to the measurement setup, and Dr. SM Bruijn for his contribution to the data analysis and all participants for their participation.
  • 11. 964 |    SUSKENS et al. FUNDING INFORMATION This work was performed with participants from the National Basketball Association (NBA)/General Electric (GE) Healthcare Orthopedics and Sports Medicine Collaboration. This work was supported by the Marti-­ Keuning Eckhardt Foundation. CONFLICT OF INTEREST STATEMENT The authors have no competing interests to declare that are relevant to the content of this article. DATA AVAILABILITY STATEMENT The data that support the findings of this study are avail- able from the corresponding author upon reasonable request. CONSENT FOR PUBLICATION Informed consent was obtained from all individual par- ticipants included in the study. ORCID Jozef J. M. Suskens https://orcid. org/0000-0003-0878-3946 Huub Maas https://orcid.org/0000-0002-2304-2735 Jaap H. van Dieën https://orcid. org/0000-0002-7719-5585 REFERENCES 1. Ekstrand J, Hagglund M, Walden M. Epidemiology of mus- cle injuries in professional football (soccer). Am J Sports Med. 2011;39(6):1226-­1232. 2. Brooks JHM. Epidemiology of injuries in English profes- sional rugby union: part 1 match injuries. Br J Sports Med. 2005;39(10):757-­766. 3. Orchard JW, Seward H, Orchard JJ. Results of 2 decades of in- jury surveillance and public release of data in the Australian Football League. Am J Sports Med. 2013;41(4):734-­741. 4. Roe M, Murphy JC, Gissane C, Blake C. Hamstring injuries in elite Gaelic football: an 8-­ year investigation to identify in- jury rates, time-­ loss patterns and players at increased risk. Br J Sports Med. 2018;52(15):982-­988. 5. Heiderscheit BC, Hoerth DM, Chumanov ES, Swanson SC, Thelen BJ, Thelen DG. Identifying the time of occurrence of a hamstring strain injury during treadmill running: a case study. Clin Biomech (Bristol, Avon). 2005;20(10):1072-­1078. 6. Schache AG, Dorn TW, Blanch PD, Brown NA, Pandy MG. Mechanics of the human hamstring muscles during sprinting. Med Sci Sports Exerc. 2012;44(4):647-­658. 7. Nagano Y, Higashihara A, Takahashi K, Fukubayashi T. Mechanics of the muscles crossing the hip joint during sprint running. J Sports Sci. 2014;32(18):1722-­1728. 8. Chumanov ES, Heiderscheit BC, Thelen DG. Hamstring mus- culotendon dynamics during stance and swing phases of high-­ speed running. Med Sci Sports Exerc. 2011;43(3):525-­532. 9. Schache AG, Dorn TW, Wrigley TV, Brown NAT, Pandy MG. Stretch and activation of the human biarticular hamstrings across a range of running speeds. Eur J Appl Physiol. 2013;113(11):2813-­2828. 10. Higashihara A, Nagano Y, Ono T, Fukubayashi T. Relationship between the peak time of hamstring stretch and activation during sprinting. Eur J Sport Sci. 2016;16(1):36-­41. 11. Yu B, Queen RM, Abbey AN, Liu Y, Moorman CT, Garrett WE. Hamstring muscle kinematics and activation during over- ground sprinting. J Biomech. 2008;41(15):3121-­3126. 12. Schuermans J, Van Tiggelen D, Danneels L, Witvrouw E. Susceptibility to hamstring injuries in soccer: a prospective study using muscle functional magnetic resonance imaging. Am J Sports Med. 2016;44(5):1276-­1285. 13. Schuermans J, Danneels L, Van Tiggelen D, Palmans T, Witvrouw E. Proximal neuromuscular control protects against hamstring injuries in male soccer players: a prospective study with electromyography time-­ series analysis during maximal sprinting. Am J Sports Med. 2017;45(6):1315-­1325. 14. Dul J, Townsend MA, Shiavi R, Johnson GE. Muscular syner- gism—­ I. On criteria for load sharing between synergistic mus- cles. J Biomech. 1984;17(9):663-­673. 15. Lloyd DG, Buchanan TS. A model of load sharing between muscles and soft tissues at the human knee during static tasks. J Biomech Eng. 1996;118(3):367-­376. 16. Praagman M, Chadwick EKJ, Van Der Helm FCT, Veeger HEJ. The effect of elbow angle and external moment on load sharing of elbow muscles. J Electromyogr Kinesiol. 2010;20(5):912-­922. 17. Schuermans J, Van Tiggelen D, Danneels L, Witvrouw E. Biceps femoris and semitendinosus–­ teammates or competitors? New insights into hamstring injury mechanisms in male foot- ball players: a muscle functional MRI study. Br J Sports Med. 2014;48(22):1599-­1606. 18. Bourne MN, Opar DA, Williams MD, Al Najjar A, Shield AJ. Muscle activation patterns in the Nordic hamstring exer- cise: impact of prior strain injury. Scand J Med Sci Sports. 2016;26(6):666-­674. 19. Mendes B, Firmino T, Oliveira R, et al. Effects of knee flexor submaximal isometric contraction until exhaustion on sem- itendinosus and biceps femoris long head shear modulus in healthy individuals. Sci Rep. 2020;10(1):16433. 20. Evangelidis PE, Shan X, Otsuka S, Yang C, Yamagishi T, Kawakami Y. Hamstrings load bearing in different contraction types and intensities: a shear-­ wave and B-­ mode ultrasono- graphic study. PLoS One. 2021;16(5):e0251939. 21. Woods C, Hawkins RD, Maltby S, Hulse M, Thomas A, Hodson A. The Football Association Medical Research Programme: an audit of injuries in professional football—­analysis of hamstring injuries. Br J Sports Med. 2004;38(1):36-­41. 22. Gronwald T, Klein C, Hoenig T, et al. Hamstring injury patterns in professional male football (soccer): a systematic video analy- sis of 52 cases. Br J Sports Med. 2022;56(3):165-­171. 23. Schlink BR, Nordin AD, Diekfuss JA, Myer GD. Quantification of global myoelectric spatial activations to delineate Normal hamstring function at progressive running speeds: a technical report. J Strength Cond Res. 2022;36(3):867-­870. 24. Hegyi A, Csala D, Peter A, Finni T, Cronin NJ. High-­ density electromyography activity in various hamstring exercises. Scand J Med Sci Sports. 2019;29(1):34-­43. 25. Hegyi A, GonÇAlves BAM, Finni T, Cronin NJ. Individual region-­ and muscle-­ specific hamstring activity at different run- ning speeds. Med Sci Sports Exerc. 2019;51(11):2274-­2285.
  • 12.    | 965 SUSKENS et al. 26. Hegyi A, Peter A, Finni T, Cronin NJ. Region-­ dependent ham- strings activity in Nordic hamstring exercise and stiff-­ leg dead- lift defined with high-­ density electromyography. Scand J Med Sci Sports. 2018;28(3):992-­1000. 27. van den Tillaar R, Solheim JAB, Bencke J. Comparison of ham- string muscle activation during high-­ speed running and vari- ous hamstring strengthening exercises. Int J Sports Phys Ther. 2017;12(5):718-­727. 28. Higashihara A, Ono T, Kubota J, Okuwaki T, Fukubayashi T. Functional differences in the activity of the ham- string muscles with increasing running speed. J Sports Sci. 2010;28(10):1085-­1092. 29. Vieira TM, Botter A. The accurate assessment of muscle exci- tation requires the detection of multiple surface electromyo- grams. Exerc Sport Sci Rev. 2021;49(1):23-­34. 30. Hermens H, Freriks B, Merletti R, et al. European Recommendations for Surface Electromyography: Results of the SENIAM Project. Roessingh Research and Development b.v.. 1999. http://www.seniam.org/pdf/contents8.PDF 31. Storey RN, Meikle GR, Stringer MD, Woodley SJ. Proximal hamstring morphology and morphometry in men: an an- atomic and MRI investigation. Scand J Med Sci Sports. 2016;26(12):1480-­1489. 32. Rutherford DJ, Hubley-­ Kozey CL, Stanish WD. Maximal volun- tary isometric contraction exercises: a methodological investi- gation in moderate knee osteoarthritis. J Electromyogr Kinesiol. 2011;21(1):154-­160. 33. McNair PJ, Depledge J, Brettkelly M, Stanley SN. Verbal encour- agement: effects on maximum effort voluntary muscle: action. Br J Sports Med. 1996;30(3):243-­245. 34. Kenneally-­ Dabrowski CJB, Brown NAT, Lai AKM, Perriman D, Spratford W, Serpell BG. Late swing or early stance? A narra- tive review of hamstring injury mechanisms during high-­ speed running. Scand J Med Sci Sports. 2019;29(8):1083-­1091. 35. Kingma I, de Looze MP, Toussaint HM, Klijnsma HG, Bruijnen TBM. Validation of a full body 3-­ D dynamic linked segment model. Hum Mov Sci. 1996;15(6):833-­860. 36. Halaki M, Gi K. Normalization of EMG Signals: To Normalize or Not to Normalize and What to Normalize to? . InTech; 2012. 37. Avrillon S, Guilhem G, Barthelemy A, Hug F. Coordination of hamstrings is individual specific and is related to motor perfor- mance. J Appl Physiol. 2018;125(4):1069-­1079. https://pubmed. ncbi.nlm.nih.gov/29975603 38. Pataky TC. One-­ dimensional statistical parametric map- ping in Python. Comput Methods Biomech Biomed Engin. 2012;15(3):295-­301. 39. Higashihara A, Nagano Y, Ono T, Fukubayashi T. Differences in activation properties of the hamstring muscles during over- ground sprinting. Gait Posture. 2015;42(3):360-­364. 40. Higashihara A, Nagano Y, Ono T, Fukubayashi T. Differences in hamstring activation characteristics between the acceler- ation and maximum-­ speed phases of sprinting. J Sports Sci. 2018;36(12):1313-­1318. 41. Askling CM, Tengvar M, Saartok T, Thorstensson A. Acute first-­ time hamstring strains during high-­ speed running: a longitudi- nal study including clinical and magnetic resonance imaging findings. Am J Sports Med. 2007;35(2):197-­206. 42. Silder A, Heiderscheit BC, Thelen DG, Enright T, Tuite MJ. MR observations of long-­ term musculotendon remod- eling following a hamstring strain injury. Skeletal Radiol. 2008;37(12):1101-­1109. 43. Fiorentino NM, Blemker SS. Musculotendon variability in- fluences tissue strains experienced by the biceps femoris long head muscle during high-­ speed running. J Biomech. 2014;47(13):3325-­3333. 44. Silder A, Reeder SB, Thelen DG. The influence of prior ham- string injury on lengthening muscle tissue mechanics. J Biomech. 2010;43(12):2254-­2260. 45. Avrillon S, Del Vecchio A, Farina D, et al. Individual differences in the neural strategies to control the lateral and medial head of the quadriceps during a mechanically constrained task. J Appl Physiol. 2021;130(1):269-­281. 46. Kenneally-­ Dabrowski C, Brown NAT, Warmenhoven J, et al. Late swing running mechanics influence hamstring injury sus- ceptibility in elite rugby athletes: a prospective exploratory analysis. J Biomech. 2019;92:112-­119. 47. van der Made AD, Wieldraaijer T, Kerkhoffs GM, et al. The ham- string muscle complex. Knee Surg Sports Traumatol Arthrosc. 2015;23(7):2115-­2122. 48. Hegyi A, Csala D, Kovács B, et al. Superimposing hip extension on knee flexion evokes higher activation in biceps femoris than knee flexion alone. J Electromyogr Kinesiol. 2021;58:102541. 49. Collings TJ, Diamond LE, Barrett RS, et al. Impact of prior ante- rior cruciate ligament, hamstring or groin injury on lower limb strength and jump kinetics in elite female footballers. Phys Ther Sport. 2021;52:297-­304. 50. Opar DA, Williams MD, Timmins RG, Dear NM, Shield AJ. Knee flexor strength and bicep femoris electromyographical ac- tivity is lower in previously strained hamstrings. J Electromyogr Kinesiol. 2013;23(3):696-­703. 51. Messer DJ, Shield AJ, Williams MD, Timmins RG, Bourne MN. Hamstring muscle activation and morphology are significantly altered 1–­ 6years after anterior cruciate ligament reconstruc- tion with semitendinosus graft. Knee Surg Sports Traumatol Arthrosc. 2020;28(3):733-­741. 52. Kositsky A, Barrett RS, du Moulin W, Diamond LE, Saxby DJ. Semitendinosus muscle morphology in relation to surface elec- trode placement in anterior cruciate ligament reconstructed and contralateral legs. Front sports act living. 2022;4:1-­9. 53. Riley PO, Dicharry JAY, Franz J, Croce UD, Wilder RP, Kerrigan DC. A kinematics and kinetic comparison of overground and treadmill running. Med Sci Sports Exerc. 2008;40(6):1093-­1100. SUPPORTING INFORMATION Additional supporting information can be found online in the Supporting Information section at the end of this article. How to cite this article: Suskens JJM, Tol JL, Kerkhoffs GMMJ, Maas H, van Dieën JH, Reurink G. Activity distribution among the hamstring muscles during high-speed running: A descriptive multichannel surface EMG study. Scand J Med Sci Sports. 2023;33:954-965. doi:10.1111/sms.14326