SlideShare a Scribd company logo
1 of 1
Amber Blakeslee, Nicholas Kunkel, Cassidy Younker, Ryan Wendell
                                                                    Geography 416: Cartographic Design, Southern Illinois University Carbondale, Fall 2011


Abstract                                                                           Methods                                                                                                                                                                                                         Results & Discussion
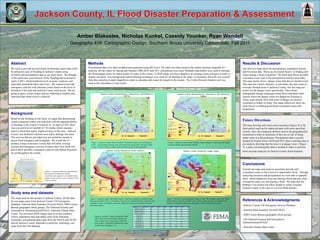
We want to provide an assessment on alternate routes that could                    Precipitation data were data scrubbed and organized using MS Excel. The table was then joined to the station structure shapefile for                                                                            Our first two maps show the precipitation, population density
be utilized in case of flooding in Jackson County using                            analysis. 3D bar charts for Spring and Summer 2009,2010, and 2011 calculations were used. Multiple-ring buffers were used to estimate                                                                           and Elevation data. These are all crucial factors in finding safe
elevation and precipitation data as our main focus. We thought                     the flood danger zones for major bodies of water in the county. A DEM image was then clipped to an existing county polygon in order to                                                                          routes during a flood evacuation. The third map shows possible
of this particular issue because of the flooding that occurred in                  display elevation. Text background callout labeling techniques were used for all labeling in the maps. A Geometric Network was created                                                                          evacuation routes due to the precipitation and elevation data.
April of 2011 which hindered travel on many roadways and                           from the centerline (roads) shapefile in order to calculate safe routes for people in the county. The Utility Network Analyst tool was                                                                          The map clearly shows danger zones that drivers should avoid.
especially around the lakes and rivers. We wanted to provide                       used in the calculation of said routes.                                                                                                                                                                         This map also clearly displays, in red marks, the safe routes to
emergency vehicles with alternate routes based on the level of                                                                                                                                                                                                                                     evacuate flooded areas in Jackson County. Our last map just
elevation of the land and Jackson County land layout. We are                                                                                                                                                                                                                                       points out the danger zones specifically. These better
going to query certain routes and use buffering to display and                                                                                                                                                                                                                                     cartographic design techniques break down and better label
represent that where travel is allowed                                                                                                                                                                                                                                                             exactly where the danger zones for dangerous flooding is.
                                                                                                                                                                                                                                                                                                   These maps clearly show that areas of danger are directly
                                                                                                                                                                                                                                                                                                   correlated to bodies of water. Our maps effectively show the
                                                                                                                                                                                                                                                                                                   main factors in finding good flood evacuation routes and
                                                                                                                                                                                                                                                                                                   preparation.
Background
Based on the flooding of last April, we argue that determining
sound evacuation routes will help deal with the unpredictability
                                                                                                                                                                                                                                                                                                   Future Directions
of flooding in the county of Jackson IL. In April of 2011 there                                                                                                                                                                                                                                    The map showing safe routes and evacuation (figure 4) is far
was a record level of rainfall of 7.45 inches which caused a                                                                                                                                                                                                                                       from perfect and can be improved upon with more specified
massive flood that nearly wiped out most of the area. Jackson                                                                                                                                                                                                                                      criteria. Also, the temporary shelters need to be geographically
County was declared a disaster area and in damage was done.                                                                                                                                                                                                                                        monitored in order to determine if they are at risk of being
The services that are provided now are useful but mostly to                                                                                                                                                                                                                                        under water in a flood disaster. Precipitation data is greatly
assess flood insurance and floodplain. We would like to                                                                                                                                                                                                                                            needed for Grand Tower (2010 and 2011 data is missing) due to
                                                                                     Figure 2: Jackson County Flood Variables. Precipitation data were calculated in                                           Figure 3: Jackson County Flood Variables. Same as figure 2. June, July and August
produce a map of Jackson County that will allow average                              inches . The population density units are persons per square mile. Elevation range                                        consist of Summer precipitation months.                                             our analysis showing that the town is in danger zone 1 (figure
citizens and emergency services to assess their own flood risk                       is from 97 feet to 260 feet. March, April and May consist of Spring months.                                                                                                                                   5). Lastly, soil and aquifer data is needed in order to perform
and to show possible evacuation routes to safe fallout structures
                                                                                                                                                                                                                                                                                                   more accurate analyses on Jackson County flood disasters.
set up throughout the county.


                                                                                                                                                                                                                                                                                                   Conclusions
                                                                                                                                                                                                                                                                                                   Overall our maps and analysis accurately provide safe
                                 Figure 1: A general reference map showing
                                 the locations of temporary shelters.
                                                                                                                                                                                                                                                                                                   evacuation routes in the event of a catastrophic flood.. Through
                                 Centerline road segments were added to give                                                                                                                                                                                                                       analyzing elevation and precipitation we were able to spatially
                                 people an idea of how to get to shelters in the                                                                                                                                                                                                                   show where dangerous areas are during a flood and also what
                                 event of a flood.
                                                                                                                                                                                                                                                                                                   evacuation routes are safe during a flood. We hope that the
                                                                                                                                                                                                                                                                                                   finding is our project can allow people to safely evacuate
                                                                                                                                                                                                                                                                                                   Jackson county in the case of a severe flood disaster.

Study area and datasets
The study area for this project is Jackson County. All the data                     Figure 4: Jackson County Safe Route scenario. Red lines represent calculated routes                                       Figure 5: Jackson County Immediate Danger Zones. These danger zones were hand-
for our maps came from Jackson County CSI Emergency                                 based on specified criteria. A Geometric Network was created from the centerline road                                     picked based on overlap of buffer zones and low lying elevation. According to the    References & Acknowledgments
                                                                                    shapefile in order to calculate said routes. Black dots represent the shelters that the                                   analysis, Grand Tower possesses the greater risk for a flood in the county.
Database, National Data Seamless Viewer(USGS), 2000 Census                          safe routes lead to.                                                                                                                                                                                           -Jackson County CSI Emergency Service Database
                                                                                                                                                    STATION NAME        YEAR          MARCH       APRIL       MAY.          JUNE          JULY          AUGUST
Bureau geographic block groups, The National Oceanic and                                                                                        CARBONDALE SEWAGE PLT          2006        9.24        3.48          4.71           1.4          9.77            2.04
                                                                                                                                                CARBONDALE SEWAGE PLT          2007        1.54        4.04          3.01          5.58          2.22            1.18
Atmospheric Administration(NOAA), National Climate Data                                                                                         CARBONDALE SEWAGE PLT
                                                                                                                                                CARBONDALE SEWAGE PLT
                                                                                                                                                                               2008
                                                                                                                                                                               2009
                                                                                                                                                                                          11.76
                                                                                                                                                                                            2.8
                                                                                                                                                                                                       7.29
                                                                                                                                                                                                       7.02
                                                                                                                                                                                                                     6.92
                                                                                                                                                                                                                     8.44
                                                                                                                                                                                                                                   1.62
                                                                                                                                                                                                                                   4.76
                                                                                                                                                                                                                                                 5.68
                                                                                                                                                                                                                                                 7.16
                                                                                                                                                                                                                                                                 3.19
                                                                                                                                                                                                                                                                 6.93
                                                                                                                                                                                                                                                                                                   -National Data Seamless Viewer(USGS)
                                                                                                                                                CARBONDALE SEWAGE PLT          2010        5.08        3.29          5.84          3.59          1.69            2.83
Center. The elevation DEM image came from the seamless                                                                                          CARBONDALE SEWAGE PLT
                                                                                                                                                    GRAND TWR 2 N
                                                                                                                                                                               2011
                                                                                                                                                                               2006
                                                                                                                                                                                           5.34
                                                                                                                                                                                          11.55
                                                                                                                                                                                                      14.84
                                                                                                                                                                                                        2.2
                                                                                                                                                                                                                     7.41
                                                                                                                                                                                                                     4.31
                                                                                                                                                                                                                                   7.93
                                                                                                                                                                                                                                   2.38
                                                                                                                                                                                                                                                    0
                                                                                                                                                                                                                                                  6.6
                                                                                                                                                                                                                                                                    0
                                                                                                                                                                                                                                                                 1.01                              -2000 Census Bureau geographic block groups
viewer, population data and tables came from American                                     Figure 6: Jackson County Precipitation Data               GRAND TWR 2 N              2007        1.88        2.67          2.12          3.08          2.15            1.58
                                                                                                                                                    GRAND TWR 2 N              2008        8.07        6.69          4.83          1.69          5.55            2.18
                                                                                          Table. Only spring and summer months are                  GRAND TWR 2 N              2009        2.55        4.26           6.7             3             2            3.96
                                                                                                                                                                                                                                                                                                   -The National Oceanic and Atmospheric
Factfinder, precipitation data came from the NOAA and NCDC,                               shown. Data were converted into inches for                GRAND TWR 2 N
                                                                                                                                                  MURPHYSBORO 2 SW
                                                                                                                                                                               2011
                                                                                                                                                                               2006
                                                                                                                                                                                              0
                                                                                                                                                                                           8.88
                                                                                                                                                                                                          0
                                                                                                                                                                                                       2.84
                                                                                                                                                                                                                        0
                                                                                                                                                                                                                     3.25
                                                                                                                                                                                                                                      0
                                                                                                                                                                                                                                   2.43
                                                                                                                                                                                                                                                    0
                                                                                                                                                                                                                                                 7.06
                                                                                                                                                                                                                                                                    0
                                                                                                                                                                                                                                                                 1.68

and all Jackson County shapefiles (centerline, hydrology, etc)                            each station: Carbondale, Murphysboro and               MURPHYSBORO 2 SW
                                                                                                                                                  MURPHYSBORO 2 SW
                                                                                                                                                                               2007
                                                                                                                                                                               2008
                                                                                                                                                                                            2.6
                                                                                                                                                                                           9.75
                                                                                                                                                                                                       3.85
                                                                                                                                                                                                       1.85
                                                                                                                                                                                                                     2.57
                                                                                                                                                                                                                     4.27
                                                                                                                                                                                                                                      0
                                                                                                                                                                                                                                      0
                                                                                                                                                                                                                                                 0.93
                                                                                                                                                                                                                                                    0
                                                                                                                                                                                                                                                                 1.54
                                                                                                                                                                                                                                                                    0
                                                                                                                                                                                                                                                                                                   Administration(NOAA)
                                                                                          Grand Tower (see figure 2-3).                           MURPHYSBORO 2 SW             2009        2.27        6.11          8.29          3.95          5.31            3.75
came from the CSI database.                                                                                                                       MURPHYSBORO 2 SW
                                                                                                                                                  MURPHYSBORO 2 SW
                                                                                                                                                                               2010
                                                                                                                                                                               2011
                                                                                                                                                                                           4.55
                                                                                                                                                                                           4.63
                                                                                                                                                                                                       2.56
                                                                                                                                                                                                      15.04
                                                                                                                                                                                                                     4.26
                                                                                                                                                                                                                     7.37
                                                                                                                                                                                                                                   4.69
                                                                                                                                                                                                                                   7.24
                                                                                                                                                                                                                                                 1.28
                                                                                                                                                                                                                                                    0
                                                                                                                                                                                                                                                                 3.45
                                                                                                                                                                                                                                                                    0                              -National Climate Data Center

More Related Content

Viewers also liked

Cometencias dos cuadros
Cometencias dos cuadrosCometencias dos cuadros
Cometencias dos cuadrosdckyam
 
Funciones más complejas. Provedores
Funciones más complejas. ProvedoresFunciones más complejas. Provedores
Funciones más complejas. ProvedoresVeroAyala6
 
ಯಹೂದಿಯ ಇಸ್ಲಾಮ್ ಸ್ವೀಕಾರ ಮುಹಮ್ಮದ್ [ಸ]ರವರ ಸ್ವಭಾವ ನೋಡಿ 4
ಯಹೂದಿಯ ಇಸ್ಲಾಮ್ ಸ್ವೀಕಾರ   ಮುಹಮ್ಮದ್ [ಸ]ರವರ ಸ್ವಭಾವ ನೋಡಿ 4ಯಹೂದಿಯ ಇಸ್ಲಾಮ್ ಸ್ವೀಕಾರ   ಮುಹಮ್ಮದ್ [ಸ]ರವರ ಸ್ವಭಾವ ನೋಡಿ 4
ಯಹೂದಿಯ ಇಸ್ಲಾಮ್ ಸ್ವೀಕಾರ ಮುಹಮ್ಮದ್ [ಸ]ರವರ ಸ್ವಭಾವ ನೋಡಿ 4FAHIM AKTHAR ULLAL
 
ವಿಸ್ವಾಸದ ರುಚಿ
ವಿಸ್ವಾಸದ ರುಚಿವಿಸ್ವಾಸದ ರುಚಿ
ವಿಸ್ವಾಸದ ರುಚಿFAHIM AKTHAR ULLAL
 
La soledad y shakespeare 2
La soledad y shakespeare 2La soledad y shakespeare 2
La soledad y shakespeare 2:)
 
catch Djokovic vs Gasquet live actions
catch Djokovic vs Gasquet live actions catch Djokovic vs Gasquet live actions
catch Djokovic vs Gasquet live actions brockbenson54
 
ಭರವಸೆ [ಅಮಾನ] ಒಂದು ನಿಜ ಕತೆ 1
ಭರವಸೆ [ಅಮಾನ]   ಒಂದು ನಿಜ ಕತೆ 1ಭರವಸೆ [ಅಮಾನ]   ಒಂದು ನಿಜ ಕತೆ 1
ಭರವಸೆ [ಅಮಾನ] ಒಂದು ನಿಜ ಕತೆ 1FAHIM AKTHAR ULLAL
 
Programa mannto.
Programa mannto.Programa mannto.
Programa mannto.102viajero
 
Enrolmen 2014
Enrolmen 2014Enrolmen 2014
Enrolmen 2014adiq1901
 

Viewers also liked (16)

Cometencias dos cuadros
Cometencias dos cuadrosCometencias dos cuadros
Cometencias dos cuadros
 
Scan
ScanScan
Scan
 
Funciones más complejas. Provedores
Funciones más complejas. ProvedoresFunciones más complejas. Provedores
Funciones más complejas. Provedores
 
ಯಹೂದಿಯ ಇಸ್ಲಾಮ್ ಸ್ವೀಕಾರ ಮುಹಮ್ಮದ್ [ಸ]ರವರ ಸ್ವಭಾವ ನೋಡಿ 4
ಯಹೂದಿಯ ಇಸ್ಲಾಮ್ ಸ್ವೀಕಾರ   ಮುಹಮ್ಮದ್ [ಸ]ರವರ ಸ್ವಭಾವ ನೋಡಿ 4ಯಹೂದಿಯ ಇಸ್ಲಾಮ್ ಸ್ವೀಕಾರ   ಮುಹಮ್ಮದ್ [ಸ]ರವರ ಸ್ವಭಾವ ನೋಡಿ 4
ಯಹೂದಿಯ ಇಸ್ಲಾಮ್ ಸ್ವೀಕಾರ ಮುಹಮ್ಮದ್ [ಸ]ರವರ ಸ್ವಭಾವ ನೋಡಿ 4
 
ವಿಸ್ವಾಸದ ರುಚಿ
ವಿಸ್ವಾಸದ ರುಚಿವಿಸ್ವಾಸದ ರುಚಿ
ವಿಸ್ವಾಸದ ರುಚಿ
 
Toxicologia hoy
Toxicologia hoyToxicologia hoy
Toxicologia hoy
 
La soledad y shakespeare 2
La soledad y shakespeare 2La soledad y shakespeare 2
La soledad y shakespeare 2
 
Comandos linux
Comandos linuxComandos linux
Comandos linux
 
17° congresso manifesto
17° congresso    manifesto17° congresso    manifesto
17° congresso manifesto
 
catch Djokovic vs Gasquet live actions
catch Djokovic vs Gasquet live actions catch Djokovic vs Gasquet live actions
catch Djokovic vs Gasquet live actions
 
Expo . google chrome
Expo . google chromeExpo . google chrome
Expo . google chrome
 
ಭರವಸೆ [ಅಮಾನ] ಒಂದು ನಿಜ ಕತೆ 1
ಭರವಸೆ [ಅಮಾನ]   ಒಂದು ನಿಜ ಕತೆ 1ಭರವಸೆ [ಅಮಾನ]   ಒಂದು ನಿಜ ಕತೆ 1
ಭರವಸೆ [ಅಮಾನ] ಒಂದು ನಿಜ ಕತೆ 1
 
Programa mannto.
Programa mannto.Programa mannto.
Programa mannto.
 
Fotos teque2011
Fotos teque2011Fotos teque2011
Fotos teque2011
 
Mark krstich adi
Mark krstich adiMark krstich adi
Mark krstich adi
 
Enrolmen 2014
Enrolmen 2014Enrolmen 2014
Enrolmen 2014
 

Emergency Management

  • 1. Amber Blakeslee, Nicholas Kunkel, Cassidy Younker, Ryan Wendell Geography 416: Cartographic Design, Southern Illinois University Carbondale, Fall 2011 Abstract Methods Results & Discussion We want to provide an assessment on alternate routes that could Precipitation data were data scrubbed and organized using MS Excel. The table was then joined to the station structure shapefile for Our first two maps show the precipitation, population density be utilized in case of flooding in Jackson County using analysis. 3D bar charts for Spring and Summer 2009,2010, and 2011 calculations were used. Multiple-ring buffers were used to estimate and Elevation data. These are all crucial factors in finding safe elevation and precipitation data as our main focus. We thought the flood danger zones for major bodies of water in the county. A DEM image was then clipped to an existing county polygon in order to routes during a flood evacuation. The third map shows possible of this particular issue because of the flooding that occurred in display elevation. Text background callout labeling techniques were used for all labeling in the maps. A Geometric Network was created evacuation routes due to the precipitation and elevation data. April of 2011 which hindered travel on many roadways and from the centerline (roads) shapefile in order to calculate safe routes for people in the county. The Utility Network Analyst tool was The map clearly shows danger zones that drivers should avoid. especially around the lakes and rivers. We wanted to provide used in the calculation of said routes. This map also clearly displays, in red marks, the safe routes to emergency vehicles with alternate routes based on the level of evacuate flooded areas in Jackson County. Our last map just elevation of the land and Jackson County land layout. We are points out the danger zones specifically. These better going to query certain routes and use buffering to display and cartographic design techniques break down and better label represent that where travel is allowed exactly where the danger zones for dangerous flooding is. These maps clearly show that areas of danger are directly correlated to bodies of water. Our maps effectively show the main factors in finding good flood evacuation routes and preparation. Background Based on the flooding of last April, we argue that determining sound evacuation routes will help deal with the unpredictability Future Directions of flooding in the county of Jackson IL. In April of 2011 there The map showing safe routes and evacuation (figure 4) is far was a record level of rainfall of 7.45 inches which caused a from perfect and can be improved upon with more specified massive flood that nearly wiped out most of the area. Jackson criteria. Also, the temporary shelters need to be geographically County was declared a disaster area and in damage was done. monitored in order to determine if they are at risk of being The services that are provided now are useful but mostly to under water in a flood disaster. Precipitation data is greatly assess flood insurance and floodplain. We would like to needed for Grand Tower (2010 and 2011 data is missing) due to Figure 2: Jackson County Flood Variables. Precipitation data were calculated in Figure 3: Jackson County Flood Variables. Same as figure 2. June, July and August produce a map of Jackson County that will allow average inches . The population density units are persons per square mile. Elevation range consist of Summer precipitation months. our analysis showing that the town is in danger zone 1 (figure citizens and emergency services to assess their own flood risk is from 97 feet to 260 feet. March, April and May consist of Spring months. 5). Lastly, soil and aquifer data is needed in order to perform and to show possible evacuation routes to safe fallout structures more accurate analyses on Jackson County flood disasters. set up throughout the county. Conclusions Overall our maps and analysis accurately provide safe Figure 1: A general reference map showing the locations of temporary shelters. evacuation routes in the event of a catastrophic flood.. Through Centerline road segments were added to give analyzing elevation and precipitation we were able to spatially people an idea of how to get to shelters in the show where dangerous areas are during a flood and also what event of a flood. evacuation routes are safe during a flood. We hope that the finding is our project can allow people to safely evacuate Jackson county in the case of a severe flood disaster. Study area and datasets The study area for this project is Jackson County. All the data Figure 4: Jackson County Safe Route scenario. Red lines represent calculated routes Figure 5: Jackson County Immediate Danger Zones. These danger zones were hand- for our maps came from Jackson County CSI Emergency based on specified criteria. A Geometric Network was created from the centerline road picked based on overlap of buffer zones and low lying elevation. According to the References & Acknowledgments shapefile in order to calculate said routes. Black dots represent the shelters that the analysis, Grand Tower possesses the greater risk for a flood in the county. Database, National Data Seamless Viewer(USGS), 2000 Census safe routes lead to. -Jackson County CSI Emergency Service Database STATION NAME YEAR MARCH APRIL MAY. JUNE JULY AUGUST Bureau geographic block groups, The National Oceanic and CARBONDALE SEWAGE PLT 2006 9.24 3.48 4.71 1.4 9.77 2.04 CARBONDALE SEWAGE PLT 2007 1.54 4.04 3.01 5.58 2.22 1.18 Atmospheric Administration(NOAA), National Climate Data CARBONDALE SEWAGE PLT CARBONDALE SEWAGE PLT 2008 2009 11.76 2.8 7.29 7.02 6.92 8.44 1.62 4.76 5.68 7.16 3.19 6.93 -National Data Seamless Viewer(USGS) CARBONDALE SEWAGE PLT 2010 5.08 3.29 5.84 3.59 1.69 2.83 Center. The elevation DEM image came from the seamless CARBONDALE SEWAGE PLT GRAND TWR 2 N 2011 2006 5.34 11.55 14.84 2.2 7.41 4.31 7.93 2.38 0 6.6 0 1.01 -2000 Census Bureau geographic block groups viewer, population data and tables came from American Figure 6: Jackson County Precipitation Data GRAND TWR 2 N 2007 1.88 2.67 2.12 3.08 2.15 1.58 GRAND TWR 2 N 2008 8.07 6.69 4.83 1.69 5.55 2.18 Table. Only spring and summer months are GRAND TWR 2 N 2009 2.55 4.26 6.7 3 2 3.96 -The National Oceanic and Atmospheric Factfinder, precipitation data came from the NOAA and NCDC, shown. Data were converted into inches for GRAND TWR 2 N MURPHYSBORO 2 SW 2011 2006 0 8.88 0 2.84 0 3.25 0 2.43 0 7.06 0 1.68 and all Jackson County shapefiles (centerline, hydrology, etc) each station: Carbondale, Murphysboro and MURPHYSBORO 2 SW MURPHYSBORO 2 SW 2007 2008 2.6 9.75 3.85 1.85 2.57 4.27 0 0 0.93 0 1.54 0 Administration(NOAA) Grand Tower (see figure 2-3). MURPHYSBORO 2 SW 2009 2.27 6.11 8.29 3.95 5.31 3.75 came from the CSI database. MURPHYSBORO 2 SW MURPHYSBORO 2 SW 2010 2011 4.55 4.63 2.56 15.04 4.26 7.37 4.69 7.24 1.28 0 3.45 0 -National Climate Data Center