Downloaded 176 times
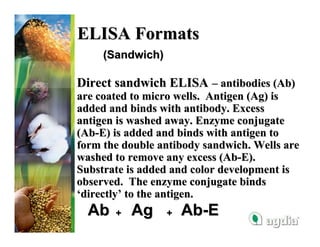
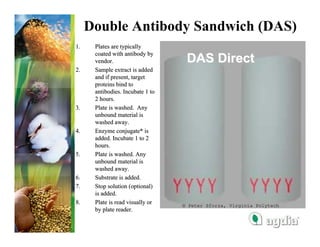
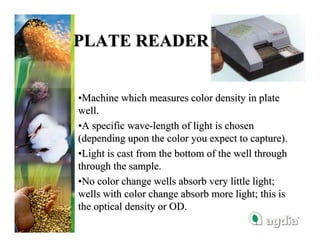

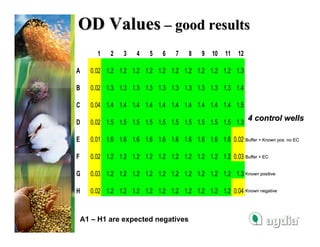


ELISA (enzyme-linked immunosorbent assay) is an immunological test that uses an enzyme-linked antibody to detect the presence of a target protein. It involves coating a plate with antibodies that bind to the target antigen if present in a sample. An enzyme-conjugated antibody is then added to bind to the antigen, forming a "sandwich." A substrate is added that changes color in proportion to the amount of enzyme present, allowing quantification of antigen levels. The plate is then read with a plate reader to measure color development and determine if and how much of the target antigen is present in samples.


