SlideShare a Scribd company logo
1 of 459
Elevated Blood Lead Levels in Children Associated
With the Flint Drinking Water Crisis: A Spatial
Analysis of Risk and Public Health Response
Mona Hanna-Attisha, MD, MPH, Jenny LaChance, MS, Richard
Casey Sadler, PhD, and Allison Champney Schnepp, MD
Objectives. We analyzed differences in pediatric elevated blood
lead level incidence
before and after Flint, Michigan, introduced a more corrosive
water source into an aging
water system without adequate corrosion control.
Methods. We reviewed blood lead levels for children younger
than 5 years before
(2013) and after (2015) water source change in Greater Flint,
Michigan. We assessed the
percentage of elevated blood lead levels in both time periods,
and identified geo-
graphical locations through spatial analysis.
Results. Incidence of elevated blood lead levels increased from
2.4% to 4.9% (P < .05)
after water source change, and neighborhoods with the highest
water lead levels ex-
perienced a 6.6% increase. No significant change was seen
outside the city. Geospatial
analysis identified disadvantaged neighborhoods as having the
greatest elevated blood
lead level increases and informed response prioritization during
the now-declared public
health emergency.
Conclusions. The percentage of children with elevated blood
lead levels increased
after water source change, particularly in socioeconomically
disadvantaged neighbor-
hoods. Water is a growing source of childhood lead exposure
because of aging infra-
structure. (Am J Public Health. 2016;106:283–290.
doi:10.2105/AJPH.2015.303003)
See also Rosner, p. 200.
In April 2014, the postindustrial city ofFlint, Michigan, under
state-appointed
emergency management, changed its water
supply from Detroit-supplied Lake Huron
water to the Flint River as a temporary
measure, awaiting a new pipeline to Lake
Huron in 2016. Intended to save money, the
change in source water severed a half-
century relationship with the Detroit Water
and Sewage Department. Shortly after the
switch to Flint River water, residents voiced
concerns regarding water color, taste, and
odor, and various health complaints in-
cluding skin rashes.1 Bacteria, including
Escherichia coli, were detected in the distri-
bution system, resulting in Safe Drinking
Water Act violations.2 Additional disinfec-
tion to control bacteria spurred formation of
disinfection byproducts including total tri-
halomethanes, resulting in Safe Drinking
Water Act violations for trihalomethane
levels.2
Water from the Detroit Water and
Sewage Department had very low corrosivity
for lead as indicated by low chloride, low
chloride-to-sulfate mass ratio, and presence
of an orthophosphate corrosion inhibitor.3,4
By contrast, Flint River water had high
chloride, high chloride-to-sulfate mass ratio,
and no corrosion inhibitor.5 Switching
from Detroit’s Lake Huron to Flint River
water created a perfect storm for lead leach-
ing into drinking water.6 The aging Flint
water distribution system contains a high
percentage of lead pipes and lead plumbing,
with estimates of lead service lines ranging
from 10% to 80%.7 Researchers from Virginia
Tech University reported increases in water
lead levels (WLLs),5 but changes in blood
lead levels (BLLs) were unknown.
Lead is a potent neurotoxin, and child-
hood lead poisoning has an impact on
many developmental and biological pro-
cesses, most notably intelligence, behavior,
and overall life achievement.8 With estimated
societal costs in the billions,9–11 lead poi-
soning has a disproportionate impact on
low-income and minority children.12 When
one considers the irreversible, life-altering,
costly, and disparate impact of lead exposure,
primary prevention is necessary to
eliminate exposure.13
Historically, the industrial revolution’s
introduction of lead into a host of products
has contributed to a long-running and
largely silent pediatric epidemic.14 With
lead now removed from gasoline and paint,
the incidence of childhood lead poisoning
has decreased.15 However, lead contamina-
tion of drinking water may be increasing
because of lead-containing water in-
frastructures, changes in water sources, and
changes in water treatment including disin-
fectant.16–18 A soluble metal, lead leaches into
drinking water via lead-based plumbing or
lead particles that detach from degrading
plumbing components. (“Plumbing” is
derived from the Latin word for lead,
ABOUT THE AUTHORS
Mona Hanna-Attisha and Allison Champney Schnepp are with
Hurley Children’s Hospital/Michigan State University
College of Human Medicine, Department of Pediatrics and
Human Development, Flint, MI. Jenny LaChance is with Hurley
Medical Center Research, Flint. Richard Casey Sadler is with
Michigan State University College of Human Medicine,
Division of Public Health, Flint.
Correspondence should be sent to Mona Hanna-Attisha, MD,
MPH, FAAP, Hurley Medical Center, Pediatrics 3W, One
Hurley Plaza, Flint, MI 48503 (e-mail: [email protected]).
Reprints can be ordered at http://www.ajph.org by clicking the
“Reprints” link.
This article was accepted November 21, 2015.
doi: 10.2105/AJPH.2015.303003
February 2016, Vol 106, No. 2 AJPH Hanna-Attisha et al. Peer
Reviewed Research 283
AJPH RESEARCH
mailto:[email protected]
http://www.ajph.org
Kourt
Highlight
“plumbum.”) Lead was restricted in plumb-
ing material in 1986, but older homes and
neighborhoods may still contain lead
service lines, lead connections, lead solder, or
other lead-based plumbing materials. Lead
solubility and particulate release is highly
variable and depends on many factors in-
cluding water softness, temperature, and
acidity.19–21 The US Environmental Pro-
tection Agency (EPA) regulates lead in
public water supplies under the Safe Drinking
Water Act Lead and Copper Rule, which
requires action when lead levels reach 15 parts
per billion (ppb).
Lead in drinking water is different from
lead from other sources, as it disproportion-
ately affects developmentally vulnerable
children and pregnant mothers. Children can
absorb 40% to 50% of an oral dose of
water-soluble lead compared with 3% to 10%
for adults.22 In a dose–response relationship
for children aged 1 to 5 years, for every 1-ppb
increase in water lead, blood lead increases
35%.23 The greatest risk of lead in water may
be to infants on reconstituted formula.
Among infants drinking formula made from
tap water at 10 ppb, about 25% would ex-
perience a BLL above the Centers for Disease
Control and Prevention (CDC) elevated
blood lead level (EBLL) of 5 micrograms per
deciliter (mg/dL).24 Tap water may account
for more than 85% of total lead exposure
among infants consuming reconstituted
formula.25 A known abortifacient, lead has
also been implicated in increased fetal
deaths and reduced birth weights.26
As recommended by the CDC and
supported by the American Academy of
Pediatrics, blood lead screening is routine
for high-risk populations and for children
insured by Medicaid at age 1 and 2 years.27
The CDC-recommended screening ages
are based on child development (increased
oral–motor behavior), which places a child
most at risk for house-based lead exposure
(e.g., peeling paint, soil, dust). State and
national blood lead–screening programs,
however, do not adequately capture the
risk of lead in water because infants are at
greatest risk.
Armed with reports of elevated WLLs
and recognizing the lifelong consequences of
lead exposure, our research team sought to
analyze blood lead data before (pre) and
after (post) the water source switch with
a geographic information system (GIS) to
determine lead exposure risk and prioritize
responses. This research has immediate public
policy, public health, environmental, and
socioeconomic implications.
This research includes Flint, Michigan, and
surrounding municipalities in Genesee
County (Greater Flint). Greater Flint is a
postindustrial region of nearly 500 000 people
struggling from years of disinvestment by
the automobile industry and associated
manufacturing activities: the region has lost
77% of its manufacturing employment and
41% of employment overall since 1980.28
National and local data sources demonstrate
dismal indicators for children, especially
within Flint city limits.29–32 Greater Flint
ranks toward the bottom of the state in rates of
childhood poverty (42% in Flint vs 16.2% in
Michigan and 14.8% in the United States),
unemployment, violent crime, illicit drug
use, domestic violence, preterm births, infant
mortality, and overall health outcomes (81st
out of 82 Michigan counties).
Greater Flint’s struggles have been am-
plified by a history of racial discrimination,
whereby exclusionary housing practices were
common.33,34 Such attitudes toward in-
tegration later precipitated White flight and
emboldened home-rule governance,35,36
causing a massive decline in tax revenue for
the city. The declining industrial and resi-
dential tax bases strained the city’s ability to
provide basic services and reversed the public
health fortunes of the city and suburbs.37
Severely reduced city population densities
reduced water demand in the distribution
system, exacerbating problems with lead
corrosion.
METHODS
This retrospective study includes all chil-
dren younger than 5 years who had a BLL
processed through the Hurley Medical
Center’s laboratory, which runs BLLs for
most Genesee County children. The pre
time period (before the water source change)
was January 1, 2013, to September 15, 2013,
and the post time period (after the water
source change) was January 1, 2015, to
September 15, 2015. The primary study
group comprised children living within the
city of Flint (n = 1473; pre = 736; post = 737)
who received water from the city water
system. Children living outside the city where
the water source was unchanged served as
a comparison group (n = 2202; pre = 1210;
post = 992).
After institutional review board approval
and Health Insurance Portability and
Accountability Act waiver, we drew data
from the Epic electronic medical record
system including BLL, medical record
number, date of birth, date of blood draw,
full address, sex, and race. For each child,
only the highest BLL was maintained in the
data set. We coded timing (pre or post) of
the BLL on the basis of the date of blood draw.
We calculated age at time of blood draw.
We geocoded the data set with a dual-
range address locator, and manually con-
firmed accuracy of geocoded addresses. We
conducted a series of spatial joins to assign
participant records to Greater Flint munici-
palities and Flint wards (including those
with high WLL), enabling the calculation
of the number and percentage of children
with EBLLs in each geographic region for
both time periods. The reference value for
EBLL was 5 mg/dL or greater. We identified
Flint wards with high WLLs with water
lead sampling maps.38 Wards 5, 6, and 7
had the highest WLLs; in each ward, more
than 25% of samples had a WLL higher than
15 ppb. We theorized that children living in
this combination of wards would have the
highest incidence of EBLLs (referred to as
“high WLL Flint”; the remainder of Flint
was referred to as “lower WLL Flint”).
We derived overall neighborhood-level
socioeconomic disadvantage from census
block group variables intended to measure
material and social deprivation. We calculated
these scores from an unweighted z score sum
of rates of lone parenthood, poverty, low
educational attainment, and unemployment
(adapted from Pampalon et al.39; used pre-
viously in Flint by Sadler et al.40), and assigned
these to each child on the basis of home
address. Positive values denote higher disad-
vantage, and negative values denote lower
disadvantage. Table 1 highlights the overall
socioeconomic disadvantage score compari-
son by time period and area.
We created spatial references for EBLL
risk and a predictive surface for BLL by using
GIS, providing the ability to see otherwise
invisible spatial–temporal patterns in envi-
ronmental exposure.17 Because of the need to
AJPH RESEARCH
284 Research Peer Reviewed Hanna-Attisha et al. AJPH
February 2016, Vol 106, No. 2
understand spatial variations and geo-
graphically target resources, we also ran
ordinary Kriging with a spherical semivario-
gram model on the entire data set for Greater
Flint, allowing interpolation of associated
BLL risks with lead in water. Previous
methods for evaluating spatial variation in
lead levels have ranged from multivariable
analyses at the individual level41 to in-
terpolation methods such as inverse distance
weighting42 and Kriging.43 Given our as-
sumption that lead risk is spatially correlated in
Greater Flint because of the age and condition
of pipes, interpolation methods are appro-
priate for building a preliminary risk surface.
Both inverse distance weighting and Kriging
derive such surfaces by calculating values at
unmeasured locations based on weighting
nearby measured values more strongly than
distant values.44 Whereas inverse distance
weighting is a deterministic procedure and
relies on predetermined mathematical for-
mulae, Kriging has the added sophistication
of using geostatistical models that consider
spatial autocorrelation, thereby improving
accuracy of prediction surfaces (ArcGIS
Desktop version 10.3, Environmental Sys-
tems Research Institute, Redlands, CA).
As well, Kriging can be run with relatively
few input points: adequate ranges fall be-
tween 30 and 100 total points, although
Kriging has been conducted with just 7.44
Our city of Flint sample included 736
children in the pre period and 737 children
in the post period, which amounts to a
density of approximately 22 points per square
mile. Kriging has become an increasingly
common method for measuring variations in
soil lead, and is given more in-depth treat-
ment elsewhere.45 To examine change in
proportion of children with EBLL from the
pre to post time periods, we used c2 analysis
with continuity correction for each area
(outside Flint, all Flint, high WLL Flint,
and lower WLL Flint). In addition, we ex-
amined differences in overall socioeconomic
disadvantage scores from the pre to post
time periods by using the independent t test.
Finally, we used both c2 analysis with con-
tinuity correction and 1-way ANOVA to
assess demographic differences by area. We
used post hoc least significant difference
analysis following statistically significant
1-way ANOVAs.
RESULTS
We uncovered a statistically significant
increase in the proportion of Flint children
with EBLL from the pre period to the pro-
portion of Flint children in the post period.
In the pre period, 2.4% of children in Flint
had an EBLL; in the post period, 4.9% of
children had an EBLL (P < .05). By compar-
ison, outside of Flint water, the change in
EBLL was not statistically significant (0.7% to
1.2%; P > .05). In high WLL Flint, EBLL
increasedfrom4.0%to10.6%(P < .05).Figure1
shows the EBLL percentage change per area.
Results of the GIS analyses show signifi-
cant clustering of EBLLs within the Flint
city limits. According to ordinary Kriging,
Figure 2 shows a predicted surface based on
observations of actual child BLL geocoded
to home address to visualize BLL variation
over space (measured in mg/dL). The darkest
shades of red represent the highest risk for
EBLL based on existing observations. Outside
Flint, the entire county falls entirely within
the lowest half of the range (in shades of blue);
the only locations where predicted BLL is
greater than 1.75 mg/dL is within Flint city
limits.
Within Figure 2, each ward is also labeled
according to the percentage of water samples
that exceeded 15 ppb. The areas with the
highest WLLs strongly coincide with the
areas with the highest predicted BLLs. In
addition, the high percentage of EBLL in
wards 5, 6, and 7 also correspond with the
high WLLs in wards 5, 6, and 7 (the labels
in Figure 2). Table 2 shows ward-specific
WLLs, pre period and post period EBLL
percentages, and predicted BLL and predicted
change in BLL from Kriging.
Areas experiencing the highest predicted
BLL in the post period (Figure 2) are generally
also areas with greatest change in predicted
BLL (measured in mg/dL) when compared
with the pre period (Table 2; Figure A,
available as a supplement to the online ver-
sion of this article at http://www.ajph.org).
Figure A quantifies this rate of change with
a green to red scale: large increases are
shown in increasingly darker shades of red,
whereas large decreases are shown in in-
creasingly darker shades of green. These
once again match with city wards that ex-
perienced greater rates of EBLL percentage
increase (Figure 1, Table 2). In wards 5 and 6
(which experienced a predicted 0.51 and
0.27 mg/dL increase, respectively), the EBLL
percentage more than tripled. In ward 5, the
EBLL percentage increased from 4.9% to
15.7% (P < .05). The area of intersection
between wards 3, 4, and 5 (in the east side of
the city) also appeared high in the Kriging
analysis of Figure 2, and with a different
unit of aggregation this neighborhood would
also exhibit a significant increase in EBLL
percentage. Ward 7 had high pre period
and post period EBLL percentage levels
above 5% (with a particularly high rate in
the western portion of the ward). Citywide,
TABLE 1—Demographic Comparison of the Time Periods
Before (Pre) and After (Post) Water
Source Change From Detroit-Supplied Lake Huron Water to the
Flint River, by Area:
Flint, MI, 2013 and 2015
Outside Flint All Flint High WLL Flint Lower WLL Flint
Characteristic Pre Post Pre Post Pre Post Pre Post
Gender, %
Male 51.6 49.5 48.6 52.9 47.6 54.4 49.1 52.3
Female 48.4 50.5 51.4 47.1 52.4 45.6 50.9 47.7
Race/ethnicity, %
African American 24.3 24.5 69.4 70.6 74.9 78.8 67.0 66.9
Other categories 75.7 75.5 30.6 29.4 25.1 21.2 33.0 33.1
Age, y, mean 1.89 1.83 2.09 2.06 2.06 2.02 2.11 2.07
Overall socioeconomic
disadvantage score
–0.83 –0.98 2.94 2.88 2.18 2.39 3.28 3.10
Note.WLL = water lead level. No statistically significant
differences were found in any pre–post value within
any of the 4 geographical areas.
AJPH RESEARCH
February 2016, Vol 106, No. 2 AJPH Hanna-Attisha et al. Peer
Reviewed Research 285
http://www.ajph.org
4 wards (1, 4, 7, and 9) experienced decreases
in predicted BLL, 3 wards (2, 5, and 6)
experienced large increases, and 2 wards
(3 and 8) remained largely the same (Figure A).
Overall, statistically significant differences
exist between the areas examined (outside
Flint, high WLL Flint, and lower WLL Flint)
in all demographic characteristics except sex.
The overall percentage of African American
children is 24.4% outside Flint, compared
with 76.8% in high WLL Flint and 67.0%
in lower WLL Flint (P < .001). Children
outside Flint were younger (mean = 1.86
years [SD = 1.10]) than high WLL Flint
(mean = 2.04 years [SD = 1.02]) and lower
WLL Flint (mean = 2.09 years [SD = 1.07];
P < .001). Differences in overall socioeco-
nomic disadvantage scores are likewise sig-
nificant (P < .001). Post hoc least significant
difference analysis shows statistically signifi-
cant differences for overall socioeconomic
disadvantage between outside Flint and
high WLL Flint (P < .001), between outside
Flint and lower WLL Flint (P < .001), and
between high WLL Flint and lower WLL
Flint (P < .001).
DISCUSSION
Our findings reveal a striking increase in
the percentage of Flint children with EBLL
when we considered identical seasons
before and after the water source switch, with
no statistically significant increase in EBLL
outside Flint. The spatial and statistical ana-
lyses highlight the greatest EBLL increase
within certain wards of Flint, which corre-
spond to the areas of elevated WLLs.
A review of alternative sources of lead
exposure reveals no other potential envi-
ronmental confounders during the same time
period. Demolition projects by the Genesee
County Land Bank Authority (Heidi
Phaneuf, written communication, October
29, 2015) showed no spatial relationship to
the areas of increased EBLL rates. As well,
no known new lead-producing factories
nor changes in indoor lead remediation
programs were implemented during the study
period. Although Flint has a significant
automobile history, the historical location of
potentially lead-using manufacturing (e.g.,
battery plants, paint and pigment storage,
production plants) do not align with current
exposures.
Because there was no known alternative
source for increased lead exposure during this
time period, the geospatial WLL results, the
innate corrosive properties of Flint River
water, and, most importantly, the lack of
corrosion control, our findings strongly
implicate the water source change as the
probable cause for the dramatic increase in
EBLL percentage.
As in many urban areas with high levels of
socioeconomic disadvantage and minority
populations,46 we found a preexisting dis-
parity in lead poisoning. In our pre water
source switch data, the EBLL percentage in
Flint was 2.4% compared with 0.7% outside
Flint. This disparity widened with a post
water source switch Flint EBLL of 4.8%, with
no change in socioeconomic or demographic
variables (Table 1). Flint children already
suffer from risk factors that innately increase
their lead exposure: poor nutrition, con-
centrated poverty, and older housing stock.
With limited protective measures, such as
low rates of breastfeeding,47,48 and scarce
resources for water alternatives, lead in water
further exacerbates preexisting risk factors.
Increased lead-poisoning rates have profound
implications for the life course potential of
an entire cohort of Flint children already
rattled with toxic stress contributors (e.g.,
poverty, violence, unemployment, food
insecurity). This is particularly troublesome
in light of recent findings of the epigenetic
effects of lead exposure on one’s
grandchildren.49
The Kriging analysis showed the highest
predicted BLLs within the city along a wide
swath north and west of downtown. This
area has seen significant demographic change,
an increase in poverty, and an increase in
vacant properties, especially over the past
25 years (Richard Sadler, written commu-
nication, October 5, 2015). Higher BLLs
were also predicted northeast of downtown
and in other older neighborhoods where
poverty and vacancy rates have been high for
many decades. Significantly, the biggest
changes in predicted BLL since 2013 were
also found in these impoverished neighbor-
hoods; more stable neighborhoods in the
far north and south of the city may have
experienced improved predicted BLLs be-
cause of prevention efforts taken by the
more-often middle-class residents in
response to the water source change. Of
considerable interest is that the areas shown
as having the best public health indices by
Board and Dunsmore in Figure 2 of their
1948 article37 are virtually identical to the
areas with the worst lead levels today.
After our preliminary zip code–based
findings (pre to post water source switch
0.7
2.4
4
1.8
1.2
4.9
10.6
2.3
0
2
4
6
8
10
12
Outside Flint All Flint* High WLL Flint* Lower WLL Flint
Pe
rc
en
ta
g
e
Pre Post
Area Examined
Note. WLL = water lead level.
*P < .05.
FIGURE 1—Comparison of Elevated Blood Lead Level
Percentage, Before (Pre) and After
(Post) Water Source Change From Detroit-Supplied Lake Huron
Water to the Flint River:
Flint, MI, 2013 and 2015
AJPH RESEARCH
286 Research Peer Reviewed Hanna-Attisha et al. AJPH
February 2016, Vol 106, No. 2
EBLL = 2.1% to 4.0%; P < .05) were shared
at a press conference,50 the City of Flint and
the Genesee County Health Department
released health advisories,51 and the county
health department subsequently declared
a public health emergency.52 Shortly after,
the State of Michigan released an action
plan with short- and long-term solutions
focusing on additional sampling, filter dis-
tribution, and corrosion control.53 One
week later, Michigan’s governor revealed
WLLs in 3 schools to be in the toxic range
with 1 school showing a water lead level of
101 ppb, almost 7 times the level that
requires remediation.54 A $12 million plan
to reconnect to Detroit’s water source was
announced.54
We undertook our current spatial analytic
approach to overcome limitations of zip
code boundaries and to develop a more
thorough understanding of specific areas in
Flint where EBLL risk is more severe (post
office addresses often do not align with
municipal boundaries in Michigan, and one
third of Flint mailing addresses are not in
the city of Flint). This spatial analysis is
valuable for understanding subneighborhood
patterns in EBLL risk because aggregation
by zip code or ward minimizes the richness
of spatial variation and creates artificial
barriers that may obscure hot spots (as in
the confluence of wards 3, 4, and 5).
Such use of spatial analysis for estimating
lead exposure risk has been used to target
blood lead–screening programs. In our case,
in addition to identifying areas of risk,
spatial analysis helps guide municipal and
nongovernmental relief efforts aimed at
identifying vulnerable populations in specific
neighborhoods for priority distribution of
resources (e.g., bottled water, filters, pre-
mixed formula).
Limitations
Our research contains a few limitations.
First, we may have underestimated water-
based lead exposure. Our sample included
all children younger than 5 years with blood
lead screening, although the greatest risk
from lead in water is in utero and during
infancy when lead screening is not done.
If lead screening were recommended at
a younger age (e.g., 6 or 9 months) for
children who live in homes with potential
lead piping or lead service lines, more children
with EBLL from water could be identified,
although state and national comparison
rates would be lacking. Second, lead
screening is not completed for all children.
It is mandated by Medicaid and
CDC-recommended for other high-risk
groups; such data may be skewed toward
higher-risk children and thus overestimate
EBLL, especially in non–high-risk areas.
Third, the underserved population of Flint
has significant housing instability: lead levels
may reflect previous environmental expo-
sure, and exposure often cannot be ade-
quately estimated on the basis of current
residence alone.55
Fourth, although large, our sample does
not reflect all lead screening from Flint.
We estimate that our data capture approxi-
mately 60% to 70% of the Michigan Child-
hood Lead Poisoning Prevention Program
data for Flint. Annual data released from
this program further support our findings,
revealing an annual decrease in EBLL per-
centage from May to April 2010 to 2011
until the same period in 2013 to 2014 (4.1%,
Ward 2 WLL = 25%
Ward 6 WLL = 28%
Ward 7 WLL = 28%
Ward 8 WLL = 20%
0.7–0.75 (more optimal)
0.76–1
1.01–1.25
1.26–1.5
1.51–1.75
1.76–2
2.01–2.25
2.26–2.5
2.51–2.75
2.76–3.36 (more hazardous)
*Nonresidential zones screened from results
*Ward labels indicate % of ward where
any water sample exceeded 15 ppb
Flint City Wards
Major streets
Predicted BLL Based on Ordinary Kriging (μg/dL)
Ward 9 WLL = 20%
0 0.25 0.5 1 Miles
N
Ward 5 WLL = 32%
Ward 3 WLL = 18%
Ward 4 WLL = 6%
Ward 1 WLL = 10%
Note. BLL = blood lead level; WLL = water lead level.
FIGURE 2—Predicted Surface of Child Blood Lead Level and
Ward-Specific Elevated Water
Lead Level After (Post) Water Source Change From Detroit-
Supplied Lake Huron Water
to the Flint River: Flint, MI, 2015
AJPH RESEARCH
February 2016, Vol 106, No. 2 AJPH Hanna-Attisha et al. Peer
Reviewed Research 287
3.3%, 2.7%, 2.2%, respectively56; Robert L.
Scott, e-mail correspondence, September 25,
2015). Following the water switch in April
2014, the 4-year declining trend (as seen
nationally) reversed with an annual EBLL
of 3.0%.
We found consistent results (with
control for age and methodology) when
we analyzed Michigan Childhood Lead
Poisoning Prevention Program data for
both high WLL Flint (EBLL percentage in-
creased: 6.6% to 9.6%) and outside Flint
(EBLL percentage remained virtually
unchanged: 2.2% to 2.3%). Our institution-
processed laboratory blood lead tests, how-
ever, had an even greater proportion of
children with EBLLs versus state data in the
post period. This may reflect that the BLLs
processed at Hurley Medical Center, the
region’s only safety-net public hospital,
represent a patient population most at risk
with limited resources to afford tap water
alternatives.
Conclusions and Future Research
Future research directions include con-
ducting more detailed geospatial analyses of
lead service-line locations with locations
of elevated BLLs and WLLs; repeating
identical spatial and statistical analyses in
the same time period in 2016 reflecting
changes associated with the health advisory
and return to Lake Huron source water;
analyzing feeding type (breastfed or recon-
stituted formula) for children with EBLLs;
analyzing cord blood lead of Flint newborns
compared with non-Flint newborns; and
conducting water lead testing from homes of
children with EBLLs.
A once celebrated cost-cutting move for
an economically distressed city, the water
source change has now wrought untold
economic, population health, and geo-
political burdens. With unchecked lead ex-
posure for more than 18 months, it is
fortunate that the duration was not longer
(as was the case in Washington, DC,’s lead-in-
water issue).16 Even so, the Flint drinking
water crisis is a dramatic failure of primary
prevention. The legal safeguards and regu-
lating bodies designed to protect vulnerable
populations from preventable lead exposure
failed.
The Lead and Copper Rule requires
water utilities to notify the state of a water
source or treatment change recognizing that
such changes can unintentionally have an
impact on the system’s corrosion control.57
Although a review is required before
implementing changes, the scope of risk as-
sessment is not specified and is subject to
misinterpretation. In response to the Flint
drinking water crisis, the EPA recently re-
leased a memo reiterating and clarifying the
need for states to conduct corrosion
control reviews before implementing
changes.58 This recommendation is especially
relevant for communities with aging in-
frastructures, usurped city governance, and
minimal water utility capacity; in such situ-
ations, there is an increased need for state
and federal expertise and oversight to support
decisions that protect population health.
Through vigilant public health efforts,
lead exposure has fallen dramatically over the
past 30 years.13 With the increasing recog-
nition that no identifiable BLL is safe and
without deleterious and irreversible health
outcomes,13 Healthy People 2020 identified
the elimination of EBLLs and underlying
disparities in lead exposure as a goal.59
Regrettably, our research reveals that the
potentially increasing threat of lead in
drinking water may dampen the significant
strides in childhood lead-prevention efforts.
As our aging water infrastructures continue
to decay, and as communities across the
nation struggle with finances and water
supply sources, the situation in Flint,
Michigan, may be a harbinger for future
safe drinking-water challenges. Ironically,
even when one is surrounded by the Great
Lakes, safe drinking water is not
a guarantee.
CONTRIBUTORS
M. Hanna-Attisha originated the study, developed
methods, interpreted analysis, and contributed to the
writing of the article. J. LaChance and R. Casey Sadler
assisted with the development of the methods, analyzed
results, interpreted the findings, and contributed to the
writing of the article. A. Champney Schnepp assisted with
the interpretation of the findings and contributed to the
writing of the article.
ACKNOWLEDGMENTS
We would like to thank Marc Edwards, PhD, and Elin
Betanzo, MS, for their expert assistance with un-
derstanding the historical and scientific background of
lead in water.
HUMAN PARTICIPANT PROTECTION
This study was reviewed and approved by Hurley Medical
Center institutional review board.
REFERENCES
1. Associated Press. “I don’t even let my dogs drink this
water.” CBS News. March 4, 2015. Available at: http://
www.cbsnews.com/news/flint-michigan-break-away-
detroit-water-riles-residents. Accessed October 3, 2015.
2. City of Flint 2014 Annual Water Quality Report. 2014.
Available at: https://www.cityofflint.com/wp-content/
uploads/CCR-2014.pdf. Accessed September 30, 2015.
3. Edwards M, Triantafyllidou S. Chloride to sulfate mass
ratio and lead leaching to water. J Am Water Works Assoc.
2007;99(7):96–109.
TABLE 2—Ward-Based Comparison of WLL Percentages, Pre-
and Post-Switch EBLL
Percentages, and Predicted Post BLL and Change in Predicted
BLL by Ordinary Kriging
Geostatistical Analysis: Flint, MI, 2013 and 2015
Ward WLL % > 15 ppb Pre EBLL% Post EBLL% Predicted Post
BLLa
Change in Predicted BLL
From Pre to Post, mg/dL
1 10 0.0 2.8 1.4 –0.10
2 25 0.0 1.4 0.7 0.19
3 18 1.0 4.5 2.9 0.05
4 6 3.1 1.7 2.4 –0.15
5b 32 4.9 15.7 10.3 0.51
6b 28 2.2 9.3 5.5 0.27
7b 28 5.4 5.9 5.7 -0.26
8 20 2.7 1.4 2.0 0.01
9 20 3.4 1.6 2.5 –0.43
Note. BLL = blood lead level; EBLL = elevated blood lead
level; WLL = water lead level.
aOrdinary Kriging geostatistical analysis.
bIndicates wards defined as high WLL risk in this study.
AJPH RESEARCH
288 Research Peer Reviewed Hanna-Attisha et al. AJPH
February 2016, Vol 106, No. 2
http://www.cbsnews.com/news/flint-michigan-break-away-
detroit-water-riles-residents
http://www.cbsnews.com/news/flint-michigan-break-away-
detroit-water-riles-residents
http://www.cbsnews.com/news/flint-michigan-break-away-
detroit-water-riles-residents
https://www.cityofflint.com/wp-content/uploads/CCR-2014.pdf
4. Edwards M, McNeill LS. Effect of phosphate inhibitors
on lead release from pipes. J Am Water Works Assoc. 2007;
94(1):79–90.
5. Edwards M, Falkinham J, Pruden A. Synergistic
impacts of corrosive water and interrupted corrosion
control on chemical/microbiological water quality: Flint,
MI. National Science Foundation Grant abstract. Avail-
able at: http://www.nsf.gov/awardsearch/showAward?
AWD_ID=1556258&HistoricalAwards=false. Accessed
September 10, 2005.
6. Guyette C. Scary: leaded water and one Flint family’s
toxic nightmare. Deadline Detroit. July 9, 2015. Available
at: http://www.deadlinedetroit.com/articles/12697/
scary_leaded_water_and_one_flint_family_s_toxic_
nightmare#.VfYm6eeZZJN. Accessed September 13,
2015.
7. Fonger R. Flint data on lead water lines stored on
45,000 index cards. Mlive Media Group. October 1, 2015.
Available at: http://www.mlive.com/news/flint/index.
ssf/2015/10/flint_official_says_data_on_lo.html.
Accessed October 4, 2015.
8. Centers for Disease Control and Prevention. Pre-
venting lead poisoning in young children. 2005. Available
at: http://www.cdc.gov/nceh/lead/publications/
PrevLeadPoisoning.pdf. Accessed September 30, 2015.
9. Gould E. Childhood lead poisoning: conservative
estimates of the social and economic benefits of lead
hazard control. Environ Health Perspect. 2009;117(7):
1162–1167.
10. Landrigan PJ, Schechter CB, Lipton JM, Fahs MC,
Schwartz J. Environmental pollutants and disease in
American children: estimates of morbidity, mortality, and
costs for lead poisoning, asthma, cancer, and de-
velopmental disabilities. Environ Health Perspect. 2002;110
(7):721–728.
11. Schwartz J. Societal benefits of reducing lead expo-
sure. Environ Res. 1994;66(1):105–124.
12. Pamuk E, Makuc D, Heck K, Reuben C, Lochner K.
Socioeconomic status and health chartbook. Health,
United States, 1998. Centers for Disease Control and
Prevention. 1998. Available at: http://www.cdc.gov/
nchs/data/hus/hus98cht.pdf. Accessed October 1, 2015.
13. Low level lead exposure harms children. A renewed
call for primary prevention. Report of the Advisory
Committee on Childhood Lead Poisoning Prevention.
Centers for Disease Control and Prevention. 2012.
Available at: http://www.cdc.gov/nceh/lead/acclpp/
final_document_030712.pdf. Accessed September 2015.
14. Landrigan PJ, Graef JW. Pediatric lead poisoning
in 1987: the silent epidemic continues. Pediatrics. 1987;
79(4):582–583.
15. Shannon MW. Etiology of childhood lead poisoning.
In: Pueschel SM, Linakis JG, Anderson AC, eds. Lead
Poisoning in Childhood. Baltimore, MD: Paul H. Brookes
Publishing Company; 1996:37–58.
16. Edwards M, Triantafyllidou S, Best D. Elevated
blood lead in young children due to lead-contaminated
drinking water: Washington, DC. Environ Sci Technol.
2009;43(5):1618–1623.
17. Miranda ML, Kim D, Hull AP, Paul CJ, Overstreet
Galeano MA. Changes in blood lead levels associated
with use of choramines in water treatment systems. En-
viron Health Perspect. 2007;111(2):221–225.
18. Edwards M. Designing sampling for targeting lead and
copper: implications for exposure. Lecture presented to:
the US Environmental Protection Agency National
Drinking Water Advisory Group; September 18, 2014.
19. Davidson CI, Rabinowitz M. Lead in the environ-
ment: from sources to human receptors. In: Needleman
HL, ed. Human Lead Exposure. Boca Raton, FL: CRC
Pres; 1991.
20. Gaines RH. The corrosion of lead. J Ind Eng Chem.
1913;5(9):766–768.
21. Raab GM, Laxen DPH, Anderson N, Davis S, Heaps
M, Fulton M. The influence of pH and household
plumbing on water lead concentration. Environ Geochem
Health. 1993;15(4):191–200.
22. Toxicological profile for lead. US Department of
Health and Human Services, Public Health Service,
Agency for Toxic Substances and Diseases Registry. 2007.
Available at: http://www.atsdr.cdc.gov/toxprofiles/
tp13.pdf. Accessed October 6, 2015.
23. Ngueta G, Belkacem A, Tarduf R, St-Laurent J,
Levallois P. Use of a cumulative exposure index to es-
timate the impact of tap-water lead concentration on
blood lead levels in 1-to 5-year-old children (Montreal,
Canada). Environ Health Perspect. 2015; Epub ahead of
print.
24. Triantafyllidou S, Gallagher D, Edwards M. Assessing
risk with increasingly stringent public health goals: the
case of water lead and blood lead in children. J Water
Health. 2014;12(1):57–68.
25. US Environmental Protection Agency. Safe Drinking
Water Act Lead and Copper Rule (LCR). Fed Regist.
1991;56:26460–26564.
26. Edwards M. Fetal death and reduced birth rates as-
sociated with exposure to lead-contaminated drinking
water. Environ Sci Technol. 2014;48(1):739–746.
27. Advisory Committee on Childhood Lead Poisoning
Prevention. Recommendations for blood lead
screening of young children enrolled in Medicaid: tar-
geting a group at high risk. MMWR Recomm Rep. 2000;
49(RR-14):1–13.
28. Jacobs AJ. The impacts of variations in development
context on employment growth: a comparison of cen-
tral cities in Michigan and Ontario, 1980–2006. Econ Dev
Q. 2009;23(4):351–371.
29. Kids Count Data Center. A project of the Annie E
Casey Foundation. Available at: http://datacenter.
kidscount.org/data#MI/3/0. Accessed September 26,
2015.
30. County health rankings and roadmaps: building
a culture of health, county by county. Available at: http://
www.countyhealthrankings.org/app/michigan/2015/
overview. Accessed September 26, 2015.
31. Michigan MIECHV Needs Assessment FY2015.
Available at: http://www.michigan.gov/documents/
homevisiting/Updated_MHVI_Needs_Assessment_
2014_All_counties_474015_7.pdf. Accessed October 5,
2015.
32. US Census Bureau. Quick Facts Beta. Available at:
http://www.census.gov/quickfacts/table/PST045214/
00, 2629000,26. Accessed September 2015.
33. Lewis PF. Impact of Negro migration on the
electoral geography of Flint, Michigan, 1932–1962:
a cartographic analysis. Ann Assoc Am Geogr. 1965;55(1):
1–25.
34. Taeuber KE, Taeuber AF. Negroes in Cities: Residential
Segregation and Neighborhood Change. Chicago, IL: Aldine
Publishing Company: 1969.
35. Highsmith AR. Demolition means progress:
urban renewal, local politics, and state-sanctioned ghetto
formation in Flint, Michigan. J Urban Hist. 2009;35:
348–368.
36. Zimmer BG, Hawley AH. Approaches to the so-
lution of fringe problems: preferences of residents in the
Flint metropolitan area. Public Adm Rev. 1956;16(4):
258–268.
37. Board LM, Dunsmore HJ. Environmental health
problems related to urban decentralization: as observed in
a typical metropolitan community. Am J Public Health
Nations Health. 1948;38(7):986–996.
38. Martin R, Tang M. Percent lead in water by Flint
ward. Flint Water Study. 2015. Available at: http://i0.wp.
com/flintwaterstudy.org/wp-content/uploads/2015/
09/Flint-Ward-Map_252-989x1280-2.jpg. Accessed
September 26, 2015.
39. Pampalon R, Hamel D, Gamache P, Raymond G. A
deprivation index for health planning in Canada. Chronic
Dis Can. 2009;29(4):178–191.
40. Sadler RC, Gilliland JA, Arku G. Community de-
velopment and the influence of new food retail sources on
the price and availability of nutritious food. J Urban Aff.
2013;35(4):471–491.
41. Hastings D, Miranda ML. Using GIS-based models
to protect children from lead exposure in international
series in operations research and management science. In:
Johnson M, ed. Community-Based Operations Research:
Decision Modeling for Local Impact and Diverse Populations.
1st
ed. New York, NY: Springer-Verlag New York; 2012:
173–187.
42. Schwarz K, Pickett STA, Lathrop RG, Weathers KC,
Pouyat RV, Cadenasso ML. The effects of the urban
built environment on the spatial distribution of lead in
residential soils. Environ Pollut. 2012;163:32–39.
43. Griffith DA, Doyle PG, Wheeler DC, Johnson DL. A
tale of two swaths: urban childhood blood-lead levels
across Syracuse, New York. Ann Assoc Am Geogr. 1998;88
(4):640–665.
44. Jernigan RW. A Primer on Kriging. Washington, DC:
US Environmental Protection Agency; 1986.
45. Markus J, McBratney AB. A review of the contam-
ination of soil with lead: II. Spatial distribution and
risk assessment of soil lead. Environ Int. 2001;27(5):
399–411.
46. Schulz A, Northridge ME. Social determinants of
health: implications for environmental health promotion.
Health Educ Behav. 2004;31(4):455–471.
47. Genesee County Health Department. Re: Breast-
feeding initiation challenge. 2010. Available at: http://
www.gchd.net/PressReleases/20100923bfeeding_
challenge.asp. Accessed October 6, 2015.
48. Sherlock JC, Quinn MJ. Relationship between blood
lead concentrations and dietary lead intake in infants: the
Glasgow Duplicate Diet Study 1979–1980. Food Addit
Contam. 1986;3(2):167–176.
49. Sen A, Heredia N, Senut M-C, et al. Multigenera-
tional epigenetic inheritance in humans: DNA methyl-
ation changes associated with maternal exposure to
lead can be transmitted to the grandchildren. Sci Rep.
2015;5:14466.
50. Fonger R. Elevated lead found in more Flint kids after
water switch, study finds. Mlive Media Group. September
24, 2015. Available at: http://www.mlive.com/news/
flint/index.ssf/2015/09/study_shows_twice_as_many_
flin.html. Accessed November 8, 2015.
51. Fonger R. Flint makes lead advisory official, suggests
water filters and flushing. Mlive Media Group. September
25, 2015. Available at: http://www.mlive.com/news/
flint/index.ssf/2015/09/flint_makes_lead_advisory_offi.
html. Accessed October 6, 2015.
AJPH RESEARCH
February 2016, Vol 106, No. 2 AJPH Hanna-Attisha et al. Peer
Reviewed Research 289
http://www.nsf.gov/awardsearch/showAward?AWD_ID=155625
8&HistoricalAwards=false
http://www.nsf.gov/awardsearch/showAward?AWD_ID=155625
8&HistoricalAwards=false
http://www.deadlinedetroit.com/articles/12697/scary_leaded_wa
ter_and_one_flint_family_s_toxic_nightmare#.VfYm6eeZZJN
http://www.deadlinedetroit.com/articles/12697/scary_leaded_wa
ter_and_one_flint_family_s_toxic_nightmare#.VfYm6eeZZJN
http://www.deadlinedetroit.com/articles/12697/scary_leaded_wa
ter_and_one_flint_family_s_toxic_nightmare#.VfYm6eeZZJN
http://www.mlive.com/news/flint/index.ssf/2015/10/flint_officia
l_says_data_on_lo.html
http://www.mlive.com/news/flint/index.ssf/2015/10/flint_officia
l_says_data_on_lo.html
http://www.cdc.gov/nceh/lead/publications/PrevLeadPoisoning.
pdf
http://www.cdc.gov/nceh/lead/publications/PrevLeadPoisoning.
pdf
http://www.cdc.gov/nchs/data/hus/hus98cht.pdf
http://www.cdc.gov/nceh/lead/acclpp/final_document_030712.p
df
http://www.cdc.gov/nceh/lead/acclpp/final_document_030712.p
df
http://www.atsdr.cdc.gov/toxprofiles/tp13.pdf
http://datacenter.kidscount.org/data#MI/3/0
http://www.countyhealthrankings.org/app/michigan/2015/overvi
ew
http://www.countyhealthrankings.org/app/michigan/2015/overvi
ew
http://www.countyhealthrankings.org/app/michigan/2015/overvi
ew
http://www.michigan.gov/documents/homevisiting/Updated_MH
VI_Needs_Assessment_2014_All_counties_474015_7.pdf
http://www.michigan.gov/documents/homevisiting/Updated_MH
VI_Needs_Assessment_2014_All_counties_474015_7.pdf
http://www.michigan.gov/documents/homevisiting/Updated_MH
VI_Needs_Assessment_2014_All_counties_474015_7.pdf
http://www.census.gov/quickfacts/table/PST045214/00,%20262
9000,26
http://www.census.gov/quickfacts/table/PST045214/00,%20262
9000,26
http://i0.wp.com/flintwaterstudy.org/wp-
content/uploads/2015/09/Flint-Ward-Map_252-989x1280-2.jpg
http://i0.wp.com/flintwaterstudy.org/wp-
content/uploads/2015/09/Flint-Ward-Map_252-989x1280-2.jpg
http://i0.wp.com/flintwaterstudy.org/wp-
content/uploads/2015/09/Flint-Ward-Map_252-989x1280-2.jpg
http://www.gchd.net/PressReleases/20100923bfeeding_challeng
e.asp
http://www.gchd.net/PressReleases/20100923bfeeding_challeng
e.asp
http://www.gchd.net/PressReleases/20100923bfeeding_challeng
e.asp
http://www.mlive.com/news/flint/index.ssf/2015/09/study_show
s_twice_as_many_flin.html
http://www.mlive.com/news/flint/index.ssf/2015/09/study_show
s_twice_as_many_flin.html
http://www.mlive.com/news/flint/index.ssf/2015/09/study_show
s_twice_as_many_flin.html
http://www.mlive.com/news/flint/index.ssf/2015/09/flint_makes
_lead_advisory_offi.html
http://www.mlive.com/news/flint/index.ssf/2015/09/flint_makes
_lead_advisory_offi.html
http://www.mlive.com/news/flint/index.ssf/2015/09/flint_makes
_lead_advisory_offi.html
52. Johnson J. Don’t drink Flint’s water, Genesee County
leaders warn. Mlive Media Group. October 1, 2015.
Available at: http://www.mlive.com/news/flint/index.
ssf/2015/10/genesee_county_leaders_warn_do.html.
Accessed October 6, 2015.
53. Erb R, Gray K. State to tackle unsafe water in Flint
with tests, filters. Detroit Free Press. October 2, 2015.
Available at: http://www.freep.com/story/news/local/
michigan/2015/10/02/state-officials-outline-plan-flint-
water/73200250. Accessed October 6, 2015.
54. J. Snyder announces $12 million-plan to fix Flint
water. Detroit Free Press. October 8, 2015. Available at:
http://www.freep.com/story/news/local/michigan/
2015/10/08/snyder-flint-water-reconnect/73567778.
Accessed October 8, 2015.
55. Kestens Y, Lebel A, Chaix B, et al. Association be-
tween activity space exposure to food establishments and
individual risk of overweight. PLoS One. 2012;7(8):
e41418.
56. Tanner K, Kaffer N. State data confirms higher
blood-lead levels in Flint kids. Detroit Free Press. Sep-
tember 29, 2015. Available at: http://www.freep.com/
story/opinion/columnists/nancy-kaffer/2015/09/26/
state-data-flint-lead/72820798. Accessed October 7,
2015.
57. US Environmental Protection Agency, Office of
Water. Lead and Copper Rule 2007 short-term regula-
tory revisions and clarifications state implementation
guidance. June 2008. Available at: http://water.epa.gov/
lawsregs/rulesregs/sdwa/lcr/upload/New-Lead-and-
Copper-Rule-LCR-2007-Short-Term-Regulatory-
Revisions-and-Clarifications-State-Implementation-
Guidance.pdf. Accessed October 25, 2015.
58. Grevatt PC. Lead and Copper Rule requirements for
optimal corrosion control treatment for large drinking
water systems. Memo to EPA Regional Water Division
Directors, Regions I-X. November 3, 2015. Available at:
http://flintwaterstudy.org/wp-content/uploads/2015/
11/LCR-Requirements-for-OCCT-for-Large-DW-
Systems-11-03-2015.pdf. Accessed December 8, 2015.
59. Healthy People 2020: topics and objectives index.
Washington, DC: US Department of Health and Human
Services; 2012. Available at: http://www.healthypeople.
gov/2020/topicsobjectives2020. Accessed October 27,
2015.
AJPH RESEARCH
290 Research Peer Reviewed Hanna-Attisha et al. AJPH
February 2016, Vol 106, No. 2
http://www.mlive.com/news/flint/index.ssf/2015/10/genesee_co
unty_leaders_warn_do.html
http://www.mlive.com/news/flint/index.ssf/2015/10/genesee_co
unty_leaders_warn_do.html
http://www.freep.com/story/news/local/michigan/2015/10/02/sta
te-officials-outline-plan-flint-water/73200250
http://www.freep.com/story/news/local/michigan/2015/10/02/sta
te-officials-outline-plan-flint-water/73200250
http://www.freep.com/story/news/local/michigan/2015/10/02/sta
te-officials-outline-plan-flint-water/73200250
http://www.freep.com/story/news/local/michigan/2015/10/08/sn
yder-flint-water-reconnect/73567778
http://www.freep.com/story/news/local/michigan/2015/10/08/sn
yder-flint-water-reconnect/73567778
http://www.freep.com/story/opinion/columnists/nancy-
kaffer/2015/09/26/state-data-flint-lead/72820798
http://www.freep.com/story/opinion/columnists/nancy-
kaffer/2015/09/26/state-data-flint-lead/72820798
http://www.freep.com/story/opinion/columnists/nancy-
kaffer/2015/09/26/state-data-flint-lead/72820798
http://water.epa.gov/lawsregs/rulesregs/sdwa/lcr/upload/New-
Lead-and-Copper-Rule-LCR-2007-Short-Term-Regulatory-
Revisions-and-Clarifications-State-Implementation-
Guidance.pdf
http://water.epa.gov/lawsregs/rulesregs/sdwa/lcr/upload/New-
Lead-and-Copper-Rule-LCR-2007-Short-Term-Regulatory-
Revisions-and-Clarifications-State-Implementation-
Guidance.pdf
http://water.epa.gov/lawsregs/rulesregs/sdwa/lcr/upload/New-
Lead-and-Copper-Rule-LCR-2007-Short-Term-Regulatory-
Revisions-and-Clarifications-State-Implementation-
Guidance.pdf
http://water.epa.gov/lawsregs/rulesregs/sdwa/lcr/upload/New-
Lead-and-Copper-Rule-LCR-2007-Short-Term-Regulatory-
Revisions-and-Clarifications-State-Implementation-
Guidance.pdf
http://water.epa.gov/lawsregs/rulesregs/sdwa/lcr/upload/New-
Lead-and-Copper-Rule-LCR-2007-Short-Term-Regulatory-
Revisions-and-Clarifications-State-Implementation-
Guidance.pdf
http://flintwaterstudy.org/wp-content/uploads/2015/11/LCR-
Requirements-for-OCCT-for-Large-DW-Systems-11-03-
2015.pdf
http://flintwaterstudy.org/wp-content/uploads/2015/11/LCR-
Requirements-for-OCCT-for-Large-DW-Systems-11-03-
2015.pdf
http://flintwaterstudy.org/wp-content/uploads/2015/11/LCR-
Requirements-for-OCCT-for-Large-DW-Systems-11-03-
2015.pdf
http://www.healthypeople.gov/2020/topicsobjectives2020
Copyright of American Journal of Public Health is the property
of American Public Health
Association and its content may not be copied or emailed to
multiple sites or posted to a
listserv without the copyright holder's express written
permission. However, users may print,
download, or email articles for individual use.
COMMUNITY DEVELOPMENT AND THE
INFLUENCE OF NEW FOOD RETAIL SOURCES ON
THE PRICE AND AVAILABILITY OF NUTRITIOUS
FOOD
RICHARD C. SADLER
University of Western Ontario
JASON A. GILLILAND
University of Western Ontario
GODWIN ARKU
University of Western Ontario
ABSTRACT: Studies have demonstrated links between the
accessibility of food and multiple health
outcomes. Policymakers engaged in local community
development may use public health concerns
as a strategy to procure funding for food retail initiatives. Few
studies to date have demonstrated
the impact that a new food retailer can have on geographic and
economic access to nutritious food
in a community, evidence which could support the case for new
food retail. This paper examines the
price and availability of food before and after the opening of
two new groceiy stores in a former food
desert in Elint, Michigan. The results indicate a substantial
improvement in both geographic and
economic food accessibility, and show no statistical difference
betH'een prices at average grocery
stores and the new stores. Discussion suggests that investment
in poorer neighborhoods can be
beneficial to the local population and the community at large by
creating a local multiplier effect
through increased spending in the community.
I he evolution of North American food retailing has created
gaps in the community food
environment in some urban neighborhoods. Furey, Strugnell,
and Mcllveen (2001) discuss how
social, economic, and health-related consequences combine to
create social exclusion among
residents living in these "food deserts." Food retailers could
effect change in food environments,
but there is often a gap between the plans of large-scale
retailers and local-level economic
development strategies (Pothukuchi, 2005). Thus, researchers
have suggested an increased role
for planners and policymakers, who are tasked with promofing
public welfare (Pothukuchi, 2004).
Planners and policymakers can encourage local economic
development in disadvantaged areas
to make use of unique features like proximity to major
transportation routes and existing social
amenities (Porter, 1995). Despite a growing popularity of food
policy councils among planning
Direct correspondence to: Jason A. Gilliland, Department of
Geography, University of Western Ontario, 1151 Richmond
St., London, ON, Canada N6A 5C2. E-mail: [email protected]
JOURNAL OF URBAN AFFAIRS, Volume 35, Number 4, pages
471-491.
Copyright © 2012 Urban Affairs Association
All rights of reproduction in any form reserved.
ISSN: 0735-2166. DOI: 10.1111/j.l467-9906.2012.00624.x
472 I JOURNAL OF URBAN AFFAIRS | Vol. 35/No. 4/2013
and other municipal departments, the research to date is merely
suggestive of the impact they can
have on nurturing new food retail initiatives (Campbell, 2004).
Additionally, most planners still
regard economic development in the food system as the domain
of the private market (Pothukuchi
and Kaufman, 2000).
This paper demonstrates the geographic and economic impact of
two new food retail sources
in a disadvantaged neighborhood of Flint, Michigan, one
developed through a public/private
partnership, and the other through traditional private
investment. Food basket pricing in the
neighborhood indicates a substantial improvement in the cost of
groceries for residents due to
lower prices at the new food retailers. Over one year, these cost
savings translate into between 2-
and 3-month's rent for an average apartment in the city. This
case demonstrates the potential for
multi-tiered benefits: for the investors (who are profitable), the
neighborhood residents (who have
improved geographic access and economic buying power), and
the planners (who are responsible
for policy-making that made investment attractive in the
neighborhood). The article suggests that
food retail should be considered as a development policy in
socioeconomically disadvantaged
neighborhoods underserved by current food retail patterns, both
from a profit-motivated and
community development standpoint.
The Built Environment and Health
The concern for geographic accessibility to food arises from
research demonstrating in-
equalities from living in food deserts, or areas where nutritious,
affordable food is unavailable
(Beaumont, Lang, Leather, & Mucklow, 1995). Increased
prevalence of obesity and related ill-
nesses have been found in these neighborhoods (Morland, Diez-
Roux, & Wing, 2006; Wang,
Kim, Gonzalez, MacLeod, & Winkleby, 2007). Some suggest
that these disparities are created
in part by the evolution of retail to larger store formats
frequently found in suburban locations,
leaving urban areas without nutritious food options (Lavin,
2000; Pothukuchi, 2005; Wrigley,
2001). These inequalities, however, are not simply locational
issues. Poorer dietary habits among
low-income residents may be linked to larger social inequities
(Travers, 1996).
Healthy diets are more expensive in food deserts (Drewnowski,
Darmon, & Briend 2004; Furey
et al., 2001 ; Larsen and Gilliland, 2009); studies have indicated
a considerable premium paid—up
to 76% higher—by residents shopping at local convenience
stores rather than larger chain stores
(Block and Kouba, 2006). This price disparity equates with less
purchasing power, contributing
to poorer diets among residents with limited mobility (Laraia,
Siega-Riz, Kaufman, & Jones,
2004; Morland et al., 2006), since low-mobility residents are
less able to travel great distances to
access goods and services (Hanson and Schwab, 1987).
Poor dietary habits are correlated with higher rates of obesity
(Binkley, Eales, & Jekanowski
2000) and obesity-related health issues such as type-2 diabetes
and cardiovascular disease
(Mokdad et al., 2003). Obesity rates are lower among people
living near healthy food out-
lets (Lewis et al., 2005; Morland et al., 2006), and higher
among those living nearer to fast food
restaurants and convenience stores (Morland and Evenson,
2009; Poston and Foreyt, 1999). Fur-
ther links show a negative correlation between income and fast-
food consumption (Paeratakul,
Ferdinand, Champagne, Ryan, & Bray, 2003) and a positive
correlation between low-income
neighborhoods and location of fast-food outlets (Gilliland,
2010; Cummins and Macintyre, 2002;
Reidpath, Burns, Ganard, Mahoney, & Townsend, 2002). This
suggests that low-income residents
in distressed neighborhoods are most at risk of developing poor
eating habits due to increased ex-
posure to unhealthy foods. This elevated risk increases the
likelihood of social and health-related
problems.
Despite heightened exposure to unhealthy food options, many
residents in low-income, food
insecure communities are aware of the options for healthy
eating near their homes (Freedman
and Bell, 2009), but may be hindered by mobility or economic
constraints (Darmon, Ferguson, &
I Community Development and the Influence of New Food
Retail Sources  473
Briend, 2002). Residents in communities without supermarkets
tend to perceive fewer nutritious
food options, suggesting the importance of larger, more visible
grocery stores (Moore, Diez-Roux,
& Brines, 2008). Although people are aware of the benefits of
nutritious food, they may lack the
political clout or economic capital to bring nutritious food
retailers to their neighborhoods. Thus,
this public health and urban planning issue merits further
attention.
Quantifying the Food Environment
Because of the economic implications of living in
neighborhoods without grocery stores, it is
important to quantify variations in price of groceries within and
between different neighborhoods.
Many studies have employed nutritious food basket surveys to
determine the affordability of
foods in neighborhoods (Chung and Myers, 1999; Cummins and
Macintyre, 2002; Friel, Walsh,
& McCarthy, 2006; Larsen and Gilliland, 2009; Pearson,
Russell, Campbell, & Barker, 2005).'
While residents do not always shop at the nearest grocery store
(Rose and Richards, 2004), the
most socioeconomically distressed populations are far more
likely to shop near home (Clifton,
2004). Thus, food basket pricing is particulady useful for
determining the prices of groceries for
residents with mobility constraints or those in low-income
communities.
Food basket surveys have ranged from only 9 fruits and
vegetables (Pearson et al, 2005) to
146 items from all food groups (Friel et al., 2006). Some used
food baskets pre-tested by public
health authorities (Chung and Myers, 1999; Cummins and
Macintyre, 2002; Furey et al., 2001).
Many simply used the cheapest price for each basket item
(Cummins and Macintyre, 2002;
Donkin, Dowler, Stevenson, & Turner, 1999; Jetter and
Cassady, 2006; Larsen and Gilliland,
2009; Morland and Filomena, 2007; Winkler, Turrell, &
Patterson, 2006), representing the lowest
price a household could expect to spend. Others collected
multiple prices for the cheapest brand,
the leading brand and outlet brands (Friel et al., 2006), or prices
for the most popular brand and
package size (Chung and Myers, 1999).
In every case, the goal is to determine price differences between
and within store types and
neighborhoods. Groceries are frequently more expensive at
convenience stores than at grocery
stores, and prices at independent grocers are higher than at
larger chain grocery stores (White,
2007; Winkler et al., 2006). Thus, the presence of a grocery
store may not alleviate a disadvantage
in the affordability of nutritious foods. But being in a poorer
neighborhood does not necessarily
equate with higher prices, since prices tend to vary more by
store type than store location (Larsen
and Gilliland, 2009).
GIS analysis and food basket pricing are used to quantify the
contribution of two new grocery
stores in a former food desert in Flint, Michigan. Because food
basket studies typically only
examine the price or availability of food with cross-sectional
study designs (Cummins and
Macintyre, 2002; Jetter and Cassady, 2006; Morland and
Filomena, 2007; Pearson et al., 2005),
this before-and-after study represents an important contribution
to knowledge on the literature
regarding food accessibility and availability. Other researchers
and cities can use this information
to justify plans for retailers of nutritious foods in disadvantaged
neighborhoods.
Study Area and Research Context
Flint, Michigan, exemplifies the declining medium-sized
american city portrayed by Mayer
and Greenberg (2001). Once reliant on a major industry for jobs
(General Motors), Flint suffered
from severe deindustrialization, resulting in an economic
depression and substantial job losses. A
77% decline in manufacturing employment in Flint since 1980
has translated into a 41% overall
decline in jobs (Jacobs, 2009). The city peaked at neariy
200,000 residents in the 1960s and at the
time was expected to nearly double in size within 50 years
(Segoe and Associates, 1960). Instead,
474 I JOURNAL OF URBAN AFFAIRS I Vol. 35/No. 4/2013
the current population has shrunk to 102,434 (U.S. Census
Bureau, 2010), a 48% decline. This
decline was exacerbated by long-standing preferences by both
city and county residents alike
for home rule over annexation of surrounding municipalities,
stymieing the capture of suburban
tax bases for city services (Zimmer and Hawley, 1956a).
Paradoxically, many of these suburban
municipalities had better attitudes toward tax increases, but
resisted annexation to the central city
(Zimmer and Hawley, 1956b). Thus, while out-county
municipalities remained stable or grew in
population, the city was increasingly "choked" by the
surrounding municipalities with nowhere
to grow, and a declining housing stock contributing to the
population loss (Highsmith, 2009).
The result of this decline is quantified in a recent study on
Flint's urban form, which indicates
that many neighborhoods have lost so many residences as to be
at near-rural levels of density by
units per acre (Hollander, 2010).
An expected outcome of this decline in residential population is
an accompanying decline in
the quantity and quality of services, both public (e.g., schools,
parks) and private (e.g., retail,
commercial employment). Based on network analysis of
occupied residential parcels in 2009,
73% of the city's population resided more than 1000 meters (0.6
miles, or a 10-minute walk)
from a grocery store (Figure 1).
Because of the sharp decline of industrial jobs and
corresponding resources, Flint has continued
to rely on traditional models of economic development. As past
research has shown for other
localities (Mayer and Greenberg, 2001), city leaders in Flint
likely believed the problem would
remedy itself or that little could be done to ameliorate the
problem. Many redevelopment strategies
have failed due to unrealistic scale or an inability to focus on
local economic development, as
Krumholz (1991) has suggested with other cities. Thus, the
abandonment of traditional retail
from established neighborhoods in Flint has been long
established and persistent.
Despite this decline, certain neighborhoods in Flint have
remained stable or are seeing revival.
These locations exhibit several elements important for economic
and community development—
including lower crime rates, the presence of health care
services, institutions of higher learn-
ing, and transportation connectivity (Reese and Ye, 2011).
Sustained public investment in the
education and health care sectors in and near downtown has
created demand for private invest-
ment in the form of retail, apartments, lofts, and student
residences. The influx of capital and
residential population into the neighborhood increased the
demand for a food retail outlet.
With the financial backing of non-profit agencies, an
independent grocery called Witherbee's
Market opened a 10,000 square foot store in June 2010 in the
heart of the downtown food desert.
Another grocery store (Mr. B's Foodland) opened just south of
downtown in January 2010. Prior to
this, downtown had not had a grocery store since the Farah
Brothers Supermarket burned down in
1999 (Polk & Co., 1998,1999). These stores reflect a change in
the mentality toward reinvestment
downtown; previous economic development plans included the
failed Autoworld, Water Street
festival marketplace, and the Hyatt Regency Hotel (Highsmith,
2009). Incentives were given to
Witherbee's store operators to aid in development, including a
brownfield tax incentive, three
EDA loans from the local economic development corporation,
and a commercial revitaiization
deduction (City of Flint, 2010). The opening of these stores has
major implications for economic
development strategies, since they can serve as catalysts for
additional initiatives. Their stability
can be instructive to other interested retailers that local
economic development can succeed.
There are also implications for neighborhood viability in terms
of quality of life, since two
grocery stores now lie within a 10-minute walk (0.6 miles, or
1,000 meters) for many residences.
This improvement in a former food desert can be quantified
through GIS analysis and by evaluating
any changes in the price and availability of nutritious food.
This study makes several important contributions useful to
retailers and planners: first, the
development of an empirical method for locating food deserts in
urban areas; second, the com-
parison of the cost of groceries via nutritious food basket
pricing throughout the Flint metropolitan
Community Development and the Influence of New Food Retail
Sources | 475
Grocery Stores
Residences
City of Flint
Locations of grocery stores and occupied residential address
points in Flint, Michigan, 2011
area; and third, the before-and-after comparison of the cost of
groceries in the former food desert.
The results of this pre/post-evaluation will help determine the
geographic and economic impact
of the new stores. In turn, this provides evidence for planners,
policymakers, and investors in-
terested in pursuing community and economic development
partnerships of this nature in other
communities.
476 I JOURNAL OF URBAN AFFAIRS | Vol. 35/No. 4/2013
iVIETHODS
The primary objective of this study is to demonstrate the effect
of two new grocery stores on
the price and availability of nutritious foods in a former food
desert. Implications of these benefits
on community development are drawn throughout. To study
food deserts, however, it is important
to have an empirical method for locating them. The methods
suggest an innovative approach for
using geographic information systems to locate food deserts,
and employ an established method
for determining the price of nutritious foods.
Determining Food Deserts
Several criteria must be met to substantiate the existence of a
food desert. First, residents must
have poor geographic access to grocery stores or other
nutritious food sources. The presence
of alternative food retailers may provide some nutritious foods
but, in general, the price will
be considerably higher (Eisenhauer, 2001) and availability will
be lower than at grocery stores
(Chung and Myers, 1999). Occupied residential address points
for the City of Flint were used
as the geographic unit of analysis, since all trips originate from
the home. Address points were
then classified based on whether city residents were within a
1,000 m network distance (along
the street network) to the nearest full-service grocery store
(both within and outside the city of
Flint). This distance is a common threshold to determine
neighborhood walkability, a concept
that encompasses the greatest distance someone would walk to
reach a local amenity (Apparicio,
Cloutier, & Shearmur, 2007; Larsen and Gilliland, 2008;
Smoyer-Tomic, Spence, & Amrhein
2006). Stores outside the city limit boundary were included in
the analysis, to account for an
error in spatial analysis known as the boundary or edge effect
(Gatrell & Löytönen, 1998; Sadler,
Gilliland, & Arku 2011) and since many residents are likely to
shop at these stores (Figure 1).
The percentage of address points with access to a grocery store
was calculated for each census
block group (CBG). These CBGs were then categorized into
four groups by the percentage of
parcels with access to a grocery store, CBGs where 0%-l% of
parcels had access met the first
criterion for defining food deserts, since few people could walk
to a grocery store.
The second requirement for determining food deserts is
neighborhood socioeconomic distress.
The price or availability of groceries has little influence on
residents in affluent neighborhoods,
since these households simply drive to the desired store. To
resolve this, neighborhoods were
characterized by socioeconomic status using U.S. Census
Bureau data for census block groups
(2000a). CBGs were used as the unit of aggregation since they
represent the smallest geographic
unit for which sociodemographic variables are available. It is
important to consider the smallest
possible unit of analysis when dealing with aggregated data,
since higher levels of aggregation
are more likely to misrepresent some neighborhoods, due to
higher variability of populations in
larger agglomerafions (Gatrell & Löytönen, 1998).
Four socioeconomic variables were considered in building a
socioeconomic distress index, fol-
lowing methods outlined in past research (Gilliland and Ross,
2005; Pampalon, Hamel, Gamache,
& Raymond, 2010). These variables include low educational
attainment, incidence of low income,
lone parenthood, and unemployment. Each variable was
included for its impact individually, and
for the minimal collinearity seen when variables were grouped.
Standardized z-scores were ob-
tained for each variable, and these were summed to obtain a
composite socioeconomic distress
score for census block groups within the urbanized region.
These CBGs were then classified into
five groups by natural breaks, and the two highest quintiles
were isolated to obtain those CBGs
most likely at a disadvantage due to socioeconomic distress.
While the focus of this study is on the city of Hint, this distress
index was calculated for a
geographic unit more appropriate to the study of urban areas:
the urbanized area of the Flint
1 Community Deveiopment and the influence of New Food
Retail Sources | 477
metropolitan area as defined by the U.S. Census Bureau
(2000b). Thus, the values for the distress
index are eontingent on all CBGs within the urbanized area of
Flint. This area includes many
suburban municipalities in Genesee County.
Because urbanized areas are defined independently from census
agglomerations, the urbanized
area for Flint did not match neatly with census block group
boundaries. To determine urban census
block groups, the urbanized area was buffered at 1,000 meters.
Census block groups completely
contained by that buffer were included as urban. All other CBGs
were considered non-urban and
excluded from analysis. This technique included CBGs that lay
mostly within the urbanized area
rather than only including CBGs within the city limits of Flint.
Distress scores thus represent
the relative disadvantage based on the entire urbanized area of
Flint and transcend municipal
boundaries (which in Michigan rarely coincide neatly with
urban areas). Figure 2 displays the
distress levels for much of the urbanized area.
Finally, since grocery stores generally require a large
population to support large economies of
scale, only census block groups with a density of 1,000 people
per square mile were considered in
the analysis. This threshold is used by the U.S. Census Bureau
to define urbanized areas (2000b).
While areas with lower densities may exhibit the first two
characteristics of a food desert, it is
practical to consider the densest areas first, since retail-led
interventions are possible here. In
urban regions, CBGs and census tracts with low densities are
frequently industrial parks. For the
study area, one CBG in a vacant industrial zone was excluded
due to the absence of a population.
In this way, spatial analysis privileges populated
neighborhoods.
Nutritious Food Basket Survey
The Ontario Nutritious Food Basket (ONFB) survey (found in
the appendix) was used to
determine variations in the cheapest available price of groceries
at various grocers in the Flint
metropolitan area. This list has been utilized in recent and
geographically proximate research
(Larsen and Gilliland, 2009; Nathoo and Shoveller, 2003), and
is a well-respected and systematic
tool created by Health Canada to measure the price of groceries
contributing to a nutritious
diet (including 66 items representing every food group) (Health
Canada, 1998). The potential to
compare these results with past results in Canada presents
future opportunities for cross-border
comparison, as Jacobs (2009) did with economic development
policies.
Phase one of the survey was conducted in spring 2009. Food
baskets were priced at 15 grocery
stores around the city and county purposefully selected to
represent a cross-section of grocery store
types. Because prices within food retail chains were remarkably
consistent for all the stores visited
(between 2% and 4% within chains), the average food basket
value for that chain was applied to
other stores that were not visited. This resulted in food basket
prices for 38 of 51 grocery stores
in the county. Additionally, a food basket was priced in the food
desert downtown (in anticipation
of the opening of the new grocery stores) by visiting
convenience stores and the city farmers'
market to ensure all items were found, since no single
downtown establishment had all 66 items.
Phase two was conducted in spring 2010, immediately after the
opening of Witherbee's Market
and Mr. B's Foodland in the food desert. For this phase, the
same 15 stores were visited, as well
as Witherbee's and Mr. B's. Mr. B's is a part of a two-store
chain, so pricing was also conducted
at the other Mr. B's location. By extrapolating basket prices to
other stores as before, this resulted
in food basket prices for 41 of 53 grocery stores.
Phase three was conducted in spring 2011 to determine how
increases in food prices might
affect grocery stores. A suburban store (half of a two-store
chain) visited previously burned down
between the 2010 and 2011 food basket pricing events. In place
of these prices, two independent
grocery stores were added to the database, one each in suburban
and urban neighborhoods.
478 I JOURNAL OF URBAN AFFAIRS I Vol. 35/No. 4/2013
Neighborhood
Socioeconomic
Distress Level
0 0.5 1 2
1 1 I I I
Kilometers • Grocery Stores
FIGURE 2
Census bloci< groups within Flint urbanized area by
socioeconomic distress level
I Community Development and the Influence ot New Food
Retail Sources | 479
In total, prices were collected for 44 of 52 stores in the county,
including 12 of the 13 grocery
stores within the Flint city limits.
Price of Groceries and Neighborhood Distress
Since food is not a comparison shopping good for all
consumers, many shop close to home
(Jones and Simmons, 1990). Thus, the neighborhood around a
grocery store likely embodies
the average store patron. Using existing socioeconomic distress
data (including variables on
low educational attainment, incidence of low income, lone
parenthood, and unemployment) and
nutritious food basket prices for a majority of the grocery stores
in the county, it is possible
to examine correlations between the cost of groceries at
neighborhood grocery stores and the
neighborhood socioeconomic distress score. One-thousand-
meter buffers were created around
each grocery store for which food basket pricing was available.
CBGs with a majority of their
area within the store buffer were grouped, and the average
distress score from these CBGs was
applied to the store.
RESULTS
Food Deserts in Fiint
Figures 3 and 4 show high-distress CBGs categorized by the
percent of residents with access to
a grocery store in 2009 and 2010, respectively (before and after
the opening of two new grocery
stores). As anticipated, Flint's downtown was classified as a
food desert due to the absence
of a grocery store in 2009. Figure 3 illustrates that 24 CBGs in
or immediately adjacent to
downtown met the three criteria for a food desert: poor
geographical access to nutritious food,
high socioeconomic distress, and high, urban density.
Additional food deserts include distressed
areas near Bassett Park in the west. Hasselbring Park in the
northwest, St. John Industrial Park in
the north. Carpenter Road Elementary and the Kearsley
Reservoir in the northeast, and Evergreen
Regency and Howard Estates in the southeast.
The opening of Witherbee's downtown and Mr. B's just south of
downtown wholly or partly
ameliorated spatial food deserts in 8 CBGs, as shown in Figures
3 and 4. Initially, only 28%
of residential addresses in the city were within 1,000 meters of
a grocery store. This number
increased to 31%, or an additional 1,300 homes, after the
opening of Witherbee's and Mr. B's. In
addition, 13% of all residential addresses in the city
experienced an improvement in individual
accessibility, based on network analysis of address points to the
nearest grocery store. The added
presence of two grocery stores near downtown lessened the
burden of travelling unwalkable
distances to reach nutritious food retailers.
Figure 5 indicates the average distance to a grocery store by
socioeconomic distress level.
Before the opening of the new stores, highly distressed
neighborhoods were somewhat closer
to a grocery store than less distressed neighborhoods. Since
only 28% of residences in the
city were initially within 1,000 meters of a grocery store,
however, food deserts existed in
many neighborhoods (i.e., downtown). For residents with
constrained mobility, distance is a
considerable obstacle to accessing food. With the addition of
the new stores, these distances
were substantially reduced, improving accessibility in much of
the former food desert downtown.
Although food deserts still exist, some poorer neighborhoods
have better access to grocery stores.
The spatial analysis shows areas of geographic disadvantage but
does not suggest whether the
addition of these grocery stores solved the economic issue by
lowering the price of nutritious
foods—a topic addressed in the next section.
480 I JOURNAL OF URBAN AFFAIRS I Vol. 35/No. 4/2013
Witherbees A
Market k «
Percent within
: Waii<ing Distance
(1000 m)
0 - 1 %
2 - 25%
26 - 75%
76-100%
# Grocery Stores
High-distress CBGs by percent within walking distance to a
grocery store, Fiint, Ml, pre-intervention
(2009)
Community Development and the Influence of New Food Retail
Sources | 481
Percent within
Walking Distance
T (1000 m)
0 - 1%
2 - 25%
26 - 75%
76-100%
• Grocery Stores
High-distress CBGs by percent within waiking distance to a
grocery store, Flint, Ml, post-intervention
(2011)
482 I JOURNAL OF URBAN AFFAIRS 1 Voi. 35/No. 4/2013
il 2009 - Pre-lntervention
"2011-Post-Intervention
Low Medium High
FIGURE 5
Average distance (meters) to grocery stores by socioeconomic
distress levei, pre- and post-
intervention (2009 and 2011)
TABLE 1
Cost of groceries by access to pubiic transit, by type of store,
and by grocery stores vs. food
desert, 2009-2011
Access to Public Transit at Store?
Yes
No
Type of grocery store
National
Local
Independent
Food desert
Overall average vs. cost in (Former) food desert
Grocery stores
Food desert
2009
$128.24
$125.64
2009
$114.45
$130.20
$144.59
$182.95
2009
$125.50
$182.95
2010
$124.11
$120.86
2010
$111.88
$124.22
$140.66
$142.57
2010
$121.88
$142.57
2011
$137.40
$134.04
2011
$126.63
$139.62
$147.22
$156.75
2011
$135.18
$156.75
Bold indicates that the cost decreased the most (or saw the
smallest increase) among values in its group for the
corresponding
year.
Food Basket Results
Results of food basket surveys in 2009 and 2010 (adjusted for
inflation) are shown alongside
2011 results in Table 1 and Figure 6. Table 1 demonstrates no
statistical difference in price due
to the presence or absence of public transit lines. But there are
significant differences based on
the type of store and on the price of groceries in the food desert
(in 2009) versus the average at
other grocery stores.
There is no significant difference in the price of groceries by
neighborhood socioeconomic
distress. Figure 6 shows a scatter-plot of food basket prices at
individual stores by socioeconomic
distress. The R-squared values for 2009 to 2011 are 0.063,
0.085, and 0.005, respectively, sug-
gesting no systematic relationship between high distress and
high prices for groceries. The only
outlier in Figure 6 represents the price of the basket in the food
desert neighborhood in 2009.
Community Development and the Influence of New Food Retail
Sources | 483
2009
Low Medium High
FIGURE 6
Cost of groceries at grocery stores by neighborhood distress
score, 2009-2011
In 2009, the cost of a nutritious basket of food in the food
desert was $182.95 (in 2011 dollars).
In 2010, the cost at Mr. B's was $133.66 while the cost at
Witherbee's was $151.48. This pattern
held for pricing conducted in 2011, with prices of $144.37 at
Mr. B's and $169.12 at Witherbee's.
?-Tests were run on the public transit section of Table 1, and
one-way ANOVA tests were run
on the remaining values. Results from the r-tests indicate no
statistical significance in the price
differences between stores on public transit lines and those not
on transit lines. Tukey's tests were
run as a post hoc evaluation of the ANOVA analyses for the
cost of groceries by the type of store
and in the food desert versus grocery stores.
484 I JOURNAL OF URBAN AFFAIRS | Vol. 35/No. 4/2013
Results of Tukey's tests revealed that in 2009 prices at national
chains were significantly lower
than at other stores, while local chains and independent grocers
had significantly similar prices.
The food desert was significantly more expensive than all types
of grocery stores. In 2010, after
the opening of the new stores, the price of groceries at
independent grocers and the new stores in
the former food desert were statistically similar. Prices at
national chains were still significantly
cheaper than prices at local chains, and local chains were
cheaper than independents. In 2011,
prices at local chains and independent grocers were once again
statistically similar, and prices
at independent grocers and the stores in the former food desert
were also statistically similar.
Inequalities in the price or availability of nutritious food are
thus contingent on the store type,
not on neighborhood socioeconomic status.
As noted, there is a significant difference between the price of
groceries at grocery stores
versus the price of groceries in the food desert in 2009 (bottom
of Table 1). Food desert residents
shopping within the neighborhood in 2009 would have paid a
46% premium to procure a nutrifious
basket of food. The cost of groceries in the former food desert
is now statistically similar to the
cost at other independent grocers. This is important for two
reasons. First, research has shown
that most people (regardless of mobility status) shop within two
miles, or about 3,200 meters, of
their homes (Eisenhauer, 2001). Since there were initially no
grocery stores within two miles (or
3,200 meters) of the center of the neighborhood, if actual
shopping patterns were similar to this
research, residents would have been forced to shop at stores that
were not full-service grocers.
Second, a recent report conducted on downtown Flint indicated
that 30% of residents in this
neighborhood did not have a car available at their household
(ESRI, 2007). This suggests that
many residents either walk or take public transit to shop. It is
likely, then, that many people were
paying a premium in price due to constraints on time, mobility,
or resources.
The bottom of Table 1 illustrates the decline in the price of
nutritious foods seen by the opening
of Witherbee's Market and Mr. B's Foodland in the former food
desert. The combined effect of
the new stores translates into only a 5% premium over the
average cost at other grocery stores
around the county in 2011. Thus, while residents are still paying
slightly more for groceries,
they are paying considerably less than they were before the
stores opened. This refiects a recent
similar finding where the opening of a farmers' market in a food
desert considerably reduced the
price of groceries (Larsen and Gilhland, 2009).
DISCUSSION
The opening of two new grocery stores in and near a food desert
has infiuenced the price and
availability of nutritious foods. The number of residents
impacted by the addition of the new stores
understates its potential effect for two reasons. First, many
changes have occurred downtown in
recent years, including new housing developments that have
brought new permanent residents
to the neighborhood. Second, approximately 1,000 students have
moved into the neighborhood
in the last three years as a result of the growth of the local
university (Flint Journal, 2009).
Because many of these students are itinerant year-to-year (and
therefore possibly not included in
the census count for downtown) future census counts may not
adequately reflect the population
in this neighborhood. If the stores had not opened, the issues
with this food desert may have been
exacerbated as new residents and students moved in only to find
inadequate sources of nutritious
food.
Evidence from a survey conducted prior to the opening of the
new stores suggests that living
in a food desert can have detrimental effects. The survey found
that 21% of residents in the
city have at least some degree of difficulty accessing a "grocery
store or supermarket that has a
good variety of fresh fruits and vegetables" (n — 730)
(Prevention Research Center of Michigan,
2009). This suggests that, among those outside of walking
distance to a grocery store, accessing
I Community Development and the Influence of New Food
Retail Sources I 485
nutritious foods can be particularly problematic. The same
survey indicated that only 25% of
city residents consume at least 5 servings of fruits and
vegetables per day (« = 687) (Prevention
Research Center of Michigan, 2009). Because there is a positive
relationship between proximity
to grocery stores and dietary quality, the addition of these new
stores may make healthy eating
easier for those interested in improving their health status.
The addition of the grocery stores in and near the food desert
improved food access in both
geographic and economic dimensions. Geographic access has
been improved because residents
can now access a grocery store downtown. Residents previously
shopping in the neighborhood
were relegated to a handful of convenience stores or the
farmers' market. Due to the addition
of these two stores, an increase of 3% of the entire city
population can now walk to a grocery
store. Economic access was also improved by the new stores.
For residents originally shopping for
groceries entirely within the neighborhood, a considerable
premium would have been paid, as this
and past research has shown (Drewnowski et al., 2004; Furey et
al., 2001; Larsen and Gilliland,
2009). Those shopping outside the neighborhood would have
expended additional resources on
travel to reach more distant grocery stores. A resident shopping
by the nutritious food basket
guidelines every two weeks would save approximately $800 at
Witherbee's or $1250 at Mr. B's
over the course of a year. In Flint, this equates with between 2
and 3 months' rent in a 1-bedroom
apartment (Apartment Ratings, 2011). For a low-income family,
this cost-savings would result in
a considerable change in quality of life.
The farmers' market in itself offers a microcosm of the issue of
accessing nutritious food
downtown prior to the opening of the grocery stores. It is
competitive for some types of fresh
produce, but does not offer many staple foods like cereal, and
many other products like meats and
cheeses are only available with higher mark-ups. Additionally,
the farmers' market is only open
three days a week, reflecting a common concern that residents
were required to "plan ahead" if
intending to shop there. Finally, it is also distant from the
center of the neighborhood, and is less
accessible by bus than Witherbee's or Mr. B's. Thus, while the
market serves a vital role in the
neighborhood, the contribution of the new grocery stores is
significant both geographically and
economically.
Still, there are important pieces of evidence that this research
does not answer. Cummins,
Findlay, Petticrew, and Sparks, (2008) indicate that, even when
presented with a new food source,
many people do not deviate from their old habits. Because no
customer surveys were taken,
the present research is unable to state whether people shop at
these new stores. Further, even
assuming that residents switched stores, this research cannot
determine whether dietary habits
are improving as a result. Additionally, cultural and social
factors may have a stronger influence
on what people will choose to purchase even when given so-
called healthier choices (Cummins,
Curtis, Diez-Roux, & Macintyre, 2007), and environmental cues
can cause people to make
sub-optimal choices even when intending to act in their self-
interest (Just and Payne, 2009).
Policy Implications
The success of these stores is compelling for policymakers.
Initially, the development of With-
erbee's was a grassroots movement by community members
interested in a full-service grocery
store for their neighborhood. Using local community groups like
the Neighborhood Improvement
and Preservation Project and the Local Initiatives Support
Corporation to lobby funding from
higher-level organizations, sponsors from the State of Michigan,
the U.S. Department of Hous-
ing and Urban Development, and local community foundations
soon joined to provide financial
support. The project became a statewide model to support
efforts to bring small grocery stores to
other under-serviced urban neighborhoods (LISC-Flint, 2008).
486 I JOURNAL OF URBAN AFFAIRS I Vol. 35/No. 4/2013
This model has been successful in part because of efforts by the
Downtown Development
Authority of the City of Flint to increase security in the
downtown core to entice area residents to
frequent the new developments. This strategy echoes Bowes
(2007), who indicated that "public
policy strategies meant to encourage retail development in a
particular part of the city such as
downtown need to include efforts to reduce crime" (p. 88).
The small scale of the grocery stores means a smaller
percentage of the market is needed to
remain profitable. The cost-savings to consumers provided in
the results section are in line with
the grocer margins projected by Witherbee's financial backers
(27-29%), whose plan was to
remain competitive with large-scale grocery retailers (20-24%
margin) while staying far below
the margins expected for convenience stores (40%) (LISC-Flint,
2008). A market analysis of the
community prior to the opening of Witherbee's indicated a 60%
leakage rate for money spent
outside the neighborhood, suggesting a large untapped demand
for goods (see also Carr, 1999;
Porter, 1995). The report indicates that the market would need
to re-capture 4.3% of the leakage
rate to remain profitable (LISC-Flint, 2008). If Witherbee's
captures this part of the market
demand, it could serve as a model for future public/private
partnerships to develop grocery stores
in other disadvantaged neighborhoods in this region and
elsewhere.
Because Witherbee's resulted from a grassroots movement, it is
instructive for plan-
ners/policymakers and conventional retailers. The attention
given to Witherbee's by local investors
likely contributed to its opening, since close attention was given
to the needs of the neighbor-
hood and neighborhood-based leadership was present
throughout. Both of these elements are
suggested as necessary components in local economic
development (Carley, Kirk, & Mclntosh,
2001). The organization that aided Witherbee's (LISC) was also
the catalyst for a grocery store in
Harlem (Lavin, 2000). Since not all revitaiization comes from
grassroots movements, however, it
is important to engage the public and private sectors in planning
for new development. The new
grocery stores in Flint demonstrate the policy implication that
"public officials cannot rely on
regional growth to solve the problems of poor neighborhoods"
(Blair and Carroll, 2007, p. 274).
Indeed, both stores owe their existence to the local-level
investors who observed a need for retail
within their neighborhood.
Attracting grocery stores and other retail to urban centers can
be difficult where site availability,
human resources, or aid programs for new retail are unavailable
or sparse (Nayga and Weinburg,
1999; Pothukuchi, 2005), and many governments and would-be
investors can be shy of taking the
risk. This aversion is a potential reason for metropolitan
disparities seen in urban neighborhoods
(Blair and Carroll, 2007). Yet, there is clearly potential for
retail to locate in urban centers. A
government-sponsored initiative in the U.K. recently spurred
the development of a supermarket
within a designated regeneration area (Mitchell and Kirkup,
2003). By incentivizing development
in this disadvantaged neighborhood, the government was able to
match retailers with suitable
areas to develop stores that would be both profitable from a
business standpoint and restorative
from a local community development standpoint. This appears
to be the case in Flint with the
opening of Witherbee's, and additional retail initiatives have
flourished in the neighborhood.
Witherbee's may serve as a catalyst for multiplier effects on
local economic development.
This community-centered strategy is in contrast to the large-
scale, tourist-oriented economic
development strategies of the 1970s and 1980s. These past
projects often did not deliver on
their promises of jobs (Krumholz, 1991), and frequently failed
due to their reliance on outside
populations to sustain their high operating costs.
Investment in retail may not be a catch-all solution for
improving health status (Cummins et al.,
2008; Cummins & Macintyre, 2002), but the addition of new
food retail does lessen the social
inequalities created when these areas were initially abandoned
by grocery stores (Carley et al.,
2001; Dunkley, Helling, & Sawicki, 2004; Williams and
Hubbard, 2001). As mentioned earlier,
various tax and zoning incentives were given by the City of
Flint to the operators of Witherbee's
I Community Development and the Influence of New Food
Retaii Sources 1 487
(City of Flint, 2010), suggesting that municipal governments are
beginning to play a larger role
in healthy eating. Elsewhere, other initiatives like the FRESH
Food Store Program also facilitate
the development of nutritious food sellers in distressed
communities by providing tax and zoning
incentives to qualified retailers in New York (Food Retail
Expansion to Support Health, 2011).
Although this paper necessarily cannot consider all prospects
for food as local economic
development, formal-sector interventions like those seen in this
paper will not necessarily occur
in all neighborhoods where there is a need. Therefore, it is
useful to briefly consider that where
investment in retail is not possible or desired, there exist many
movements which emphasize local
food networks as a form of economic development. The national
Growing Power movement is one
of many organizations that provide training and support for
prospective growers (Growing Power,
2011). Beyond this, the Growing Home movement in Chicago
combines job training and organic
agriculture to provide employment opportunities for troubled
residents (Growing Home, 2011).
Given that food is an essential building block of life and many
opportunities for growth exist
within food systems (including locally), these programs may
offer promise as community and
economic development strategies, especially in neighborhoods
where conventional food retailers
are unlikely to invest.
CONCLUSIONS
The contributions of this research will benefit researchers,
planners, and investors. An empirical
mixed-methods approach was employed to locate food deserts in
urban areas. GIS was used to
map food retailers and census data to determine potential food
deserts, while food basket pricing
was conducted to examine variations in the price and
availability of nutritious foods. The GIS
approach can be used in other urban settings to locate potential
food deserts, giving other
communities evidence for creating policies to support
community development in disadvantaged
neighborhoods through food retail.
This research pinpointed potential food desert neighborhoods in
Flint, Michigan. Because the
city exemplifies the problems of many post-industrial shrinking
cities of North America and
Western Europe, the methods employed in this research can be
replicated elsewhere. Food basket
pricing before and after the opening of two new grocery stores
showed that much of downtown
Flint is no longer a food desert. This approach included the
extrapolation of pricing to all grocery
Elevated Blood Lead Levels in Children AssociatedWith the Fl.docx

More Related Content

Similar to Elevated Blood Lead Levels in Children AssociatedWith the Fl.docx

Long Island's Drinking Water: Threats and Solutions
Long Island's Drinking Water:  Threats and SolutionsLong Island's Drinking Water:  Threats and Solutions
Long Island's Drinking Water: Threats and SolutionsSave The Great South Bay
 
Dwight Tigner STEM DAY Poster
Dwight Tigner STEM DAY PosterDwight Tigner STEM DAY Poster
Dwight Tigner STEM DAY PosterDwight Tigner Jr
 
Fetal Death and Reduced Birth Rates Associated with Exposure to Lead-Contamin...
Fetal Death and Reduced Birth Rates Associated with Exposure to Lead-Contamin...Fetal Death and Reduced Birth Rates Associated with Exposure to Lead-Contamin...
Fetal Death and Reduced Birth Rates Associated with Exposure to Lead-Contamin...Jim Bloyd, DrPH, MPH
 
PFCs-Drinking-Water-FAQ-03-08-16
PFCs-Drinking-Water-FAQ-03-08-16PFCs-Drinking-Water-FAQ-03-08-16
PFCs-Drinking-Water-FAQ-03-08-16Heather Wilcox
 
AGL Priorities for Protecting-#8
AGL Priorities for Protecting-#8AGL Priorities for Protecting-#8
AGL Priorities for Protecting-#8Susan Campbell
 
Determinants of household water quality in the tamale metropolis, ghana
Determinants of household water quality in the tamale metropolis, ghanaDeterminants of household water quality in the tamale metropolis, ghana
Determinants of household water quality in the tamale metropolis, ghanaAlexander Decker
 
1. water availability presentation in english
1. water availability presentation in english1. water availability presentation in english
1. water availability presentation in englishglmcguire
 
Taps and Toilets: How Greater Access Can Radically Improve Africa’s Future
Taps and Toilets: How Greater Access Can Radically Improve Africa’s FutureTaps and Toilets: How Greater Access Can Radically Improve Africa’s Future
Taps and Toilets: How Greater Access Can Radically Improve Africa’s FutureEric Firnhaber
 
Publication
PublicationPublication
Publicationsarita K
 
Week 5 Mph 605 Water &amp; Health Part I
Week 5  Mph 605 Water &amp; Health Part IWeek 5  Mph 605 Water &amp; Health Part I
Week 5 Mph 605 Water &amp; Health Part Isewhood
 
Environmental Health Presentation
Environmental Health PresentationEnvironmental Health Presentation
Environmental Health PresentationKaitlin Zwingert
 
Climate change wash_brief
Climate change wash_briefClimate change wash_brief
Climate change wash_briefShangning Wang
 
Steward Advanced Materials 137_aqueous_phase_mercury_removal_strategies
Steward Advanced Materials 137_aqueous_phase_mercury_removal_strategiesSteward Advanced Materials 137_aqueous_phase_mercury_removal_strategies
Steward Advanced Materials 137_aqueous_phase_mercury_removal_strategiesJohn Glenning
 
High Five program: final report (2011-2014)
High Five program: final report (2011-2014)High Five program: final report (2011-2014)
High Five program: final report (2011-2014)abby ati
 
urinary published paper Dhar fluoride (1)
urinary published paper Dhar fluoride (1)urinary published paper Dhar fluoride (1)
urinary published paper Dhar fluoride (1)Srikanth Raghavachari
 
Promo Fact Sheet Global Water Crisis
Promo Fact Sheet Global Water CrisisPromo Fact Sheet Global Water Crisis
Promo Fact Sheet Global Water CrisisLisa Cottingham
 

Similar to Elevated Blood Lead Levels in Children AssociatedWith the Fl.docx (20)

Water treatment
Water treatmentWater treatment
Water treatment
 
Newsletter SEPT. final Final26
Newsletter SEPT. final Final26Newsletter SEPT. final Final26
Newsletter SEPT. final Final26
 
Long Island's Drinking Water: Threats and Solutions
Long Island's Drinking Water:  Threats and SolutionsLong Island's Drinking Water:  Threats and Solutions
Long Island's Drinking Water: Threats and Solutions
 
Dwight Tigner STEM DAY Poster
Dwight Tigner STEM DAY PosterDwight Tigner STEM DAY Poster
Dwight Tigner STEM DAY Poster
 
Chapter 8: Clean is nourished: The links between WASH and nutrition [Nourishi...
Chapter 8: Clean is nourished: The links between WASH and nutrition [Nourishi...Chapter 8: Clean is nourished: The links between WASH and nutrition [Nourishi...
Chapter 8: Clean is nourished: The links between WASH and nutrition [Nourishi...
 
Fetal Death and Reduced Birth Rates Associated with Exposure to Lead-Contamin...
Fetal Death and Reduced Birth Rates Associated with Exposure to Lead-Contamin...Fetal Death and Reduced Birth Rates Associated with Exposure to Lead-Contamin...
Fetal Death and Reduced Birth Rates Associated with Exposure to Lead-Contamin...
 
PFCs-Drinking-Water-FAQ-03-08-16
PFCs-Drinking-Water-FAQ-03-08-16PFCs-Drinking-Water-FAQ-03-08-16
PFCs-Drinking-Water-FAQ-03-08-16
 
AGL Priorities for Protecting-#8
AGL Priorities for Protecting-#8AGL Priorities for Protecting-#8
AGL Priorities for Protecting-#8
 
Determinants of household water quality in the tamale metropolis, ghana
Determinants of household water quality in the tamale metropolis, ghanaDeterminants of household water quality in the tamale metropolis, ghana
Determinants of household water quality in the tamale metropolis, ghana
 
1. water availability presentation in english
1. water availability presentation in english1. water availability presentation in english
1. water availability presentation in english
 
Taps and Toilets: How Greater Access Can Radically Improve Africa’s Future
Taps and Toilets: How Greater Access Can Radically Improve Africa’s FutureTaps and Toilets: How Greater Access Can Radically Improve Africa’s Future
Taps and Toilets: How Greater Access Can Radically Improve Africa’s Future
 
Publication
PublicationPublication
Publication
 
Week 5 Mph 605 Water &amp; Health Part I
Week 5  Mph 605 Water &amp; Health Part IWeek 5  Mph 605 Water &amp; Health Part I
Week 5 Mph 605 Water &amp; Health Part I
 
Environmental Health Presentation
Environmental Health PresentationEnvironmental Health Presentation
Environmental Health Presentation
 
Climate change wash_brief
Climate change wash_briefClimate change wash_brief
Climate change wash_brief
 
ERHS220 poster
ERHS220 posterERHS220 poster
ERHS220 poster
 
Steward Advanced Materials 137_aqueous_phase_mercury_removal_strategies
Steward Advanced Materials 137_aqueous_phase_mercury_removal_strategiesSteward Advanced Materials 137_aqueous_phase_mercury_removal_strategies
Steward Advanced Materials 137_aqueous_phase_mercury_removal_strategies
 
High Five program: final report (2011-2014)
High Five program: final report (2011-2014)High Five program: final report (2011-2014)
High Five program: final report (2011-2014)
 
urinary published paper Dhar fluoride (1)
urinary published paper Dhar fluoride (1)urinary published paper Dhar fluoride (1)
urinary published paper Dhar fluoride (1)
 
Promo Fact Sheet Global Water Crisis
Promo Fact Sheet Global Water CrisisPromo Fact Sheet Global Water Crisis
Promo Fact Sheet Global Water Crisis
 

More from gidmanmary

Using C#, write a program to find the nearest common parent of any t.docx
Using C#, write a program to find the nearest common parent of any t.docxUsing C#, write a program to find the nearest common parent of any t.docx
Using C#, write a program to find the nearest common parent of any t.docxgidmanmary
 
Using autoethnography in a qualitative research,consider a resid.docx
Using autoethnography in a qualitative research,consider a resid.docxUsing autoethnography in a qualitative research,consider a resid.docx
Using autoethnography in a qualitative research,consider a resid.docxgidmanmary
 
Using Earned Value to Determine StatusJennifer turned in her statu.docx
Using Earned Value to Determine StatusJennifer turned in her statu.docxUsing Earned Value to Determine StatusJennifer turned in her statu.docx
Using Earned Value to Determine StatusJennifer turned in her statu.docxgidmanmary
 
Using at least your textbook and a minimum of three additional sourc.docx
Using at least your textbook and a minimum of three additional sourc.docxUsing at least your textbook and a minimum of three additional sourc.docx
Using at least your textbook and a minimum of three additional sourc.docxgidmanmary
 
Using APA style format, write a 4-5 page paper describing the provis.docx
Using APA style format, write a 4-5 page paper describing the provis.docxUsing APA style format, write a 4-5 page paper describing the provis.docx
Using APA style format, write a 4-5 page paper describing the provis.docxgidmanmary
 
Use the organization you selected in Week One and the Security Ass.docx
Use the organization you selected in Week One and the Security Ass.docxUse the organization you selected in Week One and the Security Ass.docx
Use the organization you selected in Week One and the Security Ass.docxgidmanmary
 
Using DuPont analysis is a quick and relatively easy way to assess t.docx
Using DuPont analysis is a quick and relatively easy way to assess t.docxUsing DuPont analysis is a quick and relatively easy way to assess t.docx
Using DuPont analysis is a quick and relatively easy way to assess t.docxgidmanmary
 
Using APA style, prepare written research paper of 4 double spaced p.docx
Using APA style, prepare written research paper of 4 double spaced p.docxUsing APA style, prepare written research paper of 4 double spaced p.docx
Using APA style, prepare written research paper of 4 double spaced p.docxgidmanmary
 
Use the organization selected for your Managing Change Paper Part .docx
Use the organization selected for your Managing Change Paper Part .docxUse the organization selected for your Managing Change Paper Part .docx
Use the organization selected for your Managing Change Paper Part .docxgidmanmary
 
Use your knowledge to develop the circumstances and details involved.docx
Use your knowledge to develop the circumstances and details involved.docxUse your knowledge to develop the circumstances and details involved.docx
Use your knowledge to develop the circumstances and details involved.docxgidmanmary
 
Use the percentage method to compute the federal income taxes to w.docx
Use the percentage method to compute the federal income taxes to w.docxUse the percentage method to compute the federal income taxes to w.docx
Use the percentage method to compute the federal income taxes to w.docxgidmanmary
 
Use the textbook andor online sources to locate and capture three w.docx
Use the textbook andor online sources to locate and capture three w.docxUse the textbook andor online sources to locate and capture three w.docx
Use the textbook andor online sources to locate and capture three w.docxgidmanmary
 
Use the Web to conduct research on User Domain Security Policy and A.docx
Use the Web to conduct research on User Domain Security Policy and A.docxUse the Web to conduct research on User Domain Security Policy and A.docx
Use the Web to conduct research on User Domain Security Policy and A.docxgidmanmary
 
Use this Article to create the powerpoint slidesBrown, S. L., No.docx
Use this Article to create the powerpoint slidesBrown, S. L., No.docxUse this Article to create the powerpoint slidesBrown, S. L., No.docx
Use this Article to create the powerpoint slidesBrown, S. L., No.docxgidmanmary
 
use the work sheet format made available  but only to give brief, bu.docx
use the work sheet format made available  but only to give brief, bu.docxuse the work sheet format made available  but only to give brief, bu.docx
use the work sheet format made available  but only to give brief, bu.docxgidmanmary
 
Use these three sources to compose an annotated bibliography on Data.docx
Use these three sources to compose an annotated bibliography on Data.docxUse these three sources to compose an annotated bibliography on Data.docx
Use these three sources to compose an annotated bibliography on Data.docxgidmanmary
 
Use this outline to crete a four page essay. Guideline included and .docx
Use this outline to crete a four page essay. Guideline included and .docxUse this outline to crete a four page essay. Guideline included and .docx
Use this outline to crete a four page essay. Guideline included and .docxgidmanmary
 
Use the link provided to complete a self-assessment. After completin.docx
Use the link provided to complete a self-assessment. After completin.docxUse the link provided to complete a self-assessment. After completin.docx
Use the link provided to complete a self-assessment. After completin.docxgidmanmary
 
Use the SPSS software and the data set (2004)GSS.SAV (attached).docx
Use the SPSS software and the data set (2004)GSS.SAV (attached).docxUse the SPSS software and the data set (2004)GSS.SAV (attached).docx
Use the SPSS software and the data set (2004)GSS.SAV (attached).docxgidmanmary
 
Use the Internet to research functional systems that would contain a.docx
Use the Internet to research functional systems that would contain a.docxUse the Internet to research functional systems that would contain a.docx
Use the Internet to research functional systems that would contain a.docxgidmanmary
 

More from gidmanmary (20)

Using C#, write a program to find the nearest common parent of any t.docx
Using C#, write a program to find the nearest common parent of any t.docxUsing C#, write a program to find the nearest common parent of any t.docx
Using C#, write a program to find the nearest common parent of any t.docx
 
Using autoethnography in a qualitative research,consider a resid.docx
Using autoethnography in a qualitative research,consider a resid.docxUsing autoethnography in a qualitative research,consider a resid.docx
Using autoethnography in a qualitative research,consider a resid.docx
 
Using Earned Value to Determine StatusJennifer turned in her statu.docx
Using Earned Value to Determine StatusJennifer turned in her statu.docxUsing Earned Value to Determine StatusJennifer turned in her statu.docx
Using Earned Value to Determine StatusJennifer turned in her statu.docx
 
Using at least your textbook and a minimum of three additional sourc.docx
Using at least your textbook and a minimum of three additional sourc.docxUsing at least your textbook and a minimum of three additional sourc.docx
Using at least your textbook and a minimum of three additional sourc.docx
 
Using APA style format, write a 4-5 page paper describing the provis.docx
Using APA style format, write a 4-5 page paper describing the provis.docxUsing APA style format, write a 4-5 page paper describing the provis.docx
Using APA style format, write a 4-5 page paper describing the provis.docx
 
Use the organization you selected in Week One and the Security Ass.docx
Use the organization you selected in Week One and the Security Ass.docxUse the organization you selected in Week One and the Security Ass.docx
Use the organization you selected in Week One and the Security Ass.docx
 
Using DuPont analysis is a quick and relatively easy way to assess t.docx
Using DuPont analysis is a quick and relatively easy way to assess t.docxUsing DuPont analysis is a quick and relatively easy way to assess t.docx
Using DuPont analysis is a quick and relatively easy way to assess t.docx
 
Using APA style, prepare written research paper of 4 double spaced p.docx
Using APA style, prepare written research paper of 4 double spaced p.docxUsing APA style, prepare written research paper of 4 double spaced p.docx
Using APA style, prepare written research paper of 4 double spaced p.docx
 
Use the organization selected for your Managing Change Paper Part .docx
Use the organization selected for your Managing Change Paper Part .docxUse the organization selected for your Managing Change Paper Part .docx
Use the organization selected for your Managing Change Paper Part .docx
 
Use your knowledge to develop the circumstances and details involved.docx
Use your knowledge to develop the circumstances and details involved.docxUse your knowledge to develop the circumstances and details involved.docx
Use your knowledge to develop the circumstances and details involved.docx
 
Use the percentage method to compute the federal income taxes to w.docx
Use the percentage method to compute the federal income taxes to w.docxUse the percentage method to compute the federal income taxes to w.docx
Use the percentage method to compute the federal income taxes to w.docx
 
Use the textbook andor online sources to locate and capture three w.docx
Use the textbook andor online sources to locate and capture three w.docxUse the textbook andor online sources to locate and capture three w.docx
Use the textbook andor online sources to locate and capture three w.docx
 
Use the Web to conduct research on User Domain Security Policy and A.docx
Use the Web to conduct research on User Domain Security Policy and A.docxUse the Web to conduct research on User Domain Security Policy and A.docx
Use the Web to conduct research on User Domain Security Policy and A.docx
 
Use this Article to create the powerpoint slidesBrown, S. L., No.docx
Use this Article to create the powerpoint slidesBrown, S. L., No.docxUse this Article to create the powerpoint slidesBrown, S. L., No.docx
Use this Article to create the powerpoint slidesBrown, S. L., No.docx
 
use the work sheet format made available  but only to give brief, bu.docx
use the work sheet format made available  but only to give brief, bu.docxuse the work sheet format made available  but only to give brief, bu.docx
use the work sheet format made available  but only to give brief, bu.docx
 
Use these three sources to compose an annotated bibliography on Data.docx
Use these three sources to compose an annotated bibliography on Data.docxUse these three sources to compose an annotated bibliography on Data.docx
Use these three sources to compose an annotated bibliography on Data.docx
 
Use this outline to crete a four page essay. Guideline included and .docx
Use this outline to crete a four page essay. Guideline included and .docxUse this outline to crete a four page essay. Guideline included and .docx
Use this outline to crete a four page essay. Guideline included and .docx
 
Use the link provided to complete a self-assessment. After completin.docx
Use the link provided to complete a self-assessment. After completin.docxUse the link provided to complete a self-assessment. After completin.docx
Use the link provided to complete a self-assessment. After completin.docx
 
Use the SPSS software and the data set (2004)GSS.SAV (attached).docx
Use the SPSS software and the data set (2004)GSS.SAV (attached).docxUse the SPSS software and the data set (2004)GSS.SAV (attached).docx
Use the SPSS software and the data set (2004)GSS.SAV (attached).docx
 
Use the Internet to research functional systems that would contain a.docx
Use the Internet to research functional systems that would contain a.docxUse the Internet to research functional systems that would contain a.docx
Use the Internet to research functional systems that would contain a.docx
 

Recently uploaded

ROOT CAUSE ANALYSIS PowerPoint Presentation
ROOT CAUSE ANALYSIS PowerPoint PresentationROOT CAUSE ANALYSIS PowerPoint Presentation
ROOT CAUSE ANALYSIS PowerPoint PresentationAadityaSharma884161
 
Alper Gobel In Media Res Media Component
Alper Gobel In Media Res Media ComponentAlper Gobel In Media Res Media Component
Alper Gobel In Media Res Media ComponentInMediaRes1
 
Atmosphere science 7 quarter 4 .........
Atmosphere science 7 quarter 4 .........Atmosphere science 7 quarter 4 .........
Atmosphere science 7 quarter 4 .........LeaCamillePacle
 
ENGLISH 7_Q4_LESSON 2_ Employing a Variety of Strategies for Effective Interp...
ENGLISH 7_Q4_LESSON 2_ Employing a Variety of Strategies for Effective Interp...ENGLISH 7_Q4_LESSON 2_ Employing a Variety of Strategies for Effective Interp...
ENGLISH 7_Q4_LESSON 2_ Employing a Variety of Strategies for Effective Interp...JhezDiaz1
 
MULTIDISCIPLINRY NATURE OF THE ENVIRONMENTAL STUDIES.pptx
MULTIDISCIPLINRY NATURE OF THE ENVIRONMENTAL STUDIES.pptxMULTIDISCIPLINRY NATURE OF THE ENVIRONMENTAL STUDIES.pptx
MULTIDISCIPLINRY NATURE OF THE ENVIRONMENTAL STUDIES.pptxAnupkumar Sharma
 
ECONOMIC CONTEXT - PAPER 1 Q3: NEWSPAPERS.pptx
ECONOMIC CONTEXT - PAPER 1 Q3: NEWSPAPERS.pptxECONOMIC CONTEXT - PAPER 1 Q3: NEWSPAPERS.pptx
ECONOMIC CONTEXT - PAPER 1 Q3: NEWSPAPERS.pptxiammrhaywood
 
HỌC TỐT TIẾNG ANH 11 THEO CHƯƠNG TRÌNH GLOBAL SUCCESS ĐÁP ÁN CHI TIẾT - CẢ NĂ...
HỌC TỐT TIẾNG ANH 11 THEO CHƯƠNG TRÌNH GLOBAL SUCCESS ĐÁP ÁN CHI TIẾT - CẢ NĂ...HỌC TỐT TIẾNG ANH 11 THEO CHƯƠNG TRÌNH GLOBAL SUCCESS ĐÁP ÁN CHI TIẾT - CẢ NĂ...
HỌC TỐT TIẾNG ANH 11 THEO CHƯƠNG TRÌNH GLOBAL SUCCESS ĐÁP ÁN CHI TIẾT - CẢ NĂ...Nguyen Thanh Tu Collection
 
Hierarchy of management that covers different levels of management
Hierarchy of management that covers different levels of managementHierarchy of management that covers different levels of management
Hierarchy of management that covers different levels of managementmkooblal
 
DATA STRUCTURE AND ALGORITHM for beginners
DATA STRUCTURE AND ALGORITHM for beginnersDATA STRUCTURE AND ALGORITHM for beginners
DATA STRUCTURE AND ALGORITHM for beginnersSabitha Banu
 
AmericanHighSchoolsprezentacijaoskolama.
AmericanHighSchoolsprezentacijaoskolama.AmericanHighSchoolsprezentacijaoskolama.
AmericanHighSchoolsprezentacijaoskolama.arsicmarija21
 
Solving Puzzles Benefits Everyone (English).pptx
Solving Puzzles Benefits Everyone (English).pptxSolving Puzzles Benefits Everyone (English).pptx
Solving Puzzles Benefits Everyone (English).pptxOH TEIK BIN
 
Quarter 4 Peace-education.pptx Catch Up Friday
Quarter 4 Peace-education.pptx Catch Up FridayQuarter 4 Peace-education.pptx Catch Up Friday
Quarter 4 Peace-education.pptx Catch Up FridayMakMakNepo
 
Influencing policy (training slides from Fast Track Impact)
Influencing policy (training slides from Fast Track Impact)Influencing policy (training slides from Fast Track Impact)
Influencing policy (training slides from Fast Track Impact)Mark Reed
 
Proudly South Africa powerpoint Thorisha.pptx
Proudly South Africa powerpoint Thorisha.pptxProudly South Africa powerpoint Thorisha.pptx
Proudly South Africa powerpoint Thorisha.pptxthorishapillay1
 
Framing an Appropriate Research Question 6b9b26d93da94caf993c038d9efcdedb.pdf
Framing an Appropriate Research Question 6b9b26d93da94caf993c038d9efcdedb.pdfFraming an Appropriate Research Question 6b9b26d93da94caf993c038d9efcdedb.pdf
Framing an Appropriate Research Question 6b9b26d93da94caf993c038d9efcdedb.pdfUjwalaBharambe
 
Crayon Activity Handout For the Crayon A
Crayon Activity Handout For the Crayon ACrayon Activity Handout For the Crayon A
Crayon Activity Handout For the Crayon AUnboundStockton
 
Judging the Relevance and worth of ideas part 2.pptx
Judging the Relevance  and worth of ideas part 2.pptxJudging the Relevance  and worth of ideas part 2.pptx
Judging the Relevance and worth of ideas part 2.pptxSherlyMaeNeri
 

Recently uploaded (20)

ROOT CAUSE ANALYSIS PowerPoint Presentation
ROOT CAUSE ANALYSIS PowerPoint PresentationROOT CAUSE ANALYSIS PowerPoint Presentation
ROOT CAUSE ANALYSIS PowerPoint Presentation
 
Alper Gobel In Media Res Media Component
Alper Gobel In Media Res Media ComponentAlper Gobel In Media Res Media Component
Alper Gobel In Media Res Media Component
 
Atmosphere science 7 quarter 4 .........
Atmosphere science 7 quarter 4 .........Atmosphere science 7 quarter 4 .........
Atmosphere science 7 quarter 4 .........
 
ENGLISH 7_Q4_LESSON 2_ Employing a Variety of Strategies for Effective Interp...
ENGLISH 7_Q4_LESSON 2_ Employing a Variety of Strategies for Effective Interp...ENGLISH 7_Q4_LESSON 2_ Employing a Variety of Strategies for Effective Interp...
ENGLISH 7_Q4_LESSON 2_ Employing a Variety of Strategies for Effective Interp...
 
MULTIDISCIPLINRY NATURE OF THE ENVIRONMENTAL STUDIES.pptx
MULTIDISCIPLINRY NATURE OF THE ENVIRONMENTAL STUDIES.pptxMULTIDISCIPLINRY NATURE OF THE ENVIRONMENTAL STUDIES.pptx
MULTIDISCIPLINRY NATURE OF THE ENVIRONMENTAL STUDIES.pptx
 
ECONOMIC CONTEXT - PAPER 1 Q3: NEWSPAPERS.pptx
ECONOMIC CONTEXT - PAPER 1 Q3: NEWSPAPERS.pptxECONOMIC CONTEXT - PAPER 1 Q3: NEWSPAPERS.pptx
ECONOMIC CONTEXT - PAPER 1 Q3: NEWSPAPERS.pptx
 
Model Call Girl in Tilak Nagar Delhi reach out to us at 🔝9953056974🔝
Model Call Girl in Tilak Nagar Delhi reach out to us at 🔝9953056974🔝Model Call Girl in Tilak Nagar Delhi reach out to us at 🔝9953056974🔝
Model Call Girl in Tilak Nagar Delhi reach out to us at 🔝9953056974🔝
 
HỌC TỐT TIẾNG ANH 11 THEO CHƯƠNG TRÌNH GLOBAL SUCCESS ĐÁP ÁN CHI TIẾT - CẢ NĂ...
HỌC TỐT TIẾNG ANH 11 THEO CHƯƠNG TRÌNH GLOBAL SUCCESS ĐÁP ÁN CHI TIẾT - CẢ NĂ...HỌC TỐT TIẾNG ANH 11 THEO CHƯƠNG TRÌNH GLOBAL SUCCESS ĐÁP ÁN CHI TIẾT - CẢ NĂ...
HỌC TỐT TIẾNG ANH 11 THEO CHƯƠNG TRÌNH GLOBAL SUCCESS ĐÁP ÁN CHI TIẾT - CẢ NĂ...
 
Hierarchy of management that covers different levels of management
Hierarchy of management that covers different levels of managementHierarchy of management that covers different levels of management
Hierarchy of management that covers different levels of management
 
DATA STRUCTURE AND ALGORITHM for beginners
DATA STRUCTURE AND ALGORITHM for beginnersDATA STRUCTURE AND ALGORITHM for beginners
DATA STRUCTURE AND ALGORITHM for beginners
 
AmericanHighSchoolsprezentacijaoskolama.
AmericanHighSchoolsprezentacijaoskolama.AmericanHighSchoolsprezentacijaoskolama.
AmericanHighSchoolsprezentacijaoskolama.
 
Solving Puzzles Benefits Everyone (English).pptx
Solving Puzzles Benefits Everyone (English).pptxSolving Puzzles Benefits Everyone (English).pptx
Solving Puzzles Benefits Everyone (English).pptx
 
Rapple "Scholarly Communications and the Sustainable Development Goals"
Rapple "Scholarly Communications and the Sustainable Development Goals"Rapple "Scholarly Communications and the Sustainable Development Goals"
Rapple "Scholarly Communications and the Sustainable Development Goals"
 
Quarter 4 Peace-education.pptx Catch Up Friday
Quarter 4 Peace-education.pptx Catch Up FridayQuarter 4 Peace-education.pptx Catch Up Friday
Quarter 4 Peace-education.pptx Catch Up Friday
 
Influencing policy (training slides from Fast Track Impact)
Influencing policy (training slides from Fast Track Impact)Influencing policy (training slides from Fast Track Impact)
Influencing policy (training slides from Fast Track Impact)
 
Proudly South Africa powerpoint Thorisha.pptx
Proudly South Africa powerpoint Thorisha.pptxProudly South Africa powerpoint Thorisha.pptx
Proudly South Africa powerpoint Thorisha.pptx
 
Framing an Appropriate Research Question 6b9b26d93da94caf993c038d9efcdedb.pdf
Framing an Appropriate Research Question 6b9b26d93da94caf993c038d9efcdedb.pdfFraming an Appropriate Research Question 6b9b26d93da94caf993c038d9efcdedb.pdf
Framing an Appropriate Research Question 6b9b26d93da94caf993c038d9efcdedb.pdf
 
Crayon Activity Handout For the Crayon A
Crayon Activity Handout For the Crayon ACrayon Activity Handout For the Crayon A
Crayon Activity Handout For the Crayon A
 
TataKelola dan KamSiber Kecerdasan Buatan v022.pdf
TataKelola dan KamSiber Kecerdasan Buatan v022.pdfTataKelola dan KamSiber Kecerdasan Buatan v022.pdf
TataKelola dan KamSiber Kecerdasan Buatan v022.pdf
 
Judging the Relevance and worth of ideas part 2.pptx
Judging the Relevance  and worth of ideas part 2.pptxJudging the Relevance  and worth of ideas part 2.pptx
Judging the Relevance and worth of ideas part 2.pptx
 

Elevated Blood Lead Levels in Children AssociatedWith the Fl.docx

  • 1. Elevated Blood Lead Levels in Children Associated With the Flint Drinking Water Crisis: A Spatial Analysis of Risk and Public Health Response Mona Hanna-Attisha, MD, MPH, Jenny LaChance, MS, Richard Casey Sadler, PhD, and Allison Champney Schnepp, MD Objectives. We analyzed differences in pediatric elevated blood lead level incidence before and after Flint, Michigan, introduced a more corrosive water source into an aging water system without adequate corrosion control. Methods. We reviewed blood lead levels for children younger than 5 years before (2013) and after (2015) water source change in Greater Flint, Michigan. We assessed the percentage of elevated blood lead levels in both time periods, and identified geo- graphical locations through spatial analysis. Results. Incidence of elevated blood lead levels increased from 2.4% to 4.9% (P < .05) after water source change, and neighborhoods with the highest water lead levels ex- perienced a 6.6% increase. No significant change was seen
  • 2. outside the city. Geospatial analysis identified disadvantaged neighborhoods as having the greatest elevated blood lead level increases and informed response prioritization during the now-declared public health emergency. Conclusions. The percentage of children with elevated blood lead levels increased after water source change, particularly in socioeconomically disadvantaged neighbor- hoods. Water is a growing source of childhood lead exposure because of aging infra- structure. (Am J Public Health. 2016;106:283–290. doi:10.2105/AJPH.2015.303003) See also Rosner, p. 200. In April 2014, the postindustrial city ofFlint, Michigan, under state-appointed emergency management, changed its water supply from Detroit-supplied Lake Huron water to the Flint River as a temporary measure, awaiting a new pipeline to Lake Huron in 2016. Intended to save money, the change in source water severed a half- century relationship with the Detroit Water and Sewage Department. Shortly after the switch to Flint River water, residents voiced concerns regarding water color, taste, and
  • 3. odor, and various health complaints in- cluding skin rashes.1 Bacteria, including Escherichia coli, were detected in the distri- bution system, resulting in Safe Drinking Water Act violations.2 Additional disinfec- tion to control bacteria spurred formation of disinfection byproducts including total tri- halomethanes, resulting in Safe Drinking Water Act violations for trihalomethane levels.2 Water from the Detroit Water and Sewage Department had very low corrosivity for lead as indicated by low chloride, low chloride-to-sulfate mass ratio, and presence of an orthophosphate corrosion inhibitor.3,4 By contrast, Flint River water had high chloride, high chloride-to-sulfate mass ratio, and no corrosion inhibitor.5 Switching from Detroit’s Lake Huron to Flint River water created a perfect storm for lead leach- ing into drinking water.6 The aging Flint water distribution system contains a high percentage of lead pipes and lead plumbing, with estimates of lead service lines ranging from 10% to 80%.7 Researchers from Virginia Tech University reported increases in water lead levels (WLLs),5 but changes in blood lead levels (BLLs) were unknown. Lead is a potent neurotoxin, and child- hood lead poisoning has an impact on many developmental and biological pro- cesses, most notably intelligence, behavior,
  • 4. and overall life achievement.8 With estimated societal costs in the billions,9–11 lead poi- soning has a disproportionate impact on low-income and minority children.12 When one considers the irreversible, life-altering, costly, and disparate impact of lead exposure, primary prevention is necessary to eliminate exposure.13 Historically, the industrial revolution’s introduction of lead into a host of products has contributed to a long-running and largely silent pediatric epidemic.14 With lead now removed from gasoline and paint, the incidence of childhood lead poisoning has decreased.15 However, lead contamina- tion of drinking water may be increasing because of lead-containing water in- frastructures, changes in water sources, and changes in water treatment including disin- fectant.16–18 A soluble metal, lead leaches into drinking water via lead-based plumbing or lead particles that detach from degrading plumbing components. (“Plumbing” is derived from the Latin word for lead, ABOUT THE AUTHORS Mona Hanna-Attisha and Allison Champney Schnepp are with Hurley Children’s Hospital/Michigan State University College of Human Medicine, Department of Pediatrics and Human Development, Flint, MI. Jenny LaChance is with Hurley Medical Center Research, Flint. Richard Casey Sadler is with Michigan State University College of Human Medicine, Division of Public Health, Flint. Correspondence should be sent to Mona Hanna-Attisha, MD,
  • 5. MPH, FAAP, Hurley Medical Center, Pediatrics 3W, One Hurley Plaza, Flint, MI 48503 (e-mail: [email protected]). Reprints can be ordered at http://www.ajph.org by clicking the “Reprints” link. This article was accepted November 21, 2015. doi: 10.2105/AJPH.2015.303003 February 2016, Vol 106, No. 2 AJPH Hanna-Attisha et al. Peer Reviewed Research 283 AJPH RESEARCH mailto:[email protected] http://www.ajph.org Kourt Highlight “plumbum.”) Lead was restricted in plumb- ing material in 1986, but older homes and neighborhoods may still contain lead service lines, lead connections, lead solder, or other lead-based plumbing materials. Lead solubility and particulate release is highly variable and depends on many factors in- cluding water softness, temperature, and acidity.19–21 The US Environmental Pro- tection Agency (EPA) regulates lead in public water supplies under the Safe Drinking Water Act Lead and Copper Rule, which requires action when lead levels reach 15 parts per billion (ppb). Lead in drinking water is different from
  • 6. lead from other sources, as it disproportion- ately affects developmentally vulnerable children and pregnant mothers. Children can absorb 40% to 50% of an oral dose of water-soluble lead compared with 3% to 10% for adults.22 In a dose–response relationship for children aged 1 to 5 years, for every 1-ppb increase in water lead, blood lead increases 35%.23 The greatest risk of lead in water may be to infants on reconstituted formula. Among infants drinking formula made from tap water at 10 ppb, about 25% would ex- perience a BLL above the Centers for Disease Control and Prevention (CDC) elevated blood lead level (EBLL) of 5 micrograms per deciliter (mg/dL).24 Tap water may account for more than 85% of total lead exposure among infants consuming reconstituted formula.25 A known abortifacient, lead has also been implicated in increased fetal deaths and reduced birth weights.26 As recommended by the CDC and supported by the American Academy of Pediatrics, blood lead screening is routine for high-risk populations and for children insured by Medicaid at age 1 and 2 years.27 The CDC-recommended screening ages are based on child development (increased oral–motor behavior), which places a child most at risk for house-based lead exposure (e.g., peeling paint, soil, dust). State and national blood lead–screening programs, however, do not adequately capture the risk of lead in water because infants are at
  • 7. greatest risk. Armed with reports of elevated WLLs and recognizing the lifelong consequences of lead exposure, our research team sought to analyze blood lead data before (pre) and after (post) the water source switch with a geographic information system (GIS) to determine lead exposure risk and prioritize responses. This research has immediate public policy, public health, environmental, and socioeconomic implications. This research includes Flint, Michigan, and surrounding municipalities in Genesee County (Greater Flint). Greater Flint is a postindustrial region of nearly 500 000 people struggling from years of disinvestment by the automobile industry and associated manufacturing activities: the region has lost 77% of its manufacturing employment and 41% of employment overall since 1980.28 National and local data sources demonstrate dismal indicators for children, especially within Flint city limits.29–32 Greater Flint ranks toward the bottom of the state in rates of childhood poverty (42% in Flint vs 16.2% in Michigan and 14.8% in the United States), unemployment, violent crime, illicit drug use, domestic violence, preterm births, infant mortality, and overall health outcomes (81st out of 82 Michigan counties). Greater Flint’s struggles have been am-
  • 8. plified by a history of racial discrimination, whereby exclusionary housing practices were common.33,34 Such attitudes toward in- tegration later precipitated White flight and emboldened home-rule governance,35,36 causing a massive decline in tax revenue for the city. The declining industrial and resi- dential tax bases strained the city’s ability to provide basic services and reversed the public health fortunes of the city and suburbs.37 Severely reduced city population densities reduced water demand in the distribution system, exacerbating problems with lead corrosion. METHODS This retrospective study includes all chil- dren younger than 5 years who had a BLL processed through the Hurley Medical Center’s laboratory, which runs BLLs for most Genesee County children. The pre time period (before the water source change) was January 1, 2013, to September 15, 2013, and the post time period (after the water source change) was January 1, 2015, to September 15, 2015. The primary study group comprised children living within the city of Flint (n = 1473; pre = 736; post = 737) who received water from the city water system. Children living outside the city where the water source was unchanged served as a comparison group (n = 2202; pre = 1210;
  • 9. post = 992). After institutional review board approval and Health Insurance Portability and Accountability Act waiver, we drew data from the Epic electronic medical record system including BLL, medical record number, date of birth, date of blood draw, full address, sex, and race. For each child, only the highest BLL was maintained in the data set. We coded timing (pre or post) of the BLL on the basis of the date of blood draw. We calculated age at time of blood draw. We geocoded the data set with a dual- range address locator, and manually con- firmed accuracy of geocoded addresses. We conducted a series of spatial joins to assign participant records to Greater Flint munici- palities and Flint wards (including those with high WLL), enabling the calculation of the number and percentage of children with EBLLs in each geographic region for both time periods. The reference value for EBLL was 5 mg/dL or greater. We identified Flint wards with high WLLs with water lead sampling maps.38 Wards 5, 6, and 7 had the highest WLLs; in each ward, more than 25% of samples had a WLL higher than 15 ppb. We theorized that children living in this combination of wards would have the highest incidence of EBLLs (referred to as “high WLL Flint”; the remainder of Flint was referred to as “lower WLL Flint”). We derived overall neighborhood-level
  • 10. socioeconomic disadvantage from census block group variables intended to measure material and social deprivation. We calculated these scores from an unweighted z score sum of rates of lone parenthood, poverty, low educational attainment, and unemployment (adapted from Pampalon et al.39; used pre- viously in Flint by Sadler et al.40), and assigned these to each child on the basis of home address. Positive values denote higher disad- vantage, and negative values denote lower disadvantage. Table 1 highlights the overall socioeconomic disadvantage score compari- son by time period and area. We created spatial references for EBLL risk and a predictive surface for BLL by using GIS, providing the ability to see otherwise invisible spatial–temporal patterns in envi- ronmental exposure.17 Because of the need to AJPH RESEARCH 284 Research Peer Reviewed Hanna-Attisha et al. AJPH February 2016, Vol 106, No. 2 understand spatial variations and geo- graphically target resources, we also ran ordinary Kriging with a spherical semivario- gram model on the entire data set for Greater Flint, allowing interpolation of associated BLL risks with lead in water. Previous methods for evaluating spatial variation in lead levels have ranged from multivariable
  • 11. analyses at the individual level41 to in- terpolation methods such as inverse distance weighting42 and Kriging.43 Given our as- sumption that lead risk is spatially correlated in Greater Flint because of the age and condition of pipes, interpolation methods are appro- priate for building a preliminary risk surface. Both inverse distance weighting and Kriging derive such surfaces by calculating values at unmeasured locations based on weighting nearby measured values more strongly than distant values.44 Whereas inverse distance weighting is a deterministic procedure and relies on predetermined mathematical for- mulae, Kriging has the added sophistication of using geostatistical models that consider spatial autocorrelation, thereby improving accuracy of prediction surfaces (ArcGIS Desktop version 10.3, Environmental Sys- tems Research Institute, Redlands, CA). As well, Kriging can be run with relatively few input points: adequate ranges fall be- tween 30 and 100 total points, although Kriging has been conducted with just 7.44 Our city of Flint sample included 736 children in the pre period and 737 children in the post period, which amounts to a density of approximately 22 points per square mile. Kriging has become an increasingly common method for measuring variations in soil lead, and is given more in-depth treat- ment elsewhere.45 To examine change in proportion of children with EBLL from the pre to post time periods, we used c2 analysis
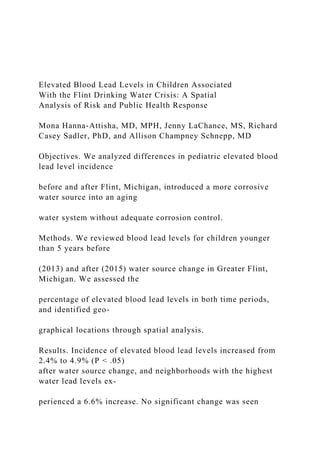
  • 12. with continuity correction for each area (outside Flint, all Flint, high WLL Flint, and lower WLL Flint). In addition, we ex- amined differences in overall socioeconomic disadvantage scores from the pre to post time periods by using the independent t test. Finally, we used both c2 analysis with con- tinuity correction and 1-way ANOVA to assess demographic differences by area. We used post hoc least significant difference analysis following statistically significant 1-way ANOVAs. RESULTS We uncovered a statistically significant increase in the proportion of Flint children with EBLL from the pre period to the pro- portion of Flint children in the post period. In the pre period, 2.4% of children in Flint had an EBLL; in the post period, 4.9% of children had an EBLL (P < .05). By compar- ison, outside of Flint water, the change in EBLL was not statistically significant (0.7% to 1.2%; P > .05). In high WLL Flint, EBLL increasedfrom4.0%to10.6%(P < .05).Figure1 shows the EBLL percentage change per area. Results of the GIS analyses show signifi- cant clustering of EBLLs within the Flint city limits. According to ordinary Kriging, Figure 2 shows a predicted surface based on observations of actual child BLL geocoded to home address to visualize BLL variation over space (measured in mg/dL). The darkest shades of red represent the highest risk for
  • 13. EBLL based on existing observations. Outside Flint, the entire county falls entirely within the lowest half of the range (in shades of blue); the only locations where predicted BLL is greater than 1.75 mg/dL is within Flint city limits. Within Figure 2, each ward is also labeled according to the percentage of water samples that exceeded 15 ppb. The areas with the highest WLLs strongly coincide with the areas with the highest predicted BLLs. In addition, the high percentage of EBLL in wards 5, 6, and 7 also correspond with the high WLLs in wards 5, 6, and 7 (the labels in Figure 2). Table 2 shows ward-specific WLLs, pre period and post period EBLL percentages, and predicted BLL and predicted change in BLL from Kriging. Areas experiencing the highest predicted BLL in the post period (Figure 2) are generally also areas with greatest change in predicted BLL (measured in mg/dL) when compared with the pre period (Table 2; Figure A, available as a supplement to the online ver- sion of this article at http://www.ajph.org). Figure A quantifies this rate of change with a green to red scale: large increases are shown in increasingly darker shades of red, whereas large decreases are shown in in- creasingly darker shades of green. These once again match with city wards that ex- perienced greater rates of EBLL percentage increase (Figure 1, Table 2). In wards 5 and 6 (which experienced a predicted 0.51 and
  • 14. 0.27 mg/dL increase, respectively), the EBLL percentage more than tripled. In ward 5, the EBLL percentage increased from 4.9% to 15.7% (P < .05). The area of intersection between wards 3, 4, and 5 (in the east side of the city) also appeared high in the Kriging analysis of Figure 2, and with a different unit of aggregation this neighborhood would also exhibit a significant increase in EBLL percentage. Ward 7 had high pre period and post period EBLL percentage levels above 5% (with a particularly high rate in the western portion of the ward). Citywide, TABLE 1—Demographic Comparison of the Time Periods Before (Pre) and After (Post) Water Source Change From Detroit-Supplied Lake Huron Water to the Flint River, by Area: Flint, MI, 2013 and 2015 Outside Flint All Flint High WLL Flint Lower WLL Flint Characteristic Pre Post Pre Post Pre Post Pre Post Gender, % Male 51.6 49.5 48.6 52.9 47.6 54.4 49.1 52.3 Female 48.4 50.5 51.4 47.1 52.4 45.6 50.9 47.7 Race/ethnicity, % African American 24.3 24.5 69.4 70.6 74.9 78.8 67.0 66.9 Other categories 75.7 75.5 30.6 29.4 25.1 21.2 33.0 33.1
  • 15. Age, y, mean 1.89 1.83 2.09 2.06 2.06 2.02 2.11 2.07 Overall socioeconomic disadvantage score –0.83 –0.98 2.94 2.88 2.18 2.39 3.28 3.10 Note.WLL = water lead level. No statistically significant differences were found in any pre–post value within any of the 4 geographical areas. AJPH RESEARCH February 2016, Vol 106, No. 2 AJPH Hanna-Attisha et al. Peer Reviewed Research 285 http://www.ajph.org 4 wards (1, 4, 7, and 9) experienced decreases in predicted BLL, 3 wards (2, 5, and 6) experienced large increases, and 2 wards (3 and 8) remained largely the same (Figure A). Overall, statistically significant differences exist between the areas examined (outside Flint, high WLL Flint, and lower WLL Flint) in all demographic characteristics except sex. The overall percentage of African American children is 24.4% outside Flint, compared with 76.8% in high WLL Flint and 67.0% in lower WLL Flint (P < .001). Children outside Flint were younger (mean = 1.86 years [SD = 1.10]) than high WLL Flint (mean = 2.04 years [SD = 1.02]) and lower
  • 16. WLL Flint (mean = 2.09 years [SD = 1.07]; P < .001). Differences in overall socioeco- nomic disadvantage scores are likewise sig- nificant (P < .001). Post hoc least significant difference analysis shows statistically signifi- cant differences for overall socioeconomic disadvantage between outside Flint and high WLL Flint (P < .001), between outside Flint and lower WLL Flint (P < .001), and between high WLL Flint and lower WLL Flint (P < .001). DISCUSSION Our findings reveal a striking increase in the percentage of Flint children with EBLL when we considered identical seasons before and after the water source switch, with no statistically significant increase in EBLL outside Flint. The spatial and statistical ana- lyses highlight the greatest EBLL increase within certain wards of Flint, which corre- spond to the areas of elevated WLLs. A review of alternative sources of lead exposure reveals no other potential envi- ronmental confounders during the same time period. Demolition projects by the Genesee County Land Bank Authority (Heidi Phaneuf, written communication, October 29, 2015) showed no spatial relationship to the areas of increased EBLL rates. As well, no known new lead-producing factories nor changes in indoor lead remediation programs were implemented during the study
  • 17. period. Although Flint has a significant automobile history, the historical location of potentially lead-using manufacturing (e.g., battery plants, paint and pigment storage, production plants) do not align with current exposures. Because there was no known alternative source for increased lead exposure during this time period, the geospatial WLL results, the innate corrosive properties of Flint River water, and, most importantly, the lack of corrosion control, our findings strongly implicate the water source change as the probable cause for the dramatic increase in EBLL percentage. As in many urban areas with high levels of socioeconomic disadvantage and minority populations,46 we found a preexisting dis- parity in lead poisoning. In our pre water source switch data, the EBLL percentage in Flint was 2.4% compared with 0.7% outside Flint. This disparity widened with a post water source switch Flint EBLL of 4.8%, with no change in socioeconomic or demographic variables (Table 1). Flint children already suffer from risk factors that innately increase their lead exposure: poor nutrition, con- centrated poverty, and older housing stock. With limited protective measures, such as low rates of breastfeeding,47,48 and scarce resources for water alternatives, lead in water further exacerbates preexisting risk factors. Increased lead-poisoning rates have profound
  • 18. implications for the life course potential of an entire cohort of Flint children already rattled with toxic stress contributors (e.g., poverty, violence, unemployment, food insecurity). This is particularly troublesome in light of recent findings of the epigenetic effects of lead exposure on one’s grandchildren.49 The Kriging analysis showed the highest predicted BLLs within the city along a wide swath north and west of downtown. This area has seen significant demographic change, an increase in poverty, and an increase in vacant properties, especially over the past 25 years (Richard Sadler, written commu- nication, October 5, 2015). Higher BLLs were also predicted northeast of downtown and in other older neighborhoods where poverty and vacancy rates have been high for many decades. Significantly, the biggest changes in predicted BLL since 2013 were also found in these impoverished neighbor- hoods; more stable neighborhoods in the far north and south of the city may have experienced improved predicted BLLs be- cause of prevention efforts taken by the more-often middle-class residents in response to the water source change. Of considerable interest is that the areas shown as having the best public health indices by Board and Dunsmore in Figure 2 of their 1948 article37 are virtually identical to the areas with the worst lead levels today. After our preliminary zip code–based
  • 19. findings (pre to post water source switch 0.7 2.4 4 1.8 1.2 4.9 10.6 2.3 0 2 4 6 8 10 12 Outside Flint All Flint* High WLL Flint* Lower WLL Flint Pe rc
  • 20. en ta g e Pre Post Area Examined Note. WLL = water lead level. *P < .05. FIGURE 1—Comparison of Elevated Blood Lead Level Percentage, Before (Pre) and After (Post) Water Source Change From Detroit-Supplied Lake Huron Water to the Flint River: Flint, MI, 2013 and 2015 AJPH RESEARCH 286 Research Peer Reviewed Hanna-Attisha et al. AJPH February 2016, Vol 106, No. 2 EBLL = 2.1% to 4.0%; P < .05) were shared at a press conference,50 the City of Flint and the Genesee County Health Department released health advisories,51 and the county health department subsequently declared a public health emergency.52 Shortly after, the State of Michigan released an action plan with short- and long-term solutions focusing on additional sampling, filter dis-
  • 21. tribution, and corrosion control.53 One week later, Michigan’s governor revealed WLLs in 3 schools to be in the toxic range with 1 school showing a water lead level of 101 ppb, almost 7 times the level that requires remediation.54 A $12 million plan to reconnect to Detroit’s water source was announced.54 We undertook our current spatial analytic approach to overcome limitations of zip code boundaries and to develop a more thorough understanding of specific areas in Flint where EBLL risk is more severe (post office addresses often do not align with municipal boundaries in Michigan, and one third of Flint mailing addresses are not in the city of Flint). This spatial analysis is valuable for understanding subneighborhood patterns in EBLL risk because aggregation by zip code or ward minimizes the richness of spatial variation and creates artificial barriers that may obscure hot spots (as in the confluence of wards 3, 4, and 5). Such use of spatial analysis for estimating lead exposure risk has been used to target blood lead–screening programs. In our case, in addition to identifying areas of risk, spatial analysis helps guide municipal and nongovernmental relief efforts aimed at identifying vulnerable populations in specific neighborhoods for priority distribution of resources (e.g., bottled water, filters, pre-
  • 22. mixed formula). Limitations Our research contains a few limitations. First, we may have underestimated water- based lead exposure. Our sample included all children younger than 5 years with blood lead screening, although the greatest risk from lead in water is in utero and during infancy when lead screening is not done. If lead screening were recommended at a younger age (e.g., 6 or 9 months) for children who live in homes with potential lead piping or lead service lines, more children with EBLL from water could be identified, although state and national comparison rates would be lacking. Second, lead screening is not completed for all children. It is mandated by Medicaid and CDC-recommended for other high-risk groups; such data may be skewed toward higher-risk children and thus overestimate EBLL, especially in non–high-risk areas. Third, the underserved population of Flint has significant housing instability: lead levels may reflect previous environmental expo- sure, and exposure often cannot be ade- quately estimated on the basis of current residence alone.55 Fourth, although large, our sample does not reflect all lead screening from Flint. We estimate that our data capture approxi- mately 60% to 70% of the Michigan Child- hood Lead Poisoning Prevention Program
  • 23. data for Flint. Annual data released from this program further support our findings, revealing an annual decrease in EBLL per- centage from May to April 2010 to 2011 until the same period in 2013 to 2014 (4.1%, Ward 2 WLL = 25% Ward 6 WLL = 28% Ward 7 WLL = 28% Ward 8 WLL = 20% 0.7–0.75 (more optimal) 0.76–1 1.01–1.25 1.26–1.5 1.51–1.75 1.76–2 2.01–2.25 2.26–2.5 2.51–2.75 2.76–3.36 (more hazardous) *Nonresidential zones screened from results
  • 24. *Ward labels indicate % of ward where any water sample exceeded 15 ppb Flint City Wards Major streets Predicted BLL Based on Ordinary Kriging (μg/dL) Ward 9 WLL = 20% 0 0.25 0.5 1 Miles N Ward 5 WLL = 32% Ward 3 WLL = 18% Ward 4 WLL = 6% Ward 1 WLL = 10% Note. BLL = blood lead level; WLL = water lead level. FIGURE 2—Predicted Surface of Child Blood Lead Level and Ward-Specific Elevated Water Lead Level After (Post) Water Source Change From Detroit- Supplied Lake Huron Water to the Flint River: Flint, MI, 2015 AJPH RESEARCH February 2016, Vol 106, No. 2 AJPH Hanna-Attisha et al. Peer Reviewed Research 287
  • 25. 3.3%, 2.7%, 2.2%, respectively56; Robert L. Scott, e-mail correspondence, September 25, 2015). Following the water switch in April 2014, the 4-year declining trend (as seen nationally) reversed with an annual EBLL of 3.0%. We found consistent results (with control for age and methodology) when we analyzed Michigan Childhood Lead Poisoning Prevention Program data for both high WLL Flint (EBLL percentage in- creased: 6.6% to 9.6%) and outside Flint (EBLL percentage remained virtually unchanged: 2.2% to 2.3%). Our institution- processed laboratory blood lead tests, how- ever, had an even greater proportion of children with EBLLs versus state data in the post period. This may reflect that the BLLs processed at Hurley Medical Center, the region’s only safety-net public hospital, represent a patient population most at risk with limited resources to afford tap water alternatives. Conclusions and Future Research Future research directions include con- ducting more detailed geospatial analyses of lead service-line locations with locations of elevated BLLs and WLLs; repeating identical spatial and statistical analyses in the same time period in 2016 reflecting changes associated with the health advisory
  • 26. and return to Lake Huron source water; analyzing feeding type (breastfed or recon- stituted formula) for children with EBLLs; analyzing cord blood lead of Flint newborns compared with non-Flint newborns; and conducting water lead testing from homes of children with EBLLs. A once celebrated cost-cutting move for an economically distressed city, the water source change has now wrought untold economic, population health, and geo- political burdens. With unchecked lead ex- posure for more than 18 months, it is fortunate that the duration was not longer (as was the case in Washington, DC,’s lead-in- water issue).16 Even so, the Flint drinking water crisis is a dramatic failure of primary prevention. The legal safeguards and regu- lating bodies designed to protect vulnerable populations from preventable lead exposure failed. The Lead and Copper Rule requires water utilities to notify the state of a water source or treatment change recognizing that such changes can unintentionally have an impact on the system’s corrosion control.57 Although a review is required before implementing changes, the scope of risk as- sessment is not specified and is subject to misinterpretation. In response to the Flint drinking water crisis, the EPA recently re- leased a memo reiterating and clarifying the
  • 27. need for states to conduct corrosion control reviews before implementing changes.58 This recommendation is especially relevant for communities with aging in- frastructures, usurped city governance, and minimal water utility capacity; in such situ- ations, there is an increased need for state and federal expertise and oversight to support decisions that protect population health. Through vigilant public health efforts, lead exposure has fallen dramatically over the past 30 years.13 With the increasing recog- nition that no identifiable BLL is safe and without deleterious and irreversible health outcomes,13 Healthy People 2020 identified the elimination of EBLLs and underlying disparities in lead exposure as a goal.59 Regrettably, our research reveals that the potentially increasing threat of lead in drinking water may dampen the significant strides in childhood lead-prevention efforts. As our aging water infrastructures continue to decay, and as communities across the nation struggle with finances and water supply sources, the situation in Flint, Michigan, may be a harbinger for future safe drinking-water challenges. Ironically, even when one is surrounded by the Great Lakes, safe drinking water is not a guarantee. CONTRIBUTORS M. Hanna-Attisha originated the study, developed
  • 28. methods, interpreted analysis, and contributed to the writing of the article. J. LaChance and R. Casey Sadler assisted with the development of the methods, analyzed results, interpreted the findings, and contributed to the writing of the article. A. Champney Schnepp assisted with the interpretation of the findings and contributed to the writing of the article. ACKNOWLEDGMENTS We would like to thank Marc Edwards, PhD, and Elin Betanzo, MS, for their expert assistance with un- derstanding the historical and scientific background of lead in water. HUMAN PARTICIPANT PROTECTION This study was reviewed and approved by Hurley Medical Center institutional review board. REFERENCES 1. Associated Press. “I don’t even let my dogs drink this water.” CBS News. March 4, 2015. Available at: http:// www.cbsnews.com/news/flint-michigan-break-away- detroit-water-riles-residents. Accessed October 3, 2015. 2. City of Flint 2014 Annual Water Quality Report. 2014. Available at: https://www.cityofflint.com/wp-content/ uploads/CCR-2014.pdf. Accessed September 30, 2015. 3. Edwards M, Triantafyllidou S. Chloride to sulfate mass ratio and lead leaching to water. J Am Water Works Assoc. 2007;99(7):96–109. TABLE 2—Ward-Based Comparison of WLL Percentages, Pre- and Post-Switch EBLL Percentages, and Predicted Post BLL and Change in Predicted BLL by Ordinary Kriging
  • 29. Geostatistical Analysis: Flint, MI, 2013 and 2015 Ward WLL % > 15 ppb Pre EBLL% Post EBLL% Predicted Post BLLa Change in Predicted BLL From Pre to Post, mg/dL 1 10 0.0 2.8 1.4 –0.10 2 25 0.0 1.4 0.7 0.19 3 18 1.0 4.5 2.9 0.05 4 6 3.1 1.7 2.4 –0.15 5b 32 4.9 15.7 10.3 0.51 6b 28 2.2 9.3 5.5 0.27 7b 28 5.4 5.9 5.7 -0.26 8 20 2.7 1.4 2.0 0.01 9 20 3.4 1.6 2.5 –0.43 Note. BLL = blood lead level; EBLL = elevated blood lead level; WLL = water lead level. aOrdinary Kriging geostatistical analysis. bIndicates wards defined as high WLL risk in this study. AJPH RESEARCH 288 Research Peer Reviewed Hanna-Attisha et al. AJPH February 2016, Vol 106, No. 2 http://www.cbsnews.com/news/flint-michigan-break-away-
  • 30. detroit-water-riles-residents http://www.cbsnews.com/news/flint-michigan-break-away- detroit-water-riles-residents http://www.cbsnews.com/news/flint-michigan-break-away- detroit-water-riles-residents https://www.cityofflint.com/wp-content/uploads/CCR-2014.pdf https://www.cityofflint.com/wp-content/uploads/CCR-2014.pdf 4. Edwards M, McNeill LS. Effect of phosphate inhibitors on lead release from pipes. J Am Water Works Assoc. 2007; 94(1):79–90. 5. Edwards M, Falkinham J, Pruden A. Synergistic impacts of corrosive water and interrupted corrosion control on chemical/microbiological water quality: Flint, MI. National Science Foundation Grant abstract. Avail- able at: http://www.nsf.gov/awardsearch/showAward? AWD_ID=1556258&HistoricalAwards=false. Accessed September 10, 2005. 6. Guyette C. Scary: leaded water and one Flint family’s toxic nightmare. Deadline Detroit. July 9, 2015. Available at: http://www.deadlinedetroit.com/articles/12697/ scary_leaded_water_and_one_flint_family_s_toxic_ nightmare#.VfYm6eeZZJN. Accessed September 13, 2015. 7. Fonger R. Flint data on lead water lines stored on 45,000 index cards. Mlive Media Group. October 1, 2015. Available at: http://www.mlive.com/news/flint/index. ssf/2015/10/flint_official_says_data_on_lo.html. Accessed October 4, 2015. 8. Centers for Disease Control and Prevention. Pre- venting lead poisoning in young children. 2005. Available
  • 31. at: http://www.cdc.gov/nceh/lead/publications/ PrevLeadPoisoning.pdf. Accessed September 30, 2015. 9. Gould E. Childhood lead poisoning: conservative estimates of the social and economic benefits of lead hazard control. Environ Health Perspect. 2009;117(7): 1162–1167. 10. Landrigan PJ, Schechter CB, Lipton JM, Fahs MC, Schwartz J. Environmental pollutants and disease in American children: estimates of morbidity, mortality, and costs for lead poisoning, asthma, cancer, and de- velopmental disabilities. Environ Health Perspect. 2002;110 (7):721–728. 11. Schwartz J. Societal benefits of reducing lead expo- sure. Environ Res. 1994;66(1):105–124. 12. Pamuk E, Makuc D, Heck K, Reuben C, Lochner K. Socioeconomic status and health chartbook. Health, United States, 1998. Centers for Disease Control and Prevention. 1998. Available at: http://www.cdc.gov/ nchs/data/hus/hus98cht.pdf. Accessed October 1, 2015. 13. Low level lead exposure harms children. A renewed call for primary prevention. Report of the Advisory Committee on Childhood Lead Poisoning Prevention. Centers for Disease Control and Prevention. 2012. Available at: http://www.cdc.gov/nceh/lead/acclpp/ final_document_030712.pdf. Accessed September 2015. 14. Landrigan PJ, Graef JW. Pediatric lead poisoning in 1987: the silent epidemic continues. Pediatrics. 1987; 79(4):582–583. 15. Shannon MW. Etiology of childhood lead poisoning.
  • 32. In: Pueschel SM, Linakis JG, Anderson AC, eds. Lead Poisoning in Childhood. Baltimore, MD: Paul H. Brookes Publishing Company; 1996:37–58. 16. Edwards M, Triantafyllidou S, Best D. Elevated blood lead in young children due to lead-contaminated drinking water: Washington, DC. Environ Sci Technol. 2009;43(5):1618–1623. 17. Miranda ML, Kim D, Hull AP, Paul CJ, Overstreet Galeano MA. Changes in blood lead levels associated with use of choramines in water treatment systems. En- viron Health Perspect. 2007;111(2):221–225. 18. Edwards M. Designing sampling for targeting lead and copper: implications for exposure. Lecture presented to: the US Environmental Protection Agency National Drinking Water Advisory Group; September 18, 2014. 19. Davidson CI, Rabinowitz M. Lead in the environ- ment: from sources to human receptors. In: Needleman HL, ed. Human Lead Exposure. Boca Raton, FL: CRC Pres; 1991. 20. Gaines RH. The corrosion of lead. J Ind Eng Chem. 1913;5(9):766–768. 21. Raab GM, Laxen DPH, Anderson N, Davis S, Heaps M, Fulton M. The influence of pH and household plumbing on water lead concentration. Environ Geochem Health. 1993;15(4):191–200. 22. Toxicological profile for lead. US Department of Health and Human Services, Public Health Service, Agency for Toxic Substances and Diseases Registry. 2007. Available at: http://www.atsdr.cdc.gov/toxprofiles/
  • 33. tp13.pdf. Accessed October 6, 2015. 23. Ngueta G, Belkacem A, Tarduf R, St-Laurent J, Levallois P. Use of a cumulative exposure index to es- timate the impact of tap-water lead concentration on blood lead levels in 1-to 5-year-old children (Montreal, Canada). Environ Health Perspect. 2015; Epub ahead of print. 24. Triantafyllidou S, Gallagher D, Edwards M. Assessing risk with increasingly stringent public health goals: the case of water lead and blood lead in children. J Water Health. 2014;12(1):57–68. 25. US Environmental Protection Agency. Safe Drinking Water Act Lead and Copper Rule (LCR). Fed Regist. 1991;56:26460–26564. 26. Edwards M. Fetal death and reduced birth rates as- sociated with exposure to lead-contaminated drinking water. Environ Sci Technol. 2014;48(1):739–746. 27. Advisory Committee on Childhood Lead Poisoning Prevention. Recommendations for blood lead screening of young children enrolled in Medicaid: tar- geting a group at high risk. MMWR Recomm Rep. 2000; 49(RR-14):1–13. 28. Jacobs AJ. The impacts of variations in development context on employment growth: a comparison of cen- tral cities in Michigan and Ontario, 1980–2006. Econ Dev Q. 2009;23(4):351–371. 29. Kids Count Data Center. A project of the Annie E Casey Foundation. Available at: http://datacenter. kidscount.org/data#MI/3/0. Accessed September 26,
  • 34. 2015. 30. County health rankings and roadmaps: building a culture of health, county by county. Available at: http:// www.countyhealthrankings.org/app/michigan/2015/ overview. Accessed September 26, 2015. 31. Michigan MIECHV Needs Assessment FY2015. Available at: http://www.michigan.gov/documents/ homevisiting/Updated_MHVI_Needs_Assessment_ 2014_All_counties_474015_7.pdf. Accessed October 5, 2015. 32. US Census Bureau. Quick Facts Beta. Available at: http://www.census.gov/quickfacts/table/PST045214/ 00, 2629000,26. Accessed September 2015. 33. Lewis PF. Impact of Negro migration on the electoral geography of Flint, Michigan, 1932–1962: a cartographic analysis. Ann Assoc Am Geogr. 1965;55(1): 1–25. 34. Taeuber KE, Taeuber AF. Negroes in Cities: Residential Segregation and Neighborhood Change. Chicago, IL: Aldine Publishing Company: 1969. 35. Highsmith AR. Demolition means progress: urban renewal, local politics, and state-sanctioned ghetto formation in Flint, Michigan. J Urban Hist. 2009;35: 348–368. 36. Zimmer BG, Hawley AH. Approaches to the so- lution of fringe problems: preferences of residents in the Flint metropolitan area. Public Adm Rev. 1956;16(4): 258–268.
  • 35. 37. Board LM, Dunsmore HJ. Environmental health problems related to urban decentralization: as observed in a typical metropolitan community. Am J Public Health Nations Health. 1948;38(7):986–996. 38. Martin R, Tang M. Percent lead in water by Flint ward. Flint Water Study. 2015. Available at: http://i0.wp. com/flintwaterstudy.org/wp-content/uploads/2015/ 09/Flint-Ward-Map_252-989x1280-2.jpg. Accessed September 26, 2015. 39. Pampalon R, Hamel D, Gamache P, Raymond G. A deprivation index for health planning in Canada. Chronic Dis Can. 2009;29(4):178–191. 40. Sadler RC, Gilliland JA, Arku G. Community de- velopment and the influence of new food retail sources on the price and availability of nutritious food. J Urban Aff. 2013;35(4):471–491. 41. Hastings D, Miranda ML. Using GIS-based models to protect children from lead exposure in international series in operations research and management science. In: Johnson M, ed. Community-Based Operations Research: Decision Modeling for Local Impact and Diverse Populations. 1st ed. New York, NY: Springer-Verlag New York; 2012: 173–187. 42. Schwarz K, Pickett STA, Lathrop RG, Weathers KC, Pouyat RV, Cadenasso ML. The effects of the urban built environment on the spatial distribution of lead in residential soils. Environ Pollut. 2012;163:32–39. 43. Griffith DA, Doyle PG, Wheeler DC, Johnson DL. A tale of two swaths: urban childhood blood-lead levels
  • 36. across Syracuse, New York. Ann Assoc Am Geogr. 1998;88 (4):640–665. 44. Jernigan RW. A Primer on Kriging. Washington, DC: US Environmental Protection Agency; 1986. 45. Markus J, McBratney AB. A review of the contam- ination of soil with lead: II. Spatial distribution and risk assessment of soil lead. Environ Int. 2001;27(5): 399–411. 46. Schulz A, Northridge ME. Social determinants of health: implications for environmental health promotion. Health Educ Behav. 2004;31(4):455–471. 47. Genesee County Health Department. Re: Breast- feeding initiation challenge. 2010. Available at: http:// www.gchd.net/PressReleases/20100923bfeeding_ challenge.asp. Accessed October 6, 2015. 48. Sherlock JC, Quinn MJ. Relationship between blood lead concentrations and dietary lead intake in infants: the Glasgow Duplicate Diet Study 1979–1980. Food Addit Contam. 1986;3(2):167–176. 49. Sen A, Heredia N, Senut M-C, et al. Multigenera- tional epigenetic inheritance in humans: DNA methyl- ation changes associated with maternal exposure to lead can be transmitted to the grandchildren. Sci Rep. 2015;5:14466. 50. Fonger R. Elevated lead found in more Flint kids after water switch, study finds. Mlive Media Group. September 24, 2015. Available at: http://www.mlive.com/news/ flint/index.ssf/2015/09/study_shows_twice_as_many_ flin.html. Accessed November 8, 2015.
  • 37. 51. Fonger R. Flint makes lead advisory official, suggests water filters and flushing. Mlive Media Group. September 25, 2015. Available at: http://www.mlive.com/news/ flint/index.ssf/2015/09/flint_makes_lead_advisory_offi. html. Accessed October 6, 2015. AJPH RESEARCH February 2016, Vol 106, No. 2 AJPH Hanna-Attisha et al. Peer Reviewed Research 289 http://www.nsf.gov/awardsearch/showAward?AWD_ID=155625 8&HistoricalAwards=false http://www.nsf.gov/awardsearch/showAward?AWD_ID=155625 8&HistoricalAwards=false http://www.deadlinedetroit.com/articles/12697/scary_leaded_wa ter_and_one_flint_family_s_toxic_nightmare#.VfYm6eeZZJN http://www.deadlinedetroit.com/articles/12697/scary_leaded_wa ter_and_one_flint_family_s_toxic_nightmare#.VfYm6eeZZJN http://www.deadlinedetroit.com/articles/12697/scary_leaded_wa ter_and_one_flint_family_s_toxic_nightmare#.VfYm6eeZZJN http://www.mlive.com/news/flint/index.ssf/2015/10/flint_officia l_says_data_on_lo.html http://www.mlive.com/news/flint/index.ssf/2015/10/flint_officia l_says_data_on_lo.html http://www.cdc.gov/nceh/lead/publications/PrevLeadPoisoning. pdf http://www.cdc.gov/nceh/lead/publications/PrevLeadPoisoning. pdf http://www.cdc.gov/nchs/data/hus/hus98cht.pdf http://www.cdc.gov/nchs/data/hus/hus98cht.pdf http://www.cdc.gov/nceh/lead/acclpp/final_document_030712.p df http://www.cdc.gov/nceh/lead/acclpp/final_document_030712.p df
  • 38. http://www.atsdr.cdc.gov/toxprofiles/tp13.pdf http://www.atsdr.cdc.gov/toxprofiles/tp13.pdf http://datacenter.kidscount.org/data#MI/3/0 http://datacenter.kidscount.org/data#MI/3/0 http://www.countyhealthrankings.org/app/michigan/2015/overvi ew http://www.countyhealthrankings.org/app/michigan/2015/overvi ew http://www.countyhealthrankings.org/app/michigan/2015/overvi ew http://www.michigan.gov/documents/homevisiting/Updated_MH VI_Needs_Assessment_2014_All_counties_474015_7.pdf http://www.michigan.gov/documents/homevisiting/Updated_MH VI_Needs_Assessment_2014_All_counties_474015_7.pdf http://www.michigan.gov/documents/homevisiting/Updated_MH VI_Needs_Assessment_2014_All_counties_474015_7.pdf http://www.census.gov/quickfacts/table/PST045214/00,%20262 9000,26 http://www.census.gov/quickfacts/table/PST045214/00,%20262 9000,26 http://i0.wp.com/flintwaterstudy.org/wp- content/uploads/2015/09/Flint-Ward-Map_252-989x1280-2.jpg http://i0.wp.com/flintwaterstudy.org/wp- content/uploads/2015/09/Flint-Ward-Map_252-989x1280-2.jpg http://i0.wp.com/flintwaterstudy.org/wp- content/uploads/2015/09/Flint-Ward-Map_252-989x1280-2.jpg http://www.gchd.net/PressReleases/20100923bfeeding_challeng e.asp http://www.gchd.net/PressReleases/20100923bfeeding_challeng e.asp http://www.gchd.net/PressReleases/20100923bfeeding_challeng e.asp http://www.mlive.com/news/flint/index.ssf/2015/09/study_show s_twice_as_many_flin.html http://www.mlive.com/news/flint/index.ssf/2015/09/study_show s_twice_as_many_flin.html
  • 39. http://www.mlive.com/news/flint/index.ssf/2015/09/study_show s_twice_as_many_flin.html http://www.mlive.com/news/flint/index.ssf/2015/09/flint_makes _lead_advisory_offi.html http://www.mlive.com/news/flint/index.ssf/2015/09/flint_makes _lead_advisory_offi.html http://www.mlive.com/news/flint/index.ssf/2015/09/flint_makes _lead_advisory_offi.html 52. Johnson J. Don’t drink Flint’s water, Genesee County leaders warn. Mlive Media Group. October 1, 2015. Available at: http://www.mlive.com/news/flint/index. ssf/2015/10/genesee_county_leaders_warn_do.html. Accessed October 6, 2015. 53. Erb R, Gray K. State to tackle unsafe water in Flint with tests, filters. Detroit Free Press. October 2, 2015. Available at: http://www.freep.com/story/news/local/ michigan/2015/10/02/state-officials-outline-plan-flint- water/73200250. Accessed October 6, 2015. 54. J. Snyder announces $12 million-plan to fix Flint water. Detroit Free Press. October 8, 2015. Available at: http://www.freep.com/story/news/local/michigan/ 2015/10/08/snyder-flint-water-reconnect/73567778. Accessed October 8, 2015. 55. Kestens Y, Lebel A, Chaix B, et al. Association be- tween activity space exposure to food establishments and individual risk of overweight. PLoS One. 2012;7(8): e41418. 56. Tanner K, Kaffer N. State data confirms higher blood-lead levels in Flint kids. Detroit Free Press. Sep- tember 29, 2015. Available at: http://www.freep.com/
  • 40. story/opinion/columnists/nancy-kaffer/2015/09/26/ state-data-flint-lead/72820798. Accessed October 7, 2015. 57. US Environmental Protection Agency, Office of Water. Lead and Copper Rule 2007 short-term regula- tory revisions and clarifications state implementation guidance. June 2008. Available at: http://water.epa.gov/ lawsregs/rulesregs/sdwa/lcr/upload/New-Lead-and- Copper-Rule-LCR-2007-Short-Term-Regulatory- Revisions-and-Clarifications-State-Implementation- Guidance.pdf. Accessed October 25, 2015. 58. Grevatt PC. Lead and Copper Rule requirements for optimal corrosion control treatment for large drinking water systems. Memo to EPA Regional Water Division Directors, Regions I-X. November 3, 2015. Available at: http://flintwaterstudy.org/wp-content/uploads/2015/ 11/LCR-Requirements-for-OCCT-for-Large-DW- Systems-11-03-2015.pdf. Accessed December 8, 2015. 59. Healthy People 2020: topics and objectives index. Washington, DC: US Department of Health and Human Services; 2012. Available at: http://www.healthypeople. gov/2020/topicsobjectives2020. Accessed October 27, 2015. AJPH RESEARCH 290 Research Peer Reviewed Hanna-Attisha et al. AJPH February 2016, Vol 106, No. 2 http://www.mlive.com/news/flint/index.ssf/2015/10/genesee_co unty_leaders_warn_do.html http://www.mlive.com/news/flint/index.ssf/2015/10/genesee_co unty_leaders_warn_do.html
  • 41. http://www.freep.com/story/news/local/michigan/2015/10/02/sta te-officials-outline-plan-flint-water/73200250 http://www.freep.com/story/news/local/michigan/2015/10/02/sta te-officials-outline-plan-flint-water/73200250 http://www.freep.com/story/news/local/michigan/2015/10/02/sta te-officials-outline-plan-flint-water/73200250 http://www.freep.com/story/news/local/michigan/2015/10/08/sn yder-flint-water-reconnect/73567778 http://www.freep.com/story/news/local/michigan/2015/10/08/sn yder-flint-water-reconnect/73567778 http://www.freep.com/story/opinion/columnists/nancy- kaffer/2015/09/26/state-data-flint-lead/72820798 http://www.freep.com/story/opinion/columnists/nancy- kaffer/2015/09/26/state-data-flint-lead/72820798 http://www.freep.com/story/opinion/columnists/nancy- kaffer/2015/09/26/state-data-flint-lead/72820798 http://water.epa.gov/lawsregs/rulesregs/sdwa/lcr/upload/New- Lead-and-Copper-Rule-LCR-2007-Short-Term-Regulatory- Revisions-and-Clarifications-State-Implementation- Guidance.pdf http://water.epa.gov/lawsregs/rulesregs/sdwa/lcr/upload/New- Lead-and-Copper-Rule-LCR-2007-Short-Term-Regulatory- Revisions-and-Clarifications-State-Implementation- Guidance.pdf http://water.epa.gov/lawsregs/rulesregs/sdwa/lcr/upload/New- Lead-and-Copper-Rule-LCR-2007-Short-Term-Regulatory- Revisions-and-Clarifications-State-Implementation- Guidance.pdf http://water.epa.gov/lawsregs/rulesregs/sdwa/lcr/upload/New- Lead-and-Copper-Rule-LCR-2007-Short-Term-Regulatory- Revisions-and-Clarifications-State-Implementation- Guidance.pdf http://water.epa.gov/lawsregs/rulesregs/sdwa/lcr/upload/New- Lead-and-Copper-Rule-LCR-2007-Short-Term-Regulatory- Revisions-and-Clarifications-State-Implementation- Guidance.pdf
  • 42. http://flintwaterstudy.org/wp-content/uploads/2015/11/LCR- Requirements-for-OCCT-for-Large-DW-Systems-11-03- 2015.pdf http://flintwaterstudy.org/wp-content/uploads/2015/11/LCR- Requirements-for-OCCT-for-Large-DW-Systems-11-03- 2015.pdf http://flintwaterstudy.org/wp-content/uploads/2015/11/LCR- Requirements-for-OCCT-for-Large-DW-Systems-11-03- 2015.pdf http://www.healthypeople.gov/2020/topicsobjectives2020 http://www.healthypeople.gov/2020/topicsobjectives2020 Copyright of American Journal of Public Health is the property of American Public Health Association and its content may not be copied or emailed to multiple sites or posted to a listserv without the copyright holder's express written permission. However, users may print, download, or email articles for individual use. COMMUNITY DEVELOPMENT AND THE INFLUENCE OF NEW FOOD RETAIL SOURCES ON THE PRICE AND AVAILABILITY OF NUTRITIOUS FOOD RICHARD C. SADLER University of Western Ontario JASON A. GILLILAND University of Western Ontario
  • 43. GODWIN ARKU University of Western Ontario ABSTRACT: Studies have demonstrated links between the accessibility of food and multiple health outcomes. Policymakers engaged in local community development may use public health concerns as a strategy to procure funding for food retail initiatives. Few studies to date have demonstrated the impact that a new food retailer can have on geographic and economic access to nutritious food in a community, evidence which could support the case for new food retail. This paper examines the price and availability of food before and after the opening of two new groceiy stores in a former food desert in Elint, Michigan. The results indicate a substantial improvement in both geographic and economic food accessibility, and show no statistical difference betH'een prices at average grocery stores and the new stores. Discussion suggests that investment in poorer neighborhoods can be beneficial to the local population and the community at large by creating a local multiplier effect through increased spending in the community. I he evolution of North American food retailing has created gaps in the community food environment in some urban neighborhoods. Furey, Strugnell, and Mcllveen (2001) discuss how social, economic, and health-related consequences combine to create social exclusion among residents living in these "food deserts." Food retailers could effect change in food environments, but there is often a gap between the plans of large-scale retailers and local-level economic development strategies (Pothukuchi, 2005). Thus, researchers
  • 44. have suggested an increased role for planners and policymakers, who are tasked with promofing public welfare (Pothukuchi, 2004). Planners and policymakers can encourage local economic development in disadvantaged areas to make use of unique features like proximity to major transportation routes and existing social amenities (Porter, 1995). Despite a growing popularity of food policy councils among planning Direct correspondence to: Jason A. Gilliland, Department of Geography, University of Western Ontario, 1151 Richmond St., London, ON, Canada N6A 5C2. E-mail: [email protected] JOURNAL OF URBAN AFFAIRS, Volume 35, Number 4, pages 471-491. Copyright © 2012 Urban Affairs Association All rights of reproduction in any form reserved. ISSN: 0735-2166. DOI: 10.1111/j.l467-9906.2012.00624.x 472 I JOURNAL OF URBAN AFFAIRS | Vol. 35/No. 4/2013 and other municipal departments, the research to date is merely suggestive of the impact they can have on nurturing new food retail initiatives (Campbell, 2004). Additionally, most planners still regard economic development in the food system as the domain of the private market (Pothukuchi and Kaufman, 2000). This paper demonstrates the geographic and economic impact of two new food retail sources in a disadvantaged neighborhood of Flint, Michigan, one developed through a public/private
  • 45. partnership, and the other through traditional private investment. Food basket pricing in the neighborhood indicates a substantial improvement in the cost of groceries for residents due to lower prices at the new food retailers. Over one year, these cost savings translate into between 2- and 3-month's rent for an average apartment in the city. This case demonstrates the potential for multi-tiered benefits: for the investors (who are profitable), the neighborhood residents (who have improved geographic access and economic buying power), and the planners (who are responsible for policy-making that made investment attractive in the neighborhood). The article suggests that food retail should be considered as a development policy in socioeconomically disadvantaged neighborhoods underserved by current food retail patterns, both from a profit-motivated and community development standpoint. The Built Environment and Health The concern for geographic accessibility to food arises from research demonstrating in- equalities from living in food deserts, or areas where nutritious, affordable food is unavailable (Beaumont, Lang, Leather, & Mucklow, 1995). Increased prevalence of obesity and related ill- nesses have been found in these neighborhoods (Morland, Diez- Roux, & Wing, 2006; Wang, Kim, Gonzalez, MacLeod, & Winkleby, 2007). Some suggest that these disparities are created in part by the evolution of retail to larger store formats frequently found in suburban locations, leaving urban areas without nutritious food options (Lavin, 2000; Pothukuchi, 2005; Wrigley,
  • 46. 2001). These inequalities, however, are not simply locational issues. Poorer dietary habits among low-income residents may be linked to larger social inequities (Travers, 1996). Healthy diets are more expensive in food deserts (Drewnowski, Darmon, & Briend 2004; Furey et al., 2001 ; Larsen and Gilliland, 2009); studies have indicated a considerable premium paid—up to 76% higher—by residents shopping at local convenience stores rather than larger chain stores (Block and Kouba, 2006). This price disparity equates with less purchasing power, contributing to poorer diets among residents with limited mobility (Laraia, Siega-Riz, Kaufman, & Jones, 2004; Morland et al., 2006), since low-mobility residents are less able to travel great distances to access goods and services (Hanson and Schwab, 1987). Poor dietary habits are correlated with higher rates of obesity (Binkley, Eales, & Jekanowski 2000) and obesity-related health issues such as type-2 diabetes and cardiovascular disease (Mokdad et al., 2003). Obesity rates are lower among people living near healthy food out- lets (Lewis et al., 2005; Morland et al., 2006), and higher among those living nearer to fast food restaurants and convenience stores (Morland and Evenson, 2009; Poston and Foreyt, 1999). Fur- ther links show a negative correlation between income and fast- food consumption (Paeratakul, Ferdinand, Champagne, Ryan, & Bray, 2003) and a positive correlation between low-income neighborhoods and location of fast-food outlets (Gilliland, 2010; Cummins and Macintyre, 2002; Reidpath, Burns, Ganard, Mahoney, & Townsend, 2002). This
  • 47. suggests that low-income residents in distressed neighborhoods are most at risk of developing poor eating habits due to increased ex- posure to unhealthy foods. This elevated risk increases the likelihood of social and health-related problems. Despite heightened exposure to unhealthy food options, many residents in low-income, food insecure communities are aware of the options for healthy eating near their homes (Freedman and Bell, 2009), but may be hindered by mobility or economic constraints (Darmon, Ferguson, & I Community Development and the Influence of New Food Retail Sources 473 Briend, 2002). Residents in communities without supermarkets tend to perceive fewer nutritious food options, suggesting the importance of larger, more visible grocery stores (Moore, Diez-Roux, & Brines, 2008). Although people are aware of the benefits of nutritious food, they may lack the political clout or economic capital to bring nutritious food retailers to their neighborhoods. Thus, this public health and urban planning issue merits further attention. Quantifying the Food Environment Because of the economic implications of living in neighborhoods without grocery stores, it is important to quantify variations in price of groceries within and between different neighborhoods.
  • 48. Many studies have employed nutritious food basket surveys to determine the affordability of foods in neighborhoods (Chung and Myers, 1999; Cummins and Macintyre, 2002; Friel, Walsh, & McCarthy, 2006; Larsen and Gilliland, 2009; Pearson, Russell, Campbell, & Barker, 2005).' While residents do not always shop at the nearest grocery store (Rose and Richards, 2004), the most socioeconomically distressed populations are far more likely to shop near home (Clifton, 2004). Thus, food basket pricing is particulady useful for determining the prices of groceries for residents with mobility constraints or those in low-income communities. Food basket surveys have ranged from only 9 fruits and vegetables (Pearson et al, 2005) to 146 items from all food groups (Friel et al., 2006). Some used food baskets pre-tested by public health authorities (Chung and Myers, 1999; Cummins and Macintyre, 2002; Furey et al., 2001). Many simply used the cheapest price for each basket item (Cummins and Macintyre, 2002; Donkin, Dowler, Stevenson, & Turner, 1999; Jetter and Cassady, 2006; Larsen and Gilliland, 2009; Morland and Filomena, 2007; Winkler, Turrell, & Patterson, 2006), representing the lowest price a household could expect to spend. Others collected multiple prices for the cheapest brand, the leading brand and outlet brands (Friel et al., 2006), or prices for the most popular brand and package size (Chung and Myers, 1999). In every case, the goal is to determine price differences between and within store types and neighborhoods. Groceries are frequently more expensive at
  • 49. convenience stores than at grocery stores, and prices at independent grocers are higher than at larger chain grocery stores (White, 2007; Winkler et al., 2006). Thus, the presence of a grocery store may not alleviate a disadvantage in the affordability of nutritious foods. But being in a poorer neighborhood does not necessarily equate with higher prices, since prices tend to vary more by store type than store location (Larsen and Gilliland, 2009). GIS analysis and food basket pricing are used to quantify the contribution of two new grocery stores in a former food desert in Flint, Michigan. Because food basket studies typically only examine the price or availability of food with cross-sectional study designs (Cummins and Macintyre, 2002; Jetter and Cassady, 2006; Morland and Filomena, 2007; Pearson et al., 2005), this before-and-after study represents an important contribution to knowledge on the literature regarding food accessibility and availability. Other researchers and cities can use this information to justify plans for retailers of nutritious foods in disadvantaged neighborhoods. Study Area and Research Context Flint, Michigan, exemplifies the declining medium-sized american city portrayed by Mayer and Greenberg (2001). Once reliant on a major industry for jobs (General Motors), Flint suffered from severe deindustrialization, resulting in an economic depression and substantial job losses. A 77% decline in manufacturing employment in Flint since 1980 has translated into a 41% overall
  • 50. decline in jobs (Jacobs, 2009). The city peaked at neariy 200,000 residents in the 1960s and at the time was expected to nearly double in size within 50 years (Segoe and Associates, 1960). Instead, 474 I JOURNAL OF URBAN AFFAIRS I Vol. 35/No. 4/2013 the current population has shrunk to 102,434 (U.S. Census Bureau, 2010), a 48% decline. This decline was exacerbated by long-standing preferences by both city and county residents alike for home rule over annexation of surrounding municipalities, stymieing the capture of suburban tax bases for city services (Zimmer and Hawley, 1956a). Paradoxically, many of these suburban municipalities had better attitudes toward tax increases, but resisted annexation to the central city (Zimmer and Hawley, 1956b). Thus, while out-county municipalities remained stable or grew in population, the city was increasingly "choked" by the surrounding municipalities with nowhere to grow, and a declining housing stock contributing to the population loss (Highsmith, 2009). The result of this decline is quantified in a recent study on Flint's urban form, which indicates that many neighborhoods have lost so many residences as to be at near-rural levels of density by units per acre (Hollander, 2010). An expected outcome of this decline in residential population is an accompanying decline in the quantity and quality of services, both public (e.g., schools, parks) and private (e.g., retail, commercial employment). Based on network analysis of
  • 51. occupied residential parcels in 2009, 73% of the city's population resided more than 1000 meters (0.6 miles, or a 10-minute walk) from a grocery store (Figure 1). Because of the sharp decline of industrial jobs and corresponding resources, Flint has continued to rely on traditional models of economic development. As past research has shown for other localities (Mayer and Greenberg, 2001), city leaders in Flint likely believed the problem would remedy itself or that little could be done to ameliorate the problem. Many redevelopment strategies have failed due to unrealistic scale or an inability to focus on local economic development, as Krumholz (1991) has suggested with other cities. Thus, the abandonment of traditional retail from established neighborhoods in Flint has been long established and persistent. Despite this decline, certain neighborhoods in Flint have remained stable or are seeing revival. These locations exhibit several elements important for economic and community development— including lower crime rates, the presence of health care services, institutions of higher learn- ing, and transportation connectivity (Reese and Ye, 2011). Sustained public investment in the education and health care sectors in and near downtown has created demand for private invest- ment in the form of retail, apartments, lofts, and student residences. The influx of capital and residential population into the neighborhood increased the demand for a food retail outlet. With the financial backing of non-profit agencies, an
  • 52. independent grocery called Witherbee's Market opened a 10,000 square foot store in June 2010 in the heart of the downtown food desert. Another grocery store (Mr. B's Foodland) opened just south of downtown in January 2010. Prior to this, downtown had not had a grocery store since the Farah Brothers Supermarket burned down in 1999 (Polk & Co., 1998,1999). These stores reflect a change in the mentality toward reinvestment downtown; previous economic development plans included the failed Autoworld, Water Street festival marketplace, and the Hyatt Regency Hotel (Highsmith, 2009). Incentives were given to Witherbee's store operators to aid in development, including a brownfield tax incentive, three EDA loans from the local economic development corporation, and a commercial revitaiization deduction (City of Flint, 2010). The opening of these stores has major implications for economic development strategies, since they can serve as catalysts for additional initiatives. Their stability can be instructive to other interested retailers that local economic development can succeed. There are also implications for neighborhood viability in terms of quality of life, since two grocery stores now lie within a 10-minute walk (0.6 miles, or 1,000 meters) for many residences. This improvement in a former food desert can be quantified through GIS analysis and by evaluating any changes in the price and availability of nutritious food. This study makes several important contributions useful to retailers and planners: first, the development of an empirical method for locating food deserts in urban areas; second, the com-
  • 53. parison of the cost of groceries via nutritious food basket pricing throughout the Flint metropolitan Community Development and the Influence of New Food Retail Sources | 475 Grocery Stores Residences City of Flint Locations of grocery stores and occupied residential address points in Flint, Michigan, 2011 area; and third, the before-and-after comparison of the cost of groceries in the former food desert. The results of this pre/post-evaluation will help determine the geographic and economic impact of the new stores. In turn, this provides evidence for planners, policymakers, and investors in- terested in pursuing community and economic development partnerships of this nature in other communities. 476 I JOURNAL OF URBAN AFFAIRS | Vol. 35/No. 4/2013 iVIETHODS The primary objective of this study is to demonstrate the effect of two new grocery stores on the price and availability of nutritious foods in a former food
  • 54. desert. Implications of these benefits on community development are drawn throughout. To study food deserts, however, it is important to have an empirical method for locating them. The methods suggest an innovative approach for using geographic information systems to locate food deserts, and employ an established method for determining the price of nutritious foods. Determining Food Deserts Several criteria must be met to substantiate the existence of a food desert. First, residents must have poor geographic access to grocery stores or other nutritious food sources. The presence of alternative food retailers may provide some nutritious foods but, in general, the price will be considerably higher (Eisenhauer, 2001) and availability will be lower than at grocery stores (Chung and Myers, 1999). Occupied residential address points for the City of Flint were used as the geographic unit of analysis, since all trips originate from the home. Address points were then classified based on whether city residents were within a 1,000 m network distance (along the street network) to the nearest full-service grocery store (both within and outside the city of Flint). This distance is a common threshold to determine neighborhood walkability, a concept that encompasses the greatest distance someone would walk to reach a local amenity (Apparicio, Cloutier, & Shearmur, 2007; Larsen and Gilliland, 2008; Smoyer-Tomic, Spence, & Amrhein 2006). Stores outside the city limit boundary were included in the analysis, to account for an error in spatial analysis known as the boundary or edge effect
  • 55. (Gatrell & Löytönen, 1998; Sadler, Gilliland, & Arku 2011) and since many residents are likely to shop at these stores (Figure 1). The percentage of address points with access to a grocery store was calculated for each census block group (CBG). These CBGs were then categorized into four groups by the percentage of parcels with access to a grocery store, CBGs where 0%-l% of parcels had access met the first criterion for defining food deserts, since few people could walk to a grocery store. The second requirement for determining food deserts is neighborhood socioeconomic distress. The price or availability of groceries has little influence on residents in affluent neighborhoods, since these households simply drive to the desired store. To resolve this, neighborhoods were characterized by socioeconomic status using U.S. Census Bureau data for census block groups (2000a). CBGs were used as the unit of aggregation since they represent the smallest geographic unit for which sociodemographic variables are available. It is important to consider the smallest possible unit of analysis when dealing with aggregated data, since higher levels of aggregation are more likely to misrepresent some neighborhoods, due to higher variability of populations in larger agglomerafions (Gatrell & Löytönen, 1998). Four socioeconomic variables were considered in building a socioeconomic distress index, fol- lowing methods outlined in past research (Gilliland and Ross, 2005; Pampalon, Hamel, Gamache, & Raymond, 2010). These variables include low educational attainment, incidence of low income,
  • 56. lone parenthood, and unemployment. Each variable was included for its impact individually, and for the minimal collinearity seen when variables were grouped. Standardized z-scores were ob- tained for each variable, and these were summed to obtain a composite socioeconomic distress score for census block groups within the urbanized region. These CBGs were then classified into five groups by natural breaks, and the two highest quintiles were isolated to obtain those CBGs most likely at a disadvantage due to socioeconomic distress. While the focus of this study is on the city of Hint, this distress index was calculated for a geographic unit more appropriate to the study of urban areas: the urbanized area of the Flint 1 Community Deveiopment and the influence of New Food Retail Sources | 477 metropolitan area as defined by the U.S. Census Bureau (2000b). Thus, the values for the distress index are eontingent on all CBGs within the urbanized area of Flint. This area includes many suburban municipalities in Genesee County. Because urbanized areas are defined independently from census agglomerations, the urbanized area for Flint did not match neatly with census block group boundaries. To determine urban census block groups, the urbanized area was buffered at 1,000 meters. Census block groups completely contained by that buffer were included as urban. All other CBGs were considered non-urban and
  • 57. excluded from analysis. This technique included CBGs that lay mostly within the urbanized area rather than only including CBGs within the city limits of Flint. Distress scores thus represent the relative disadvantage based on the entire urbanized area of Flint and transcend municipal boundaries (which in Michigan rarely coincide neatly with urban areas). Figure 2 displays the distress levels for much of the urbanized area. Finally, since grocery stores generally require a large population to support large economies of scale, only census block groups with a density of 1,000 people per square mile were considered in the analysis. This threshold is used by the U.S. Census Bureau to define urbanized areas (2000b). While areas with lower densities may exhibit the first two characteristics of a food desert, it is practical to consider the densest areas first, since retail-led interventions are possible here. In urban regions, CBGs and census tracts with low densities are frequently industrial parks. For the study area, one CBG in a vacant industrial zone was excluded due to the absence of a population. In this way, spatial analysis privileges populated neighborhoods. Nutritious Food Basket Survey The Ontario Nutritious Food Basket (ONFB) survey (found in the appendix) was used to determine variations in the cheapest available price of groceries at various grocers in the Flint metropolitan area. This list has been utilized in recent and geographically proximate research (Larsen and Gilliland, 2009; Nathoo and Shoveller, 2003), and
  • 58. is a well-respected and systematic tool created by Health Canada to measure the price of groceries contributing to a nutritious diet (including 66 items representing every food group) (Health Canada, 1998). The potential to compare these results with past results in Canada presents future opportunities for cross-border comparison, as Jacobs (2009) did with economic development policies. Phase one of the survey was conducted in spring 2009. Food baskets were priced at 15 grocery stores around the city and county purposefully selected to represent a cross-section of grocery store types. Because prices within food retail chains were remarkably consistent for all the stores visited (between 2% and 4% within chains), the average food basket value for that chain was applied to other stores that were not visited. This resulted in food basket prices for 38 of 51 grocery stores in the county. Additionally, a food basket was priced in the food desert downtown (in anticipation of the opening of the new grocery stores) by visiting convenience stores and the city farmers' market to ensure all items were found, since no single downtown establishment had all 66 items. Phase two was conducted in spring 2010, immediately after the opening of Witherbee's Market and Mr. B's Foodland in the food desert. For this phase, the same 15 stores were visited, as well as Witherbee's and Mr. B's. Mr. B's is a part of a two-store chain, so pricing was also conducted at the other Mr. B's location. By extrapolating basket prices to other stores as before, this resulted in food basket prices for 41 of 53 grocery stores.
  • 59. Phase three was conducted in spring 2011 to determine how increases in food prices might affect grocery stores. A suburban store (half of a two-store chain) visited previously burned down between the 2010 and 2011 food basket pricing events. In place of these prices, two independent grocery stores were added to the database, one each in suburban and urban neighborhoods. 478 I JOURNAL OF URBAN AFFAIRS I Vol. 35/No. 4/2013 Neighborhood Socioeconomic Distress Level 0 0.5 1 2 1 1 I I I Kilometers • Grocery Stores FIGURE 2 Census bloci< groups within Flint urbanized area by socioeconomic distress level I Community Development and the Influence ot New Food Retail Sources | 479 In total, prices were collected for 44 of 52 stores in the county, including 12 of the 13 grocery stores within the Flint city limits.
  • 60. Price of Groceries and Neighborhood Distress Since food is not a comparison shopping good for all consumers, many shop close to home (Jones and Simmons, 1990). Thus, the neighborhood around a grocery store likely embodies the average store patron. Using existing socioeconomic distress data (including variables on low educational attainment, incidence of low income, lone parenthood, and unemployment) and nutritious food basket prices for a majority of the grocery stores in the county, it is possible to examine correlations between the cost of groceries at neighborhood grocery stores and the neighborhood socioeconomic distress score. One-thousand- meter buffers were created around each grocery store for which food basket pricing was available. CBGs with a majority of their area within the store buffer were grouped, and the average distress score from these CBGs was applied to the store. RESULTS Food Deserts in Fiint Figures 3 and 4 show high-distress CBGs categorized by the percent of residents with access to a grocery store in 2009 and 2010, respectively (before and after the opening of two new grocery stores). As anticipated, Flint's downtown was classified as a food desert due to the absence of a grocery store in 2009. Figure 3 illustrates that 24 CBGs in or immediately adjacent to downtown met the three criteria for a food desert: poor
  • 61. geographical access to nutritious food, high socioeconomic distress, and high, urban density. Additional food deserts include distressed areas near Bassett Park in the west. Hasselbring Park in the northwest, St. John Industrial Park in the north. Carpenter Road Elementary and the Kearsley Reservoir in the northeast, and Evergreen Regency and Howard Estates in the southeast. The opening of Witherbee's downtown and Mr. B's just south of downtown wholly or partly ameliorated spatial food deserts in 8 CBGs, as shown in Figures 3 and 4. Initially, only 28% of residential addresses in the city were within 1,000 meters of a grocery store. This number increased to 31%, or an additional 1,300 homes, after the opening of Witherbee's and Mr. B's. In addition, 13% of all residential addresses in the city experienced an improvement in individual accessibility, based on network analysis of address points to the nearest grocery store. The added presence of two grocery stores near downtown lessened the burden of travelling unwalkable distances to reach nutritious food retailers. Figure 5 indicates the average distance to a grocery store by socioeconomic distress level. Before the opening of the new stores, highly distressed neighborhoods were somewhat closer to a grocery store than less distressed neighborhoods. Since only 28% of residences in the city were initially within 1,000 meters of a grocery store, however, food deserts existed in many neighborhoods (i.e., downtown). For residents with constrained mobility, distance is a considerable obstacle to accessing food. With the addition of
  • 62. the new stores, these distances were substantially reduced, improving accessibility in much of the former food desert downtown. Although food deserts still exist, some poorer neighborhoods have better access to grocery stores. The spatial analysis shows areas of geographic disadvantage but does not suggest whether the addition of these grocery stores solved the economic issue by lowering the price of nutritious foods—a topic addressed in the next section. 480 I JOURNAL OF URBAN AFFAIRS I Vol. 35/No. 4/2013 Witherbees A Market k « Percent within : Waii<ing Distance (1000 m) 0 - 1 % 2 - 25% 26 - 75% 76-100% # Grocery Stores High-distress CBGs by percent within walking distance to a grocery store, Fiint, Ml, pre-intervention (2009)
  • 63. Community Development and the Influence of New Food Retail Sources | 481 Percent within Walking Distance T (1000 m) 0 - 1% 2 - 25% 26 - 75% 76-100% • Grocery Stores High-distress CBGs by percent within waiking distance to a grocery store, Flint, Ml, post-intervention (2011) 482 I JOURNAL OF URBAN AFFAIRS 1 Voi. 35/No. 4/2013 il 2009 - Pre-lntervention "2011-Post-Intervention Low Medium High FIGURE 5
  • 64. Average distance (meters) to grocery stores by socioeconomic distress levei, pre- and post- intervention (2009 and 2011) TABLE 1 Cost of groceries by access to pubiic transit, by type of store, and by grocery stores vs. food desert, 2009-2011 Access to Public Transit at Store? Yes No Type of grocery store National Local Independent Food desert Overall average vs. cost in (Former) food desert Grocery stores Food desert 2009 $128.24 $125.64 2009 $114.45 $130.20
  • 66. 2011 $135.18 $156.75 Bold indicates that the cost decreased the most (or saw the smallest increase) among values in its group for the corresponding year. Food Basket Results Results of food basket surveys in 2009 and 2010 (adjusted for inflation) are shown alongside 2011 results in Table 1 and Figure 6. Table 1 demonstrates no statistical difference in price due to the presence or absence of public transit lines. But there are significant differences based on the type of store and on the price of groceries in the food desert (in 2009) versus the average at other grocery stores. There is no significant difference in the price of groceries by neighborhood socioeconomic distress. Figure 6 shows a scatter-plot of food basket prices at individual stores by socioeconomic distress. The R-squared values for 2009 to 2011 are 0.063, 0.085, and 0.005, respectively, sug- gesting no systematic relationship between high distress and high prices for groceries. The only outlier in Figure 6 represents the price of the basket in the food desert neighborhood in 2009.
  • 67. Community Development and the Influence of New Food Retail Sources | 483 2009 Low Medium High FIGURE 6 Cost of groceries at grocery stores by neighborhood distress score, 2009-2011 In 2009, the cost of a nutritious basket of food in the food desert was $182.95 (in 2011 dollars). In 2010, the cost at Mr. B's was $133.66 while the cost at Witherbee's was $151.48. This pattern held for pricing conducted in 2011, with prices of $144.37 at Mr. B's and $169.12 at Witherbee's. ?-Tests were run on the public transit section of Table 1, and one-way ANOVA tests were run on the remaining values. Results from the r-tests indicate no statistical significance in the price differences between stores on public transit lines and those not on transit lines. Tukey's tests were run as a post hoc evaluation of the ANOVA analyses for the cost of groceries by the type of store and in the food desert versus grocery stores. 484 I JOURNAL OF URBAN AFFAIRS | Vol. 35/No. 4/2013 Results of Tukey's tests revealed that in 2009 prices at national chains were significantly lower than at other stores, while local chains and independent grocers
  • 68. had significantly similar prices. The food desert was significantly more expensive than all types of grocery stores. In 2010, after the opening of the new stores, the price of groceries at independent grocers and the new stores in the former food desert were statistically similar. Prices at national chains were still significantly cheaper than prices at local chains, and local chains were cheaper than independents. In 2011, prices at local chains and independent grocers were once again statistically similar, and prices at independent grocers and the stores in the former food desert were also statistically similar. Inequalities in the price or availability of nutritious food are thus contingent on the store type, not on neighborhood socioeconomic status. As noted, there is a significant difference between the price of groceries at grocery stores versus the price of groceries in the food desert in 2009 (bottom of Table 1). Food desert residents shopping within the neighborhood in 2009 would have paid a 46% premium to procure a nutrifious basket of food. The cost of groceries in the former food desert is now statistically similar to the cost at other independent grocers. This is important for two reasons. First, research has shown that most people (regardless of mobility status) shop within two miles, or about 3,200 meters, of their homes (Eisenhauer, 2001). Since there were initially no grocery stores within two miles (or 3,200 meters) of the center of the neighborhood, if actual shopping patterns were similar to this research, residents would have been forced to shop at stores that were not full-service grocers. Second, a recent report conducted on downtown Flint indicated
  • 69. that 30% of residents in this neighborhood did not have a car available at their household (ESRI, 2007). This suggests that many residents either walk or take public transit to shop. It is likely, then, that many people were paying a premium in price due to constraints on time, mobility, or resources. The bottom of Table 1 illustrates the decline in the price of nutritious foods seen by the opening of Witherbee's Market and Mr. B's Foodland in the former food desert. The combined effect of the new stores translates into only a 5% premium over the average cost at other grocery stores around the county in 2011. Thus, while residents are still paying slightly more for groceries, they are paying considerably less than they were before the stores opened. This refiects a recent similar finding where the opening of a farmers' market in a food desert considerably reduced the price of groceries (Larsen and Gilhland, 2009). DISCUSSION The opening of two new grocery stores in and near a food desert has infiuenced the price and availability of nutritious foods. The number of residents impacted by the addition of the new stores understates its potential effect for two reasons. First, many changes have occurred downtown in recent years, including new housing developments that have brought new permanent residents to the neighborhood. Second, approximately 1,000 students have moved into the neighborhood in the last three years as a result of the growth of the local university (Flint Journal, 2009).
  • 70. Because many of these students are itinerant year-to-year (and therefore possibly not included in the census count for downtown) future census counts may not adequately reflect the population in this neighborhood. If the stores had not opened, the issues with this food desert may have been exacerbated as new residents and students moved in only to find inadequate sources of nutritious food. Evidence from a survey conducted prior to the opening of the new stores suggests that living in a food desert can have detrimental effects. The survey found that 21% of residents in the city have at least some degree of difficulty accessing a "grocery store or supermarket that has a good variety of fresh fruits and vegetables" (n — 730) (Prevention Research Center of Michigan, 2009). This suggests that, among those outside of walking distance to a grocery store, accessing I Community Development and the Influence of New Food Retail Sources I 485 nutritious foods can be particularly problematic. The same survey indicated that only 25% of city residents consume at least 5 servings of fruits and vegetables per day (« = 687) (Prevention Research Center of Michigan, 2009). Because there is a positive relationship between proximity to grocery stores and dietary quality, the addition of these new stores may make healthy eating easier for those interested in improving their health status.
  • 71. The addition of the grocery stores in and near the food desert improved food access in both geographic and economic dimensions. Geographic access has been improved because residents can now access a grocery store downtown. Residents previously shopping in the neighborhood were relegated to a handful of convenience stores or the farmers' market. Due to the addition of these two stores, an increase of 3% of the entire city population can now walk to a grocery store. Economic access was also improved by the new stores. For residents originally shopping for groceries entirely within the neighborhood, a considerable premium would have been paid, as this and past research has shown (Drewnowski et al., 2004; Furey et al., 2001; Larsen and Gilliland, 2009). Those shopping outside the neighborhood would have expended additional resources on travel to reach more distant grocery stores. A resident shopping by the nutritious food basket guidelines every two weeks would save approximately $800 at Witherbee's or $1250 at Mr. B's over the course of a year. In Flint, this equates with between 2 and 3 months' rent in a 1-bedroom apartment (Apartment Ratings, 2011). For a low-income family, this cost-savings would result in a considerable change in quality of life. The farmers' market in itself offers a microcosm of the issue of accessing nutritious food downtown prior to the opening of the grocery stores. It is competitive for some types of fresh produce, but does not offer many staple foods like cereal, and many other products like meats and cheeses are only available with higher mark-ups. Additionally, the farmers' market is only open
  • 72. three days a week, reflecting a common concern that residents were required to "plan ahead" if intending to shop there. Finally, it is also distant from the center of the neighborhood, and is less accessible by bus than Witherbee's or Mr. B's. Thus, while the market serves a vital role in the neighborhood, the contribution of the new grocery stores is significant both geographically and economically. Still, there are important pieces of evidence that this research does not answer. Cummins, Findlay, Petticrew, and Sparks, (2008) indicate that, even when presented with a new food source, many people do not deviate from their old habits. Because no customer surveys were taken, the present research is unable to state whether people shop at these new stores. Further, even assuming that residents switched stores, this research cannot determine whether dietary habits are improving as a result. Additionally, cultural and social factors may have a stronger influence on what people will choose to purchase even when given so- called healthier choices (Cummins, Curtis, Diez-Roux, & Macintyre, 2007), and environmental cues can cause people to make sub-optimal choices even when intending to act in their self- interest (Just and Payne, 2009). Policy Implications The success of these stores is compelling for policymakers. Initially, the development of With- erbee's was a grassroots movement by community members interested in a full-service grocery store for their neighborhood. Using local community groups like
  • 73. the Neighborhood Improvement and Preservation Project and the Local Initiatives Support Corporation to lobby funding from higher-level organizations, sponsors from the State of Michigan, the U.S. Department of Hous- ing and Urban Development, and local community foundations soon joined to provide financial support. The project became a statewide model to support efforts to bring small grocery stores to other under-serviced urban neighborhoods (LISC-Flint, 2008). 486 I JOURNAL OF URBAN AFFAIRS I Vol. 35/No. 4/2013 This model has been successful in part because of efforts by the Downtown Development Authority of the City of Flint to increase security in the downtown core to entice area residents to frequent the new developments. This strategy echoes Bowes (2007), who indicated that "public policy strategies meant to encourage retail development in a particular part of the city such as downtown need to include efforts to reduce crime" (p. 88). The small scale of the grocery stores means a smaller percentage of the market is needed to remain profitable. The cost-savings to consumers provided in the results section are in line with the grocer margins projected by Witherbee's financial backers (27-29%), whose plan was to remain competitive with large-scale grocery retailers (20-24% margin) while staying far below the margins expected for convenience stores (40%) (LISC-Flint, 2008). A market analysis of the community prior to the opening of Witherbee's indicated a 60%
  • 74. leakage rate for money spent outside the neighborhood, suggesting a large untapped demand for goods (see also Carr, 1999; Porter, 1995). The report indicates that the market would need to re-capture 4.3% of the leakage rate to remain profitable (LISC-Flint, 2008). If Witherbee's captures this part of the market demand, it could serve as a model for future public/private partnerships to develop grocery stores in other disadvantaged neighborhoods in this region and elsewhere. Because Witherbee's resulted from a grassroots movement, it is instructive for plan- ners/policymakers and conventional retailers. The attention given to Witherbee's by local investors likely contributed to its opening, since close attention was given to the needs of the neighbor- hood and neighborhood-based leadership was present throughout. Both of these elements are suggested as necessary components in local economic development (Carley, Kirk, & Mclntosh, 2001). The organization that aided Witherbee's (LISC) was also the catalyst for a grocery store in Harlem (Lavin, 2000). Since not all revitaiization comes from grassroots movements, however, it is important to engage the public and private sectors in planning for new development. The new grocery stores in Flint demonstrate the policy implication that "public officials cannot rely on regional growth to solve the problems of poor neighborhoods" (Blair and Carroll, 2007, p. 274). Indeed, both stores owe their existence to the local-level investors who observed a need for retail within their neighborhood.
  • 75. Attracting grocery stores and other retail to urban centers can be difficult where site availability, human resources, or aid programs for new retail are unavailable or sparse (Nayga and Weinburg, 1999; Pothukuchi, 2005), and many governments and would-be investors can be shy of taking the risk. This aversion is a potential reason for metropolitan disparities seen in urban neighborhoods (Blair and Carroll, 2007). Yet, there is clearly potential for retail to locate in urban centers. A government-sponsored initiative in the U.K. recently spurred the development of a supermarket within a designated regeneration area (Mitchell and Kirkup, 2003). By incentivizing development in this disadvantaged neighborhood, the government was able to match retailers with suitable areas to develop stores that would be both profitable from a business standpoint and restorative from a local community development standpoint. This appears to be the case in Flint with the opening of Witherbee's, and additional retail initiatives have flourished in the neighborhood. Witherbee's may serve as a catalyst for multiplier effects on local economic development. This community-centered strategy is in contrast to the large- scale, tourist-oriented economic development strategies of the 1970s and 1980s. These past projects often did not deliver on their promises of jobs (Krumholz, 1991), and frequently failed due to their reliance on outside populations to sustain their high operating costs. Investment in retail may not be a catch-all solution for improving health status (Cummins et al., 2008; Cummins & Macintyre, 2002), but the addition of new
  • 76. food retail does lessen the social inequalities created when these areas were initially abandoned by grocery stores (Carley et al., 2001; Dunkley, Helling, & Sawicki, 2004; Williams and Hubbard, 2001). As mentioned earlier, various tax and zoning incentives were given by the City of Flint to the operators of Witherbee's I Community Development and the Influence of New Food Retaii Sources 1 487 (City of Flint, 2010), suggesting that municipal governments are beginning to play a larger role in healthy eating. Elsewhere, other initiatives like the FRESH Food Store Program also facilitate the development of nutritious food sellers in distressed communities by providing tax and zoning incentives to qualified retailers in New York (Food Retail Expansion to Support Health, 2011). Although this paper necessarily cannot consider all prospects for food as local economic development, formal-sector interventions like those seen in this paper will not necessarily occur in all neighborhoods where there is a need. Therefore, it is useful to briefly consider that where investment in retail is not possible or desired, there exist many movements which emphasize local food networks as a form of economic development. The national Growing Power movement is one of many organizations that provide training and support for prospective growers (Growing Power, 2011). Beyond this, the Growing Home movement in Chicago combines job training and organic
  • 77. agriculture to provide employment opportunities for troubled residents (Growing Home, 2011). Given that food is an essential building block of life and many opportunities for growth exist within food systems (including locally), these programs may offer promise as community and economic development strategies, especially in neighborhoods where conventional food retailers are unlikely to invest. CONCLUSIONS The contributions of this research will benefit researchers, planners, and investors. An empirical mixed-methods approach was employed to locate food deserts in urban areas. GIS was used to map food retailers and census data to determine potential food deserts, while food basket pricing was conducted to examine variations in the price and availability of nutritious foods. The GIS approach can be used in other urban settings to locate potential food deserts, giving other communities evidence for creating policies to support community development in disadvantaged neighborhoods through food retail. This research pinpointed potential food desert neighborhoods in Flint, Michigan. Because the city exemplifies the problems of many post-industrial shrinking cities of North America and Western Europe, the methods employed in this research can be replicated elsewhere. Food basket pricing before and after the opening of two new grocery stores showed that much of downtown Flint is no longer a food desert. This approach included the extrapolation of pricing to all grocery