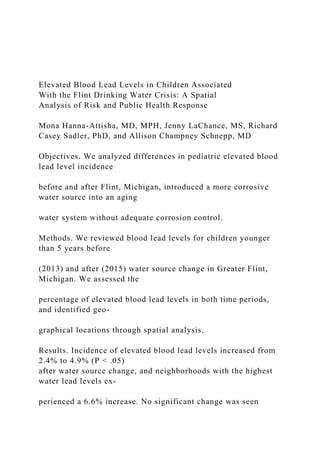
The percentage of children in Flint, Michigan with elevated blood lead levels increased after the city changed its water source in 2014. Before the change, 2.4% of Flint children under 5 had elevated blood lead levels, but after the change this increased to 4.9%, a statistically significant increase. The neighborhoods with the highest water lead levels experienced the largest increases, with elevated blood lead levels rising from 4.0% to 10.6%. Spatial analysis identified disadvantaged neighborhoods as having the greatest increases in elevated blood lead levels, informing the public health response.
Story OutlineExposition when we learn important background info.docxrjoseph5
Story Outline
Exposition: when we learn important background information about the protagonist (the main character) and their “normal” life. (You’re “exposing” the reader to the back story.)
Characters: the characters involved in the story include the media, the public (the people living in the Flint in Genesee, Michigan), and authorities (the United States Environmental Protection Agency).
Setting: the flint water crisis hit the city of Flint in Genesee, Michigan and started in April 2014. This is after the authorities decided to change the supply of drinking water from Detroit system to Flint system in an effort to save on costs.
Basic Situation: the water crisis at flint resulted from poor assessment and decision making by the local water authorities. The water was inadequately treated and tested, leading to numerous health issues because of its poor quality and contamination.
Conflict: the conflict started when the authorities shifted the source of water supply to the city, thus exposing thousands of residents to lead poisoning from the discolored, foul-smelling, and off-tasting water that caused hair loss, skin rashes, and itchy skin to its users for several months. Despite numerous reports and coverage by news agencies such as the Detroit Free Press, MLive, and independent reporters, authorities largely ignored the public outcry.
Rising Action: sequence of events that happen because of the conflict. They usually get more intense over time.
• People started complaining that the water smells like rotten eggs, is brown, and tastes funny.
• people started noticing the effects of consuming the poisoned water. Some of the effects included hair loss, skin rashes, and itchy skin to its users for several months.
• the editorial board of the Detroit Free Press ran a report on October 8, 2015 showing how the government had failed to curb the water crisis
• Several other media houses run stories showing the failure by government to address the issue
• the authorities deny claims that the water is contaminated and assures the public that it is safe for consumption.
Climax: a pediatrician releases a frightening report regarding the impact of the contaminated water on children. This is after carrying out some blood tests on the community’s children.
Falling Action: the events after the climax (usually quicker than the rising action).
• The governor of Michigan calls for a crisis meeting.
• Authorities start brainstorming for ideas on what should be done to solve the problem and save the situation.
• The government, with the help of other organizations, starts distributing bottled water that is safe for drinking and supplies lead filters across the country.
Resolution: the governor of Michigan requests legislators to allocate the state funds which will be used to change the city’s water supply back to Lake Huron just like it was the case before the crisis set in.
Title: Flint Water Crisis and Water Safety Regulation
Characters
Char.
An Assessment on Drinking Water Quality and Management in Kakamega Municipalitypaperpublications3
Abstract: Drinking water must be free from components which may adversely affect the human health. Such components include minerals, organic substances and disease causing microorganisms. A large portion of the population in urban areas in developing countries suffers from health problems associated with either lack of drinking water or due to the presence of microbiological contamination in water. This research was conducted in Kakamega municipality with a broad objective to conduct assessment of water quality and management in Kakamega municipality. The Specific objective was to determine the chemical water quality parameters in water and to evaluate the management practices on water in Kakamega municipality. Four water quality parameters; two physical and two chemical were tested from the samples collected for this research work. Sampling technique was purposive where water samples from water sources and distribution points in densely populated areas of Kakamega municipality were taken. Data collection instruments that were used included sterilized bottles to collect water, delivery to the laboratory within six (6) hours of collection for reliable results and data quality control was achieved through immediate entry in the pre-designed data form. According to the results pH values at all the sources and house connections are well within the WHO desirable limit of 6.50-8.0. The sample from Sichirai had a pH of 7.8 that was the highest as compared to an Isiukhu river that had 6.6 pH. The samples from Isiukhu river, Savona Island River, fishpond at bridge and Shikhambi spring showed more than 5 NTU. The researchers recommended for water surveillance in Kakamega municipality in order to ensure consumers have safe water free from agricultural and industrial chemical pollution.
Water is a necessary element for sustainable development.
It serves a crucial link between the environment and society and the heart the heart of adaptation to climate change.
Water is critical for human survival, healthy ecosystem, food production, energy production, and socio-economic development. Increasing population, limited water resources, and our dependence on water has given rise to global water quality challenges.
Epidemiological data and operational information about outbreaks is.pdfakashapparels
Epidemiological data and operational information about outbreaks is dynamic and changes
rapidly. You must develop a comprehensive Event Management System to manage critical
information about an outbreak (of your choice) within the Excel program that you have just
learned. This is one method to ensure accurate and timely communications between key public
health professionals and the community.
Choose from any one of the fields below.
Features of the data management system you create should include:
Solution
Case Management-
Businesses and agencies in long-term relationships with their customers, citizens or subscribers
will be judged by the accuracy of the records they hold, the consistency of the communications
that take place, and the speed, efficiency and fairness with which each case, claim or contract is
processed.
Delivery of customer service against these priorities has never been more challenging.
Customers are more mobile in their addresses, jobs and family relationships. Communications
channels seem to multiply overnight, with customers switching between them at will. Corporate
messaging demands multi-channel distribution with increasing amounts of personalization.
Mergers and acquisitions create multiple silos of customer-related data to be seamlessly joined.
And products, business rules and government regulations change with alarming frequency.
Against this backdrop, the demands on the IT systems to support smooth, efficient and integrated
delivery are considerable, particularly where case-orientated transactions are involved.
Emergency Response-
Environmental emergencies are incidents or events that threaten public safety, health, and
welfare and include hurricanes, floods, wildfires, industrial plant explosions, chemical spills, acts
of terrorism, and others. While these events range in size, location, cause, and effect, most have
an environmental component. Emergency response is the organizing, coordinating, and directing
of available resources in order to respond to the event and bring the emergency under control.
The goal of this coordinated response is to protect public health by minimizing the impact of the
event on the community and the environment.
An emergency response plan must provide the resources and information needed to evaluate the
human and environmental health impacts of the event, assess and reduce human exposures to
contaminants, and develop science-based strategies for remediation and rebuilding. One example
is the immediate response of NIEHS and other government agencies to the devastation and
hardship caused by Hurricane Katrina. This included the establishment of a field hospital in
Mississippi to meet the immediate health needs of the hurricane victims, as well as the
development of a Geographic Information System to plot the locations of chemical plants,
refineries, Superfund clean-up sites, and other potential hot spots of contamination where
flooding occurred.
Safe Drinking Water-
There are many types o.
Two of the charter members of The Long Island Clean Water Partnership, The Citizen's Campaign For The Environment, and The Group For The East End, offer this overview of the state of Long Island's waters -- what is polluting them and what we can do about it. The CCE's Adrienne Esposito and the GFTEE by Bob DeLuca.
Long Island gets its drinking water from the ground. Whatever we do on the surface eventually makes it into the aquifer, and into our drinking water, our rivers and bays.
The largest issue is nitrates from septic tanks, from the 200+ small sewage treatment plants, and from fertilizer, both residential and commercial leaching into the ground water, and then to our bays, where they trigger massive algal blooms -- brown tide, red tide, rust tide, blue green algae. These blooms have already destroyed much of our bay's habitats, resulting in a collapse of the shellfish and finfish population. To reverse this situation, we must impose much stricter limits on how much nitrogen can enter into our ground water from the plants, farms, and from the 500,000 septic tanks that dot Long Island.
Another major threat to Long Island water is VOCS (volatile organic chemicals). While there are 254 superfund sites on Long Island, the largest source of these VOCs are household products -- cleaners, paint strippers, aerosols. 100,000 tons of household hazardous waste is disposed of improperly every year in New York.
A further threat is the 117 pesticides now found in our drinking water. Even when banned, they remain in our environment for decades.
Finally, the improper disposal of household pharmaceuticals means that these drugs are entering into our ecosystem, with effects unknown. We must stop flushing or throwing out unused prescriptions, but dispose of them only at designated county locations.
In all, there are a number of things we can do now to help LI become sustainable for future generations: Push for new technologies and new policies that would limit nitrogenous waste from our septic and sewer systems. Stop using high nitrogen lawn and agricultural fertilizers. Dispose of your household waste properly. Any chemical you use at home will end up in the ground water unless disposed of properly. Don't pour oils, grease, and chemicals down the drain. Use green, friendly home cleaning products.
Finally, since the major contributor to Long Island's water problems has been overdevelopment (without the requisite infrastructure to support it), we need to protect what green spaces we have left.
MORE THAN 660 million people lack access to an improved water source and 2.4 billion people lack access to improved sanitation. Growing awareness of the global challenge we face in improving water, sanitation, and hygiene, widely known as WASH, has gained the problem a prominent place on global nutrition and health agendas. And an expanding body of research points to the great potential of WASH, as a set of interventions, to improve nutrition and health. For example, systematic reviews have shown that improving water quality can reduce the risk of diarrhea by 17 percent; and introducing hand hygiene interventions can reduce gastrointestinal by 31 percent and respiratory illness by 21 percent
Fetal Death and Reduced Birth Rates Associated with Exposure to Lead-Contamin...Jim Bloyd, DrPH, MPH
ABSTRACT: This ecologic study notes that fetal death rates (FDR) during the Washington DC drinking water “lead crisis” (2000−2004) peaked in 2001 when water lead levels (WLLs) were highest, and were minimized in 2004 after public health interventions were implemented to protect pregnant women. Changes in the DC FDR vs neighboring Baltimore City were correlated to DC WLL (R2 = 0.72). Birth rates in DC also increased versus Baltimore City and versus the United States in 2004−2006, when consumers were protected from high WLLs. The increased births in DC neighborhoods comparing 2004 versus 2001 was correlated to the incidence of lead pipes (R2 = 0.60). DC birth rates from 1999 to 2007 correlated with proxies for maternal blood lead including the geometric mean blood lead in DC children (R2 = 0.68) and the incidence of lead poisoning in children under age 1.3 years (R2 = 0.64). After public health protections were removed in 2006, DC FDR spiked in 2007−2009 versus 2004−2006 (p < 0.05), in a manner consistent with high WLL health risks to consumers arising from partial lead service line replacements, and DC FDR dropped to historically low levels in 2010−2011 after consumers were protected and the PSLR program was terminated. Re-evaluation of a historic construction-related miscarriage cluster in the USA Today Building (1987− 1988), demonstrates that high WLLs from disturbed plumbing were a possible cause. Overall results are consistent with prior research linking increased lead exposure to higher incidence of miscarriages and fetal death, even at blood lead elevations (≈5 μg/dL) once considered relatively low.
Taps and Toilets: How Greater Access Can Radically Improve Africa’s FutureEric Firnhaber
The International Futures modeling system is used to explore the impact of sanitation and clean water on development in Africa through improvements in access to them. The paper explores a Base Case and alternate scenarios that reflect, respectively, enhanced rates of access and stagnating rates of access. Impacts on development are measured through infant mortality, communicable diseases, GDP, and state fragility. The analysis includes a preliminary cost-benefit analysis.
My first publication at UNICEF sheds light on the impacts of climate change on children's access to safe water and sanitation. If you think about it, it's staggering how more than 7.3 billion people have to compete over the extremely small fraction (definitely less than 1%) of the planet's available water resources -- and it'll only exacerbate as climate change continues. Who will suffer the most? The poorest children in the most vulnerable regions, such as coastal areas or the regions with extreme heat stress. Check out this short brief prepared for #COP22 and stay tuned for the full report by next year's #Worldwaterday! So honored and privileged to work with the amazing colleagues. PROGRAMME DIVISION (WASH SECTION): Jose Gesti Canuto, Cecilia Scharp DIVISION OF COMMUNICATION: Philippa Lysaght DIVISION OF DATA, RESEARCH AND POLICY (PSN SECTION): Yoonie Choi, Christine Klauth, Cornelius Kuteesa, Nicholas Rees, Shangning Wang(graphic design)
High Five program: final report (2011-2014)abby ati
The final report of High Five program, a sanitation and hygiene practices improvement program, implemented in three cities in Indonesia: Medan, Surabaya and Makassar.
Elementary CurriculaBoth articles highlight the fact that middle.docxtoltonkendal
Elementary Curricula
Both articles highlight the fact that middle-class students seem to benefit more from summer reading programs than their lower-SES peers. While we would hope that summer reading programs would have the same positive impact on all students, this information did not totally surprise me. Differences in funding, materials, and ability to recruit enough high-quality teachers for summer programs could be more difficult in lower-socioeconomic areas. In addition, the articles did not dive into other factors in the students’ lives that may be contributing to their performance such as attendance, how well-rested they are, trauma they have experiences that impacts their ability to focus during instruction, and the impact of being taught by a teacher who the students may not know or have a relationship with. Additionally, there could be a mismatch between the instructional practices and the specific needs of the students. Even though summer reading programs are only for a short time, I would challenge teachers to put energy into getting to know the students and building trust with them. This is a key foundation that is needed for learning to take place.
In challenging teachers during summer program and the regular school year to ”break out of the mold” to create better outcomes for students classified with low SES, in addition to building relationships with students, I would encourage them to build connections with their families. This may involve thinking outside the box and leaving their comfort zone. It could entail holding a parent-teacher conference off campus, closer to their home or in their community. It could also include providing resources and instructional videos to parents so they can help support their children at home. There are many parents who want to support their children academically, but they do not know how and may be uncomfortable asking the teacher for assistance. In addition, I would urge teachers to capitalize on the strengths and interests of their students to engage them in learning activities and provide them with opportunities to shine. We do not have to, and should not, be satisfied with the idea that low SES students will automatically not be able to perform. These students are capable of learning and growth just as much as any other student. I think data from test scores that demonstrate a gap between the performance of students classified as economically disadvantaged and not economically disadvantaged has led some people to hold the belief that students classified as low SES will not perform well. I think the way that school “report card” grades are published also perpetuates this belief, as it shows the test scores, but does not provide an explanation of or include any solutions for the many larger societal factors that contribute to those scores including high teacher turn over, lack of resources, child trauma, lack of sleep, lack of nutrition, crime & safety, and education level of parents.
It w.
Elementary Statistics (MATH220)
Assignment:
Statistical Project & Presentation
Purpose:
The purpose of this project is to supplement lecture material by having the students to do a case study on collecting, analyzing, and interpreting data.
***The best way to understand something is to experience it for yourself.
Guideline for Analyzing Data and Writing a Report
Below is a general outline of the topics that should be included in your report.
1.
Introduction.
State the topic of your study.
2.
Define Population.
Define the population that you intend for your study to represent.
3.
Define Variable.
Define clearly the variable that you obtained during your data collection; this should include information on how the variable is measured and what possible values this variable has.
4.
Data Collection.
Describe your data collection process, including your data source, your sampling strategy, and what steps you took to avoid bias.
5.
Study Design.
Describe the procedures you followed to analyze your data.
6.
Results: Descriptive Statistics.
Give the relevant descriptive statistics for the sample you collected.
7.
Results: Statistical Analysis.
Describe the results of your statistical analysis.
8.
Findings.
Interpret the results of your analysis in the context of your original research question. Was your hypothesis supported by your statistical analyses? Explain.
9.
Discussion.
What conclusions, if any, do you believe you can draw as a result of your study? If the results were not what you expected, what factors might explain your results? What did you learn from the project about the population you studied? What did you learn about the research variable? What did you learn about the specific statistical test you conducted?
.
More Related Content
Similar to Elevated Blood Lead Levels in Children AssociatedWith the Fl.docx
Two of the charter members of The Long Island Clean Water Partnership, The Citizen's Campaign For The Environment, and The Group For The East End, offer this overview of the state of Long Island's waters -- what is polluting them and what we can do about it. The CCE's Adrienne Esposito and the GFTEE by Bob DeLuca.
Long Island gets its drinking water from the ground. Whatever we do on the surface eventually makes it into the aquifer, and into our drinking water, our rivers and bays.
The largest issue is nitrates from septic tanks, from the 200+ small sewage treatment plants, and from fertilizer, both residential and commercial leaching into the ground water, and then to our bays, where they trigger massive algal blooms -- brown tide, red tide, rust tide, blue green algae. These blooms have already destroyed much of our bay's habitats, resulting in a collapse of the shellfish and finfish population. To reverse this situation, we must impose much stricter limits on how much nitrogen can enter into our ground water from the plants, farms, and from the 500,000 septic tanks that dot Long Island.
Another major threat to Long Island water is VOCS (volatile organic chemicals). While there are 254 superfund sites on Long Island, the largest source of these VOCs are household products -- cleaners, paint strippers, aerosols. 100,000 tons of household hazardous waste is disposed of improperly every year in New York.
A further threat is the 117 pesticides now found in our drinking water. Even when banned, they remain in our environment for decades.
Finally, the improper disposal of household pharmaceuticals means that these drugs are entering into our ecosystem, with effects unknown. We must stop flushing or throwing out unused prescriptions, but dispose of them only at designated county locations.
In all, there are a number of things we can do now to help LI become sustainable for future generations: Push for new technologies and new policies that would limit nitrogenous waste from our septic and sewer systems. Stop using high nitrogen lawn and agricultural fertilizers. Dispose of your household waste properly. Any chemical you use at home will end up in the ground water unless disposed of properly. Don't pour oils, grease, and chemicals down the drain. Use green, friendly home cleaning products.
Finally, since the major contributor to Long Island's water problems has been overdevelopment (without the requisite infrastructure to support it), we need to protect what green spaces we have left.
MORE THAN 660 million people lack access to an improved water source and 2.4 billion people lack access to improved sanitation. Growing awareness of the global challenge we face in improving water, sanitation, and hygiene, widely known as WASH, has gained the problem a prominent place on global nutrition and health agendas. And an expanding body of research points to the great potential of WASH, as a set of interventions, to improve nutrition and health. For example, systematic reviews have shown that improving water quality can reduce the risk of diarrhea by 17 percent; and introducing hand hygiene interventions can reduce gastrointestinal by 31 percent and respiratory illness by 21 percent
Fetal Death and Reduced Birth Rates Associated with Exposure to Lead-Contamin...Jim Bloyd, DrPH, MPH
ABSTRACT: This ecologic study notes that fetal death rates (FDR) during the Washington DC drinking water “lead crisis” (2000−2004) peaked in 2001 when water lead levels (WLLs) were highest, and were minimized in 2004 after public health interventions were implemented to protect pregnant women. Changes in the DC FDR vs neighboring Baltimore City were correlated to DC WLL (R2 = 0.72). Birth rates in DC also increased versus Baltimore City and versus the United States in 2004−2006, when consumers were protected from high WLLs. The increased births in DC neighborhoods comparing 2004 versus 2001 was correlated to the incidence of lead pipes (R2 = 0.60). DC birth rates from 1999 to 2007 correlated with proxies for maternal blood lead including the geometric mean blood lead in DC children (R2 = 0.68) and the incidence of lead poisoning in children under age 1.3 years (R2 = 0.64). After public health protections were removed in 2006, DC FDR spiked in 2007−2009 versus 2004−2006 (p < 0.05), in a manner consistent with high WLL health risks to consumers arising from partial lead service line replacements, and DC FDR dropped to historically low levels in 2010−2011 after consumers were protected and the PSLR program was terminated. Re-evaluation of a historic construction-related miscarriage cluster in the USA Today Building (1987− 1988), demonstrates that high WLLs from disturbed plumbing were a possible cause. Overall results are consistent with prior research linking increased lead exposure to higher incidence of miscarriages and fetal death, even at blood lead elevations (≈5 μg/dL) once considered relatively low.
Taps and Toilets: How Greater Access Can Radically Improve Africa’s FutureEric Firnhaber
The International Futures modeling system is used to explore the impact of sanitation and clean water on development in Africa through improvements in access to them. The paper explores a Base Case and alternate scenarios that reflect, respectively, enhanced rates of access and stagnating rates of access. Impacts on development are measured through infant mortality, communicable diseases, GDP, and state fragility. The analysis includes a preliminary cost-benefit analysis.
My first publication at UNICEF sheds light on the impacts of climate change on children's access to safe water and sanitation. If you think about it, it's staggering how more than 7.3 billion people have to compete over the extremely small fraction (definitely less than 1%) of the planet's available water resources -- and it'll only exacerbate as climate change continues. Who will suffer the most? The poorest children in the most vulnerable regions, such as coastal areas or the regions with extreme heat stress. Check out this short brief prepared for #COP22 and stay tuned for the full report by next year's #Worldwaterday! So honored and privileged to work with the amazing colleagues. PROGRAMME DIVISION (WASH SECTION): Jose Gesti Canuto, Cecilia Scharp DIVISION OF COMMUNICATION: Philippa Lysaght DIVISION OF DATA, RESEARCH AND POLICY (PSN SECTION): Yoonie Choi, Christine Klauth, Cornelius Kuteesa, Nicholas Rees, Shangning Wang(graphic design)
High Five program: final report (2011-2014)abby ati
The final report of High Five program, a sanitation and hygiene practices improvement program, implemented in three cities in Indonesia: Medan, Surabaya and Makassar.
Elementary CurriculaBoth articles highlight the fact that middle.docxtoltonkendal
Elementary Curricula
Both articles highlight the fact that middle-class students seem to benefit more from summer reading programs than their lower-SES peers. While we would hope that summer reading programs would have the same positive impact on all students, this information did not totally surprise me. Differences in funding, materials, and ability to recruit enough high-quality teachers for summer programs could be more difficult in lower-socioeconomic areas. In addition, the articles did not dive into other factors in the students’ lives that may be contributing to their performance such as attendance, how well-rested they are, trauma they have experiences that impacts their ability to focus during instruction, and the impact of being taught by a teacher who the students may not know or have a relationship with. Additionally, there could be a mismatch between the instructional practices and the specific needs of the students. Even though summer reading programs are only for a short time, I would challenge teachers to put energy into getting to know the students and building trust with them. This is a key foundation that is needed for learning to take place.
In challenging teachers during summer program and the regular school year to ”break out of the mold” to create better outcomes for students classified with low SES, in addition to building relationships with students, I would encourage them to build connections with their families. This may involve thinking outside the box and leaving their comfort zone. It could entail holding a parent-teacher conference off campus, closer to their home or in their community. It could also include providing resources and instructional videos to parents so they can help support their children at home. There are many parents who want to support their children academically, but they do not know how and may be uncomfortable asking the teacher for assistance. In addition, I would urge teachers to capitalize on the strengths and interests of their students to engage them in learning activities and provide them with opportunities to shine. We do not have to, and should not, be satisfied with the idea that low SES students will automatically not be able to perform. These students are capable of learning and growth just as much as any other student. I think data from test scores that demonstrate a gap between the performance of students classified as economically disadvantaged and not economically disadvantaged has led some people to hold the belief that students classified as low SES will not perform well. I think the way that school “report card” grades are published also perpetuates this belief, as it shows the test scores, but does not provide an explanation of or include any solutions for the many larger societal factors that contribute to those scores including high teacher turn over, lack of resources, child trauma, lack of sleep, lack of nutrition, crime & safety, and education level of parents.
It w.
Elementary Statistics (MATH220)
Assignment:
Statistical Project & Presentation
Purpose:
The purpose of this project is to supplement lecture material by having the students to do a case study on collecting, analyzing, and interpreting data.
***The best way to understand something is to experience it for yourself.
Guideline for Analyzing Data and Writing a Report
Below is a general outline of the topics that should be included in your report.
1.
Introduction.
State the topic of your study.
2.
Define Population.
Define the population that you intend for your study to represent.
3.
Define Variable.
Define clearly the variable that you obtained during your data collection; this should include information on how the variable is measured and what possible values this variable has.
4.
Data Collection.
Describe your data collection process, including your data source, your sampling strategy, and what steps you took to avoid bias.
5.
Study Design.
Describe the procedures you followed to analyze your data.
6.
Results: Descriptive Statistics.
Give the relevant descriptive statistics for the sample you collected.
7.
Results: Statistical Analysis.
Describe the results of your statistical analysis.
8.
Findings.
Interpret the results of your analysis in the context of your original research question. Was your hypothesis supported by your statistical analyses? Explain.
9.
Discussion.
What conclusions, if any, do you believe you can draw as a result of your study? If the results were not what you expected, what factors might explain your results? What did you learn from the project about the population you studied? What did you learn about the research variable? What did you learn about the specific statistical test you conducted?
.
Elements of Religious Traditions PaperWritea 700- to 1,050-word .docxtoltonkendal
Elements of Religious Traditions Paper
Write
a 700- to 1,050-word paper that does the following:
Describes these basic components of religious traditions and their relationship to the sacred
:
What a religious tradition says—its teachings, texts, doctrine, stories, myths, and others
What a religious tradition does—worship, prayer, pilgrimage, ritual, and so forth
How a religious tradition organizes—leadership, relationships among members, and so forth
Identifies key critical issues in the study of religion.
Includes specific examples from the various religious traditions described in the Week One readings that honor the sacred—such as rituals of the Igbo to mark life events, the vision quest as a common ritual in many Native American societies, or the influence of the shaman as a leader. You may also include examples from your own religious tradition or another religious tradition with which you are familiar.
Format
your paper consistent with APA guidelines
.
Elements of MusicPitch- relative highness or lowness that we .docxtoltonkendal
Elements of Music
Pitch- relative highness or lowness that we hear in a sound.
Tone- sound that has a definite pitch.
(For example striking a bat against a ball does not produce a D# but striking a D#
on a piano does)
Dynamics- the degree of loudness or softness in music
pp pianissimo /very soft
p piano /soft
mp mezzo-piano /medium-soft
mf mezzo-forte /medium-loud
f forte /loud
ff fortissimo /very loud
When dynamics are altered in a piece of music, they are termed as follows:
decrescendo/ diminuendo gradually softer
crescendo gradually louder
Timbre/Tone Color- the character or quality of a sound.
dark, bright, mellow, cool, metallic, rich, brilliant, thin, etc.
Rhythm- a) the flow (or pattern) of music through time. b) the particular arrangement of
note lengths in a piece of music.
Syncopation- An accent placed on a beat where it is not normally expected.
Beat- the steady pulse in a piece of music.
Downbeat- the first or stressed beat of a measure.
Meter- the pattern in which beats are organized within a piece of music.
Examples:
3/4= three beats per measure
4/4= four beats per measure
6/8= six beats per measure
*In some musics, meter is not present- this is termed non-metric.
(Ex: Chant, some 20th century genres, world musics).
Melody- a series of single notes that add up to a recognizable whole.
*A melodic line has a shape -it ascends and descends in a series of continuous pitches.
Sequence- a repetition of a pattern at a higher or lower pitch.
Phrase- A short unit of music within a melodic line.
Cadence- The rest at the end of a musical phrase. Think of this as a musical period at the
end of a sentence.
Harmony- A) How chords are constructed and how they follow each other. B) The
relationship of tones when sounded in a group.
Chord- a combination of three or more tones sounded at once.
Consonance- a stable tone combination in a chord
Dissonance- and unstable tone combination in a chord; usually, an expected
and stable resolution will follow.
Tonic- a) the main key of a piece of music. b) the first note of a scale
Key- the central tone or scale in a piece of music.
(example: A major, b minor)
Modulation- a shift from one key to another within the same piece of music.
Texture- layering of musical sounds or instruments within a piece of music.
Monophonic- single, unaccompanied melodic line.
Homophonic- a melody with an accompaniment of chords.
Polyphonic- th.
Elements of the Communication ProcessIn Chapter One, we learne.docxtoltonkendal
Elements of the Communication Process
In Chapter One, we learned communication is the process of creating or sharing meaning in informal conversation, group interaction, or public speaking. To understand how the process works, we described the essential elements in the process.
For the following interaction, identify the contexts, participants, channels. message, interference (noise), and feedback.
"Maria and Damien are meandering through the park, talking and drinking bottled water. Damien finishes his bottle, replaces the lid, and tosses the bottle into the bushes at the side of the path. Maria, who has been listening to Damien talk, comes to a stop, puts her hand on her hips, stares at Damien, and says angrily, " I can't believe what you just did! Damien blushes, averts his gaze, and mumbles, "Sorry, I'll get it- I just wasn't thinking." As the tension drains from Maria's face. she gives her head a playful toss, smiles, and says, Well, just see that it doesn't happen again.
1. Contexts
a. Physical
b. Social
c. Historical
d. Psychological
2. Participants
3. Channels
4. Message
5. Interference (Noise)
6. Feedback
.
Elements of Music #1 Handout1. Rhythm the flow of music in te.docxtoltonkendal
Elements of Music #1 Handout
1. Rhythm
the flow of music in terms of time
2. Beat
the pulse that recurs regularly in music
3. Meter
the regular pattern of stressed and unstressed beats
4. Tempo
the speed of the beats in a piece of music
5. Polyrhythm
two or more rhythm patterns occurring simultaneously
6. Pitch
the perceived highness or lowness of a musical sound
7. Melody
a series of consecutive pitches that form a cohesive musical entity
8. Counterpoint
two or more independent lines with melodic character occurring at the same time
9. Harmony
the simultaneous sounds of several pitches, usually in accompanying a melody
10. Dynamics
the amount of loudness in music
11. Timbre
tone quality or tone color in music
12. Form
the pattern or plan of a musical work
Framework for Improving
Critical Infrastructure Cybersecurity
Version 1.1
National Institute of Standards and Technology
April 16, 2018
April 16, 2018 Cybersecurity Framework Version 1.1
This publication is available free of charge from: https://doi.org/10.6028/NIST.CSWP.04162018 ii
No t e t o Rea d er s o n t h e U p d a t e
Version 1.1 of this Cybersecurity Framework refines, clarifies, and enhances Version 1.0, which
was issued in February 2014. It incorporates comments received on the two drafts of Version 1.1.
Version 1.1 is intended to be implemented by first-time and current Framework users. Current
users should be able to implement Version 1.1 with minimal or no disruption; compatibility with
Version 1.0 has been an explicit objective.
The following table summarizes the changes made between Version 1.0 and Version 1.1.
Table NTR-1 - Summary of changes between Framework Version 1.0 and Version 1.1.
Update Description of Update
Clarified that terms like
“compliance” can be
confusing and mean
something very different
to various Framework
stakeholders
Added clarity that the Framework has utility as a structure and
language for organizing and expressing compliance with an
organization’s own cybersecurity requirements. However, the
variety of ways in which the Framework can be used by an
organization means that phrases like “compliance with the
Framework” can be confusing.
A new section on self-
assessment
Added Section 4.0 Self-Assessing Cybersecurity Risk with the
Framework to explain how the Framework can be used by
organizations to understand and assess their cybersecurity risk,
including the use of measurements.
Greatly expanded
explanation of using
Framework for Cyber
Supply Chain Risk
Management purposes
An expanded Section 3.3 Communicating Cybersecurity
Requirements with Stakeholders helps users better understand
Cyber Supply Chain Risk Management (SCRM), while a new
Section 3.4 Buying Decisions highlights use of the Framework
in understanding risk associated with commercial off-the-shelf
products and services. Additional Cyber SCRM criteria we.
Elements of Music Report InstrumentsFor the assignment on the el.docxtoltonkendal
Elements of Music Report Instruments
For the assignment on the elements of music, students will write a report with a minimum of 300 words.
Students must select one element of music that they consider to be the most important element:
Melody
Rhythm
Harmony
Form
When writing the report, be sure you address the following questions:
Why did you select this element from among all the rest?
Do you think that all kinds of music could exist without your selected element? Elaborate on your view.
Describe a piece of music that highlights the use of your selected element.
I encourage students do research on their element of music in order to get ideas for their reports. All reports must be original works!
Do not quote any source or anybody’s thoughts. Quotes are not permitted in this Instruments Report. I am interested in your own personal thoughts, opinions, and the material you have learned from your research.
.
Elements of GenreAfter watching three of the five .docxtoltonkendal
Elements of Genre
After watching three of the five movie clips listed in the
Multimedia
section, above, describe how they fit into a specific genre (or subgenre) as explained in the text. What elements of the film are characteristic of that genre? How does it fulfill the expectations of that genre? How does it play against these expectations?
Your initial post should be at least 150 words in length. Support your claims with examples from required material(s) and/or other scholarly resources, and properly cite any references.
.
Elements of DesignDuring the process of envisioning and designing .docxtoltonkendal
Elements of Design
During the process of envisioning and designing a film, the director, production designer, and art director (in collaboration with the cinematographer) are concerned with several major spatial and temporal elements. These design elements punctuate and underscore the movement of figures within the frame, including the following: setting, lighting, costuming, makeup, and hairstyles. Choose a scene from movieclips.com. In a three to five page paper, (excluding the cover and reference pages) analyze the mise-en-scène.
Respond to the following prompts with at least one paragraph per bulleted topic:
Identify the names of the artists involved in the film’s production: the director, the production designer, and the art director. Describe in separate paragraphs each artist’s role in the overall design process. Conduct additional research if necessary, citing your book, film, and other external sources correctly in APA format.
Explain how the artists utilize lighting in the scene. How does the lighting affect our emotional understanding of certain characters? What sort of mood does the lighting evoke? How does lighting impact the overall story the filmmaker is attempting to tell?
Describe the setting, including the time period, location, and culture in which the film takes place.
Explain what costuming can tell us about a character. In what ways can costuming be used to reflect elements of the film's plot?
Explain how hairstyle and makeup can help tell the story. What might hairstyle and makeup reveal about the characters?
Discuss your opinion regarding the mise-en-scène. Do the elements appear to work together in a harmonious way? Does the scene seem discordant? Do you think the design elements are congruent with the filmmaker’s vision for the scene?
.
Elements of Critical Thinking [WLOs 2, 3, 4] [CLOs 2, 3, 4]P.docxtoltonkendal
Elements of Critical Thinking [WLOs: 2, 3, 4] [CLOs: 2, 3, 4]
Prepare:
Prior to beginning work on this discussion forum, in preparation for discussing the importance of critical thinking skills,
Read the articles
Common Misconceptions of Critical Thinking
Combating Fake News in the Digital Age
6 Critical Thinking Skills You Need to Master Now (Links to an external site.)
Teaching and Learning in a Post-Truth world: It’s Time for Schools to Upgrade and Reinvest in Media Literacy Lessons
Critical Thinking and the Challenges of Internet (Links to an external site.)
Watch the videos
Fake News: Part 1 (Links to an external site.)
Critical Thinking
(Links to an external site.)
Review the resources
Critical Thinking Skills (Links to an external site.)
Valuable Intellectual Traits (Links to an external site.)
Critical Thinking Web (Links to an external site.)
Reflect:
Reflect on the characteristics of a critical thinker. Critical thinking gets you involved in a dialogue with the ideas you read from others in this class. To be a critical thinker, you need to be able to summarize, analyze, hypothesize, and evaluate new information that you encounter.
Write:
For this discussion, you will address the following prompts. Keep in mind that the article or video you’ve chosen should not be about critical thinking, but should be about someone making a statement, claim, or argument related to your Final Paper topic. One source should demonstrate good critical thinking skills and the other source should demonstrate the lack or absence of critical thinking skills. Personal examples should not be used.
Explain at least five elements of critical thinking that you found in the reading material.
Search the Internet, media, or the Ashford University Library, and find an example in which good critical thinking skills are being demonstrated by the author or speaker. Summarize the content and explain why you think it demonstrates good critical thinking skills.
Search the Internet, media, or the Ashford University Library, and find an example in which the author or speaker lacks good critical thinking skills. Summarize the content and explain why you think it demonstrates the absence of good, critical thinking skills.
Your initial post should be at least 250 words in length, which should include a thorough response to each prompt. You are required to provide in-text citations of applicable required reading materials and/or any other outside sources you use to support your claims. Provide full reference entries of all sources cited at the end of your response. Please use correct APA format when writing in-text citations (see
In-Text Citation Helper (Links to an external site.)
) and references (see
Formatting Your References List (Links to an external site.)
).
Reflecting on General Education and Career [WLOs: 2, 3, 4] [CLOs: 2, 3, 4]
Prepare:
Prior to beginning work on this discussion forum, read the articles
Teaching Writing S.
Elements of DesignDuring the process of envisioning and design.docxtoltonkendal
Elements of Design
During the process of envisioning and designing a film, the director, production designer, and art director (in collaboration with the cinematographer) are concerned with several major spatial and temporal elements. These design elements punctuate and underscore the movement of figures within the frame, including the following: setting, lighting, costuming, makeup, and hairstyles. Choose a scene from movieclips.com. In a three to five page paper, (excluding the cover and reference pages) analyze the mise-en-scène.
Respond to the following prompts with at least one paragraph per bulleted topic:
Identify the names of the artists involved in the film’s production: the director, the production designer, and the art director. Describe in separate paragraphs each artist’s role in the overall design process. Conduct additional research if necessary, citing your book, film, and other external sources correctly in APA format.
Explain how the artists utilize lighting in the scene. How does the lighting affect our emotional understanding of certain characters? What sort of mood does the lighting evoke? How does lighting impact the overall story the filmmaker is attempting to tell?
Describe the setting, including the time period, location, and culture in which the film takes place.
Explain what costuming can tell us about a character. In what ways can costuming be used to reflect elements of the film's plot?
Explain how hairstyle and makeup can help tell the story. What might hairstyle and makeup reveal about the characters?
Discuss your opinion regarding the mise-en-scène. Do the elements appear to work together in a harmonious way? Does the scene seem discordant? Do you think the design elements are congruent with the filmmaker’s vision for the scene?
.
Elements of a contact due 16 OctRead the Case Campbell Soup Co. v..docxtoltonkendal
Elements of a contact due 16 Oct
Read the Case Campbell Soup Co. v. Wentz in the text. Answer the following questions:
1. What were the terms of the contract between Campbell and the Wentzes?
2. Did the Wentzes perform under the contract?
3. Did the court find specific performance to be an adequate legal remedy in this case?
4. Why did the court refuse to help Campbell in enforcing its legal contract?
5. How could Campbell change its contract in the future so as to avoid the unconsionability problem?
Facts:
Per
a
written
contract
between
Campbell
Soup
Company
(a
New
Jersey
company)
and
the
Wentzes
(carrot
farmers
in
Pennsylvania),
the
Wentzes
would
deliver
to
Campbell
all
the
Chantenay
red
cored
carrots
to
be
grown
on
the
Wentz
farm
during
the
1947
season.
The
contract
price
for
the
carrots
was
$30
per
ton.
The
contract
between
Campbell
Soup
and
all
sellers
of
carrots
was
drafted
by
Campbell
and
it
had
a
provision
that
prohibited
farmers/sellers
from
selling
their
carrots
to
anyone
else,
except
those
carrots
that
were
rejected
by
Campbell.
The
contract
also
had
a
liquidated
damages
provision
of
$50
per
ton
if
the
seller
breached,
but
it
had
no
similar
provision
in
the
event
Campbell
breached.
The
contract
not
only
allowed
Campbell
to
reject
nonconforming
carrots,
but
gave
Campbell
the
right
to
determine
who
could
buy
the
carrots
it
had
rejected.
The
Wentzes
harvested
100
tons
of
carrots,
but
because
the
market
price
at
the
time
of
harvesting
was
$90
per
ton
for
these
rare
carrots,
the
Wentzes
refused
to
deliver
them
to
Campbell
and
sold
62
tons
of
their
carrots
to
a
farmer
who
sold
some
of
those
carrots
to
Campbell.
Campbell
sued
the
Wentzes,
asking
for
the
court's
order
to
stop
further
sale
of
the
contracted
carrots
to
others
and
to
compel
specific
performance
of
the
contract.
The
trial
court
ruled
for
the
Wentzes
and
Campbell
appealed.
Issues:
Is
specific
performance
an
appropriate
legal
remedy
in
this
case
or
is
the
contract
unconscionable?
Discussion:
In
January
1948,
it
was
virtually
impossible
to
obtain
Chantenay
carrots
in
the
open
market.
Campbell
used
Chantenay
carrots
(which
are
easier
to
process
for
soup
making
than
other
carrots)
in
large
quantities
and
furnishes
the
seeds
to
farmers
with
whom
it
contracts.
Campbell
contracted
for
carrots
long
ahead,
and
farmers
entered
into
the
contract
willingly.
If
the
facts
of
this
case
were
this
simple,
specific
performance
should
have
been
granted.
However,
the
problem
is
with
the
contract
itself,
which
was
one-sided.
According
to
the
appellate
court,
the
most
direct
example
of
unconscionability
was
the
provision
that,
under
certain
.
Elements for analyzing mise en sceneIdentify the components of.docxtoltonkendal
Elements for analyzing mise en scene
Identify the components of the shot, but explaining the meaning or significance behind those components and connecting the shot to the themes of the film
1. Dominant: Where is the eye attracted first? Why?
2. Lighting key: High key? Low key? High contrast? Some combination of these?
3. Shot and camera proxemics: What type of shot? How far away is the camera from the action?
4. Angle: Is the viewer (through the eye of the camera) looking up or down on the subject? Or is the camera neutral (eye level)?
5. Color values: What is the dominant color? Are there contrasting foils? Is there color symbolism?
6. Lens/filter/stock: How do these distort or comment on the
photographed materials?
7. Subsidiary contrasts: What are the main eye-stops after taking in the dominant?
8. Density: How much visual information is packed into the image? Is the texture stark, moderate, or highly detailed?
9. Composition: How is the two-dimensional space segmented and organized? What is the underlying design?
10. Form: Open or closed? Does the image suggest a window that arbitrarily isolates a fragment of the scene? Or a proscenium arch, in which the visual elements are carefully arranged and held in balance?
11. Framing: Tight or loose? Do characters have little to no room to move, or can they move freely without impediments?
12. Depth: On how many planes is the image composed? Does the background or foreground comment in any way on the midground?
13. Character placement: What part of the framed space do the characters occupy? Center? Top? Bottom? Edges? Why?
14. Staging positions: Which way do the characters look vis-à-vis the camera?
15. Character proxemics: How much space is between the
characters?
What are the 4 distinct formal elements that make up a film's mise en scene?
• staging of the action
• physical setting and decor
• the manner in which these materials are framed
• the manner in which they are photographed
.
Elements in the same row have the same number of () levelsWhi.docxtoltonkendal
Elements in the same row have the same number of (*) levels
Which elements in B O U L A N would be in the same family? Which would have the same number of energy levels? Highest mass? Lowest mass?
Which is more reactive? Uranium or Lithium
Will elements B and U lose electrons in a chemical reactor?
Will elements B and U form positive or negative ions?
Thanks so much (:
.
ELEG 421 Control Systems Transient and Steady State .docxtoltonkendal
ELEG 421
Control Systems
Transient and Steady State
Response Analyses
Dr. Ashraf A. Zaher
American University of Kuwait
College of Arts and Science
Department of Electrical and Computer Engineering
Layout
2
Objectives
This chapter introduces the analysis of the time response of different
control systems under different scenarios. Only first and second order
systems will be considered in details using analytical and numerical
methods. Extension to higher order systems will be developed. Both
transient and steady state responses will be evaluated. Stability analysis
will be analyzed for different kinds of feedback, while investigating the
effect of both proportional and derivative control actions on the
performance of the closed-loop system. Finally systems types and
steady state errors will be calculated for unity feedback.
Outcomes
By the end of this chapter, students will be able to:
evaluate both transient/steady state responses for control systems,
analyze the stability of closed-loop LTI systems,
investigate the effect of P and I control actions on performance, and
understand dominant dynamics of higher order systems.
Dr. Ashraf Zaher
Introduction
3
Test signals
Transient response
Steady state response
Analytical techniques, and
Numerical (simulation) techniques.
Stability (definition and analysis methods),
Relative stability, and
Effect of P/I control actions on stability and performance.
Summary of the used systems:
First order systems,
Second order systems, and
Higher order systems.
Dr. Ashraf Zaher
Test Signals
4 Dr. Ashraf Zaher
Impulse function:
Used to simulate shock inputs,
Laplace transform: 1.
Step function:
Used to simulate sudden disturbances,
Laplace transform: 1/s.
Ramp function:
Used to simulate gradually changing inputs,
Laplace transform: 1/s2.
Sinusoidal function(s):
Used to test response to a certain frequency,
Laplace transform: s/(s2+ω2) for cos(ωt) and ω/(s2+ω2) for sin(ωt).
White noise function:
Used to simulate random noise,
It is a stochastic signal that is easier to deal with in the time domain.
Total response:
C(s) = R(s)*TF(s) = Ctr(s) + Css(s) → c(t) = ctr(t) + css(t)
Fundamentals
5 Dr. Ashraf Zaher
Definitions:
Zeros (Z) of the TF
Poles (P) of the TF
Transient Response (Natural)
Steady State Response (Forced)
Total Response
Limits:
Initial values
Final values
Systems (?Zs):
First order (one P)
Second order (two Ps)
Higher order!
More:
Stability and relative stability
Steady state errors (unity feedback)
First Order Systems
6 Dr. Ashraf Zaher
TF:
T: time constant
Unit Step Response:
1
1
)(
)(
+
=
TssR
sC
)/1(
11
1
1
1
11
)(
TssTs
T
sTss
sC
+
−=
+
−=
+
=
Ttetc /1)( −−=
632.01)( 1 =−== −eTtc
T
e
Tdt
tdc Tt
t
11)( /
0
== −
=
01)0( 0 =−== etc
11)( =−=∞= −∞etc
First Order Systems.
Element 010 ASSIGNMENT 3000 WORDS (100)Task Individual assign.docxtoltonkendal
Element 010 ASSIGNMENT: 3000 WORDS (100%)
Task: Individual assignment (3000 words)
Weighting: 100%
Assessment Case Study:
Greenland Garden Centre
[1]
Jon Smith spread his arms widely as he surveyed his garden centre.
‘Of course the whole market for leisure products and services, especially garden-related products, has been expanding over the last few years. Even so, we have been particularly successful. Partly this is because we are conveniently located, but it is also because we have developed a reputation for excellent service. Customers like coming to us for advice. We have also been successful in attracting some of the ‘personality gardeners’ from television to make special appearances. My main ambition now is to fully develop all of our twelve hectares to make the centre a place people will want to visit in its own right. I envisage the centre developing into almost a mini gardening theme park with special gardens, beautiful grounds and special events.’
Greenland is a large village situated in the Cotswolds, a popular tourist area of the UK. It has an interesting range of shops and restaurants, mainly catering for the tourist trade. About half a mile outside the village is the Greenland Garden Centre. The garden centre is served by a good network of main roads but is inaccessible by public transport.
Growth over the last five years has been dramatic and the garden centre now sells many other goods as well as gardening requisites. It also has a restaurant. It is open seven days a week, only closing on Christmas Day. Its opening hours are Monday– Saturday 9 a.m. to 6 p.m. and Sunday 10 a.m. to 5 p.m. all year round.
Outside the centre
The centre has a large car park which can accommodate about 350 cars. Outside the entrance a map indicates the various areas in the garden centre. Most customers walk round the grounds before making their purchases. The length of time people spend in the centre varies but, according to a recent study, averages 53 minutes during the week and 73 minutes at weekends.
The same study shows the extent to which the number of customers arriving at the garden centre varies depending on the time of year, day of the week, and time of day. There are two peaks in customer numbers, one during the late spring/early summer period and another in the build up to Christmas, as Greenland puts on particularly good Christmas displays.
Indoor sales area
The range of goods has increased dramatically over the past few years and now includes items such as:
pets and aquatics
seeds
fertilisers
indoor pots and plants
gardening equipment
garden lighting
conservatory-style furniture
outdoor clothing
picture gallery
books and toys
delicatessen
wine
kitchen equipment
soft furnishing
outdoor eating equipment
gifts, stationery, cards, aromatherapy products
freshly cut flowers
dried flowers.
Outside sales area
In the open air and in large glasshouses there is a complete range of plants, shrubs and trees. Gre.
ELEG 320L – Signals & Systems Laboratory Dr. Jibran Khan Yous.docxtoltonkendal
ELEG 320L – Signals & Systems Laboratory /Dr. Jibran Khan Yousafzai Lab 4
1
LAB 4: CONVOLUTION
Background & Concepts
Convolution is denoted by:
𝑦[𝑛] = 𝑥[𝑛] ∗ ℎ[𝑛]
Your book has described the "flip and shift" method for performing convolution. First, we
set up two signals 𝑥[𝑘] and ℎ[𝑘]:
Flip one of the signals, say ℎ[𝑘], to form ℎ[−𝑘]:
ELEG 320L – Signals & Systems Laboratory /Dr. Jibran Khan Yousafzai Lab 4
2
Shift ℎ[−𝑘] by n to form ℎ[𝑛 − 𝑘]. For each value of 𝑛, form 𝑦[𝑛] by multiplying and
summing all the element of the product of𝑥[𝑘]ℎ[𝑛 − 𝑘], −∞ < 𝑘 < ∞. The figure
below shows an example of the calculation of𝑦[1]. The top panel shows𝑥[𝑘]. The
middle panel showsℎ[1 − 𝑘]. The lower panel shows𝑥[𝑘]𝑦[1 − 𝑘]. Note that this is a
sequence on a 𝑘 axis. The sum of the lower sequence over all k gives 𝑦[1] = 2.
We repeat this shifting, multiplication and summing for all values of 𝑛 to get the
complete sequence 𝑦[𝑛]:
ELEG 320L – Signals & Systems Laboratory /Dr. Jibran Khan Yousafzai Lab 4
3
The conv Command
conv(x,h) performs a 1-D convolution of vectors 𝑥 and ℎ. The resulting vector 𝑦
has length length(𝑦) = length(𝑥) + length(ℎ) − 1. Imagine vector 𝑥 as being
stationary and the flipped version of ℎ is slid from left to right. Note that conv(x,h) =
conv(h,x). An example of the convolution of two signals and plotting the result is
below:
>> x = [0.5 0.5 0.5]; %define input signal x[n]
>> h = [3.0 2.0 1.0]; %unit-pulse response h[n]
>> y = conv(x,h); %compute output y[n] via convolution
>> n = 0:(length(y)-1); %for plotting y[n]
>> stem(n,y) % plot y[n]
>> grid;
>> xlabel('n');
>> ylabel('y[n]');
>> title('Output of System via Convolution');
ELEG 320L – Signals & Systems Laboratory /Dr. Jibran Khan Yousafzai Lab 4
4
Deconvolution
The command [q,r] = deconv(v,u), deconvolves vector u out of vector v, using long
division. The quotient is returned in vector q and the remainder in vector r such that
v = conv(u,q)+r. If u and v are vectors of polynomial coefficients, convolving them is
equivalent to multiplying the two polynomials, and deconvolution is polynomial
division. The result of dividing v by u is quotient q and remainder r. An examples is
below:
If
>> u = [1 2 3 4];
>> v = [10 20 30];
The convolution is:
>> c = conv(u,v)
c =
10 40 100 160 170 120
Use deconvolution to recover v.
>> [q,r] = deconv(c,u)
q =
10 20 30
r =
0 0 0 0 0 0
This gives a quotient equal to v and a zero remainder.
Structures
Structures in Matlab are just like structures in C. They are basically containers that
allow one
Electronic Media PresentationChoose two of the following.docxtoltonkendal
Electronic Media Presentation
Choose
two of the following types of electronic media:
Radio
Sound recording
Motion pictures
Broadcast television
Research
the history of the media types your team selected. Include the following information in your presentation:
Introduction
Notable founders and parent organizations of your electronic media types
Notable historical dates
Dates of mergers with other radio stations, record production companies, motion picture companies, or television networks to form a large media conglomerate
Date the media types launched their websites, became active on the Internet, or became active in social media integration
Identify past, present, and future challenges confronting these types of media. How has the digital era affected them? Which types are best suited to adapt to the future? Explain why
How do these challenges affect advertising in these organizations--outside companies advertising--and advertising for these media--companies promoting themselves to others? What are innovative advertising strategies these media have engaged in?
What are two similarities and two differences between the two media types?
Conclusion
Present your Electronic Media Presentation.
These are 10- to 12-slideMicrosoft
®
PowerPoint
®
presentations with notes.
.
Electronic copy available at httpssrn.comabstract=2161742.docxtoltonkendal
Electronic copy available at: http://ssrn.com/abstract=2161742
Electronic Commerce Business Models:
A Conceptual Framework
By
Utkarsh Majmudar
Ganesh N. Prabhu
July 2000
Please address all correspondence to:
Prof. Utkarsh Majmudar
Visiting Faculty (Finance & Control Area)
Indian Institute of Management
Bannerghatta Road
Bangalore - 560 076
India
Fax: (080) 6584050
E m a i l ! utkarsh&qimbxmeUn
Copies of the Working Papers may be obtained from the FPM & Research Office
Electronic copy available at: http://ssrn.com/abstract=2161742
Electronic Commerce Business Models: A Conceptual Framework
Utkarsh Majmudar and Ganesh N. Prabhu
Abstract
The recent boom in the new economy of internet based commerce has created a large
number of firms with a variety of business models that aim to leverage the power of the
internet to further their business goals. In this paper we attempt to provide a
conceptual framework for understanding e-commerce business models on a number of
important dimensions - nature of consumer activity, nature of e-commerce activity,
target customers, targeting strategy, revenue generating modes, procfactfcerwce
delivery modes, payment collection modes, operating modes, market places,
advantage mechanisms and domination characteristics. We also examine means of
improving value proposition and net-friendliness for e-commerce activities and identify
areas where e-commerce models have not been explored or fully exploited so far.
Since the range of economic activities on the internet is vast and growing, newer
models and opportunities are likely to emerge through improvements in internet
technologies as well as innovations in their application to business contexts. Hence
any conceptual framework on e-commerce business models, including our own, can
never be comprehensive.
Electronic Commerce Business Models: A Conceptual Framework - 1 -
Electronic copy available at: http://ssrn.com/abstract=2161742
Electronic Commerce Business Models: A Conceptual Framework
Introduction
The recent boom in the new economy of internet based commerce has spawned a large
number of firms with a variety of business models that aim to leverage the power of the internet to
further their business goals. This paper provides a conceptual framework for understanding these
business models and their characteristics. The conceptual framework is shown in Figure 1.
Locating Electronic Commerce in the Internet Economy
We define electronic commerce as use of the internet medium for conducting economic
transactions. Electronic commerce is a part of a larger internet economy. Conceptually, the internet
economy can be divided into four layers (Barua etal., 1999). Each layer of the internet economy is
listed below with descriptions of the types of companies and names of some of the actual companies in
each category.
(a) Layer One: The Internet Infrastructure Layer. This layer includes companies with products and
services that help cr.
Read| The latest issue of The Challenger is here! We are thrilled to announce that our school paper has qualified for the NATIONAL SCHOOLS PRESS CONFERENCE (NSPC) 2024. Thank you for your unwavering support and trust. Dive into the stories that made us stand out!
Ethnobotany and Ethnopharmacology:
Ethnobotany in herbal drug evaluation,
Impact of Ethnobotany in traditional medicine,
New development in herbals,
Bio-prospecting tools for drug discovery,
Role of Ethnopharmacology in drug evaluation,
Reverse Pharmacology.
The French Revolution, which began in 1789, was a period of radical social and political upheaval in France. It marked the decline of absolute monarchies, the rise of secular and democratic republics, and the eventual rise of Napoleon Bonaparte. This revolutionary period is crucial in understanding the transition from feudalism to modernity in Europe.
For more information, visit-www.vavaclasses.com
Operation “Blue Star” is the only event in the history of Independent India where the state went into war with its own people. Even after about 40 years it is not clear if it was culmination of states anger over people of the region, a political game of power or start of dictatorial chapter in the democratic setup.
The people of Punjab felt alienated from main stream due to denial of their just demands during a long democratic struggle since independence. As it happen all over the word, it led to militant struggle with great loss of lives of military, police and civilian personnel. Killing of Indira Gandhi and massacre of innocent Sikhs in Delhi and other India cities was also associated with this movement.
2024.06.01 Introducing a competency framework for languag learning materials ...Sandy Millin
http://sandymillin.wordpress.com/iateflwebinar2024
Published classroom materials form the basis of syllabuses, drive teacher professional development, and have a potentially huge influence on learners, teachers and education systems. All teachers also create their own materials, whether a few sentences on a blackboard, a highly-structured fully-realised online course, or anything in between. Despite this, the knowledge and skills needed to create effective language learning materials are rarely part of teacher training, and are mostly learnt by trial and error.
Knowledge and skills frameworks, generally called competency frameworks, for ELT teachers, trainers and managers have existed for a few years now. However, until I created one for my MA dissertation, there wasn’t one drawing together what we need to know and do to be able to effectively produce language learning materials.
This webinar will introduce you to my framework, highlighting the key competencies I identified from my research. It will also show how anybody involved in language teaching (any language, not just English!), teacher training, managing schools or developing language learning materials can benefit from using the framework.
Palestine last event orientationfvgnh .pptxRaedMohamed3
An EFL lesson about the current events in Palestine. It is intended to be for intermediate students who wish to increase their listening skills through a short lesson in power point.
How to Create Map Views in the Odoo 17 ERPCeline George
The map views are useful for providing a geographical representation of data. They allow users to visualize and analyze the data in a more intuitive manner.
Model Attribute Check Company Auto PropertyCeline George
In Odoo, the multi-company feature allows you to manage multiple companies within a single Odoo database instance. Each company can have its own configurations while still sharing common resources such as products, customers, and suppliers.
Students, digital devices and success - Andreas Schleicher - 27 May 2024..pptxEduSkills OECD
Andreas Schleicher presents at the OECD webinar ‘Digital devices in schools: detrimental distraction or secret to success?’ on 27 May 2024. The presentation was based on findings from PISA 2022 results and the webinar helped launch the PISA in Focus ‘Managing screen time: How to protect and equip students against distraction’ https://www.oecd-ilibrary.org/education/managing-screen-time_7c225af4-en and the OECD Education Policy Perspective ‘Students, digital devices and success’ can be found here - https://oe.cd/il/5yV
Elevated Blood Lead Levels in Children AssociatedWith the Fl.docx
1. Elevated Blood Lead Levels in Children Associated
With the Flint Drinking Water Crisis: A Spatial
Analysis of Risk and Public Health Response
Mona Hanna-Attisha, MD, MPH, Jenny LaChance, MS, Richard
Casey Sadler, PhD, and Allison Champney Schnepp, MD
Objectives. We analyzed differences in pediatric elevated blood
lead level incidence
before and after Flint, Michigan, introduced a more corrosive
water source into an aging
water system without adequate corrosion control.
Methods. We reviewed blood lead levels for children younger
than 5 years before
(2013) and after (2015) water source change in Greater Flint,
Michigan. We assessed the
percentage of elevated blood lead levels in both time periods,
and identified geo-
graphical locations through spatial analysis.
Results. Incidence of elevated blood lead levels increased from
2.4% to 4.9% (P < .05)
after water source change, and neighborhoods with the highest
water lead levels ex-
perienced a 6.6% increase. No significant change was seen
2. outside the city. Geospatial
analysis identified disadvantaged neighborhoods as having the
greatest elevated blood
lead level increases and informed response prioritization during
the now-declared public
health emergency.
Conclusions. The percentage of children with elevated blood
lead levels increased
after water source change, particularly in socioeconomically
disadvantaged neighbor-
hoods. Water is a growing source of childhood lead exposure
because of aging infra-
structure. (Am J Public Health. 2016;106:283–290.
doi:10.2105/AJPH.2015.303003)
See also Rosner, p. 200.
In April 2014, the postindustrial city ofFlint, Michigan, under
state-appointed
emergency management, changed its water
supply from Detroit-supplied Lake Huron
water to the Flint River as a temporary
measure, awaiting a new pipeline to Lake
Huron in 2016. Intended to save money, the
change in source water severed a half-
century relationship with the Detroit Water
and Sewage Department. Shortly after the
switch to Flint River water, residents voiced
concerns regarding water color, taste, and
3. odor, and various health complaints in-
cluding skin rashes.1 Bacteria, including
Escherichia coli, were detected in the distri-
bution system, resulting in Safe Drinking
Water Act violations.2 Additional disinfec-
tion to control bacteria spurred formation of
disinfection byproducts including total tri-
halomethanes, resulting in Safe Drinking
Water Act violations for trihalomethane
levels.2
Water from the Detroit Water and
Sewage Department had very low corrosivity
for lead as indicated by low chloride, low
chloride-to-sulfate mass ratio, and presence
of an orthophosphate corrosion inhibitor.3,4
By contrast, Flint River water had high
chloride, high chloride-to-sulfate mass ratio,
and no corrosion inhibitor.5 Switching
from Detroit’s Lake Huron to Flint River
water created a perfect storm for lead leach-
ing into drinking water.6 The aging Flint
water distribution system contains a high
percentage of lead pipes and lead plumbing,
with estimates of lead service lines ranging
from 10% to 80%.7 Researchers from Virginia
Tech University reported increases in water
lead levels (WLLs),5 but changes in blood
lead levels (BLLs) were unknown.
Lead is a potent neurotoxin, and child-
hood lead poisoning has an impact on
many developmental and biological pro-
cesses, most notably intelligence, behavior,
4. and overall life achievement.8 With estimated
societal costs in the billions,9–11 lead poi-
soning has a disproportionate impact on
low-income and minority children.12 When
one considers the irreversible, life-altering,
costly, and disparate impact of lead exposure,
primary prevention is necessary to
eliminate exposure.13
Historically, the industrial revolution’s
introduction of lead into a host of products
has contributed to a long-running and
largely silent pediatric epidemic.14 With
lead now removed from gasoline and paint,
the incidence of childhood lead poisoning
has decreased.15 However, lead contamina-
tion of drinking water may be increasing
because of lead-containing water in-
frastructures, changes in water sources, and
changes in water treatment including disin-
fectant.16–18 A soluble metal, lead leaches into
drinking water via lead-based plumbing or
lead particles that detach from degrading
plumbing components. (“Plumbing” is
derived from the Latin word for lead,
ABOUT THE AUTHORS
Mona Hanna-Attisha and Allison Champney Schnepp are with
Hurley Children’s Hospital/Michigan State University
College of Human Medicine, Department of Pediatrics and
Human Development, Flint, MI. Jenny LaChance is with Hurley
Medical Center Research, Flint. Richard Casey Sadler is with
Michigan State University College of Human Medicine,
Division of Public Health, Flint.
Correspondence should be sent to Mona Hanna-Attisha, MD,
5. MPH, FAAP, Hurley Medical Center, Pediatrics 3W, One
Hurley Plaza, Flint, MI 48503 (e-mail: [email protected]).
Reprints can be ordered at http://www.ajph.org by clicking the
“Reprints” link.
This article was accepted November 21, 2015.
doi: 10.2105/AJPH.2015.303003
February 2016, Vol 106, No. 2 AJPH Hanna-Attisha et al. Peer
Reviewed Research 283
AJPH RESEARCH
mailto:[email protected]
http://www.ajph.org
“plumbum.”) Lead was restricted in plumb-
ing material in 1986, but older homes and
neighborhoods may still contain lead
service lines, lead connections, lead solder, or
other lead-based plumbing materials. Lead
solubility and particulate release is highly
variable and depends on many factors in-
cluding water softness, temperature, and
acidity.19–21 The US Environmental Pro-
tection Agency (EPA) regulates lead in
public water supplies under the Safe Drinking
Water Act Lead and Copper Rule, which
requires action when lead levels reach 15 parts
per billion (ppb).
Lead in drinking water is different from
lead from other sources, as it disproportion-
ately affects developmentally vulnerable
children and pregnant mothers. Children can
6. absorb 40% to 50% of an oral dose of
water-soluble lead compared with 3% to 10%
for adults.22 In a dose–response relationship
for children aged 1 to 5 years, for every 1-ppb
increase in water lead, blood lead increases
35%.23 The greatest risk of lead in water may
be to infants on reconstituted formula.
Among infants drinking formula made from
tap water at 10 ppb, about 25% would ex-
perience a BLL above the Centers for Disease
Control and Prevention (CDC) elevated
blood lead level (EBLL) of 5 micrograms per
deciliter (mg/dL).24 Tap water may account
for more than 85% of total lead exposure
among infants consuming reconstituted
formula.25 A known abortifacient, lead has
also been implicated in increased fetal
deaths and reduced birth weights.26
As recommended by the CDC and
supported by the American Academy of
Pediatrics, blood lead screening is routine
for high-risk populations and for children
insured by Medicaid at age 1 and 2 years.27
The CDC-recommended screening ages
are based on child development (increased
oral–motor behavior), which places a child
most at risk for house-based lead exposure
(e.g., peeling paint, soil, dust). State and
national blood lead–screening programs,
however, do not adequately capture the
risk of lead in water because infants are at
greatest risk.
Armed with reports of elevated WLLs
7. and recognizing the lifelong consequences of
lead exposure, our research team sought to
analyze blood lead data before (pre) and
after (post) the water source switch with
a geographic information system (GIS) to
determine lead exposure risk and prioritize
responses. This research has immediate public
policy, public health, environmental, and
socioeconomic implications.
This research includes Flint, Michigan, and
surrounding municipalities in Genesee
County (Greater Flint). Greater Flint is a
postindustrial region of nearly 500 000 people
struggling from years of disinvestment by
the automobile industry and associated
manufacturing activities: the region has lost
77% of its manufacturing employment and
41% of employment overall since 1980.28
National and local data sources demonstrate
dismal indicators for children, especially
within Flint city limits.29–32 Greater Flint
ranks toward the bottom of the state in rates of
childhood poverty (42% in Flint vs 16.2% in
Michigan and 14.8% in the United States),
unemployment, violent crime, illicit drug
use, domestic violence, preterm births, infant
mortality, and overall health outcomes (81st
out of 82 Michigan counties).
Greater Flint’s struggles have been am-
plified by a history of racial discrimination,
whereby exclusionary housing practices were
common.33,34 Such attitudes toward in-
8. tegration later precipitated White flight and
emboldened home-rule governance,35,36
causing a massive decline in tax revenue for
the city. The declining industrial and resi-
dential tax bases strained the city’s ability to
provide basic services and reversed the public
health fortunes of the city and suburbs.37
Severely reduced city population densities
reduced water demand in the distribution
system, exacerbating problems with lead
corrosion.
METHODS
This retrospective study includes all chil-
dren younger than 5 years who had a BLL
processed through the Hurley Medical
Center’s laboratory, which runs BLLs for
most Genesee County children. The pre
time period (before the water source change)
was January 1, 2013, to September 15, 2013,
and the post time period (after the water
source change) was January 1, 2015, to
September 15, 2015. The primary study
group comprised children living within the
city of Flint (n = 1473; pre = 736; post = 737)
who received water from the city water
system. Children living outside the city where
the water source was unchanged served as
a comparison group (n = 2202; pre = 1210;
post = 992).
After institutional review board approval
9. and Health Insurance Portability and
Accountability Act waiver, we drew data
from the Epic electronic medical record
system including BLL, medical record
number, date of birth, date of blood draw,
full address, sex, and race. For each child,
only the highest BLL was maintained in the
data set. We coded timing (pre or post) of
the BLL on the basis of the date of blood draw.
We calculated age at time of blood draw.
We geocoded the data set with a dual-
range address locator, and manually con-
firmed accuracy of geocoded addresses. We
conducted a series of spatial joins to assign
participant records to Greater Flint munici-
palities and Flint wards (including those
with high WLL), enabling the calculation
of the number and percentage of children
with EBLLs in each geographic region for
both time periods. The reference value for
EBLL was 5 mg/dL or greater. We identified
Flint wards with high WLLs with water
lead sampling maps.38 Wards 5, 6, and 7
had the highest WLLs; in each ward, more
than 25% of samples had a WLL higher than
15 ppb. We theorized that children living in
this combination of wards would have the
highest incidence of EBLLs (referred to as
“high WLL Flint”; the remainder of Flint
was referred to as “lower WLL Flint”).
We derived overall neighborhood-level
socioeconomic disadvantage from census
block group variables intended to measure
material and social deprivation. We calculated
10. these scores from an unweighted z score sum
of rates of lone parenthood, poverty, low
educational attainment, and unemployment
(adapted from Pampalon et al.39; used pre-
viously in Flint by Sadler et al.40), and assigned
these to each child on the basis of home
address. Positive values denote higher disad-
vantage, and negative values denote lower
disadvantage. Table 1 highlights the overall
socioeconomic disadvantage score compari-
son by time period and area.
We created spatial references for EBLL
risk and a predictive surface for BLL by using
GIS, providing the ability to see otherwise
invisible spatial–temporal patterns in envi-
ronmental exposure.17 Because of the need to
AJPH RESEARCH
284 Research Peer Reviewed Hanna-Attisha et al. AJPH
February 2016, Vol 106, No. 2
understand spatial variations and geo-
graphically target resources, we also ran
ordinary Kriging with a spherical semivario-
gram model on the entire data set for Greater
Flint, allowing interpolation of associated
BLL risks with lead in water. Previous
methods for evaluating spatial variation in
lead levels have ranged from multivariable
analyses at the individual level41 to in-
terpolation methods such as inverse distance
weighting42 and Kriging.43 Given our as-
11. sumption that lead risk is spatially correlated in
Greater Flint because of the age and condition
of pipes, interpolation methods are appro-
priate for building a preliminary risk surface.
Both inverse distance weighting and Kriging
derive such surfaces by calculating values at
unmeasured locations based on weighting
nearby measured values more strongly than
distant values.44 Whereas inverse distance
weighting is a deterministic procedure and
relies on predetermined mathematical for-
mulae, Kriging has the added sophistication
of using geostatistical models that consider
spatial autocorrelation, thereby improving
accuracy of prediction surfaces (ArcGIS
Desktop version 10.3, Environmental Sys-
tems Research Institute, Redlands, CA).
As well, Kriging can be run with relatively
few input points: adequate ranges fall be-
tween 30 and 100 total points, although
Kriging has been conducted with just 7.44
Our city of Flint sample included 736
children in the pre period and 737 children
in the post period, which amounts to a
density of approximately 22 points per square
mile. Kriging has become an increasingly
common method for measuring variations in
soil lead, and is given more in-depth treat-
ment elsewhere.45 To examine change in
proportion of children with EBLL from the
pre to post time periods, we used c2 analysis
with continuity correction for each area
(outside Flint, all Flint, high WLL Flint,
and lower WLL Flint). In addition, we ex-
12. amined differences in overall socioeconomic
disadvantage scores from the pre to post
time periods by using the independent t test.
Finally, we used both c2 analysis with con-
tinuity correction and 1-way ANOVA to
assess demographic differences by area. We
used post hoc least significant difference
analysis following statistically significant
1-way ANOVAs.
RESULTS
We uncovered a statistically significant
increase in the proportion of Flint children
with EBLL from the pre period to the pro-
portion of Flint children in the post period.
In the pre period, 2.4% of children in Flint
had an EBLL; in the post period, 4.9% of
children had an EBLL (P < .05). By compar-
ison, outside of Flint water, the change in
EBLL was not statistically significant (0.7% to
1.2%; P > .05). In high WLL Flint, EBLL
increasedfrom4.0%to10.6%(P < .05).Figure1
shows the EBLL percentage change per area.
Results of the GIS analyses show signifi-
cant clustering of EBLLs within the Flint
city limits. According to ordinary Kriging,
Figure 2 shows a predicted surface based on
observations of actual child BLL geocoded
to home address to visualize BLL variation
over space (measured in mg/dL). The darkest
shades of red represent the highest risk for
EBLL based on existing observations. Outside
Flint, the entire county falls entirely within
the lowest half of the range (in shades of blue);
13. the only locations where predicted BLL is
greater than 1.75 mg/dL is within Flint city
limits.
Within Figure 2, each ward is also labeled
according to the percentage of water samples
that exceeded 15 ppb. The areas with the
highest WLLs strongly coincide with the
areas with the highest predicted BLLs. In
addition, the high percentage of EBLL in
wards 5, 6, and 7 also correspond with the
high WLLs in wards 5, 6, and 7 (the labels
in Figure 2). Table 2 shows ward-specific
WLLs, pre period and post period EBLL
percentages, and predicted BLL and predicted
change in BLL from Kriging.
Areas experiencing the highest predicted
BLL in the post period (Figure 2) are generally
also areas with greatest change in predicted
BLL (measured in mg/dL) when compared
with the pre period (Table 2; Figure A,
available as a supplement to the online ver-
sion of this article at http://www.ajph.org).
Figure A quantifies this rate of change with
a green to red scale: large increases are
shown in increasingly darker shades of red,
whereas large decreases are shown in in-
creasingly darker shades of green. These
once again match with city wards that ex-
perienced greater rates of EBLL percentage
increase (Figure 1, Table 2). In wards 5 and 6
(which experienced a predicted 0.51 and
0.27 mg/dL increase, respectively), the EBLL
percentage more than tripled. In ward 5, the
EBLL percentage increased from 4.9% to
14. 15.7% (P < .05). The area of intersection
between wards 3, 4, and 5 (in the east side of
the city) also appeared high in the Kriging
analysis of Figure 2, and with a different
unit of aggregation this neighborhood would
also exhibit a significant increase in EBLL
percentage. Ward 7 had high pre period
and post period EBLL percentage levels
above 5% (with a particularly high rate in
the western portion of the ward). Citywide,
TABLE 1—Demographic Comparison of the Time Periods
Before (Pre) and After (Post) Water
Source Change From Detroit-Supplied Lake Huron Water to the
Flint River, by Area:
Flint, MI, 2013 and 2015
Outside Flint All Flint High WLL Flint Lower WLL Flint
Characteristic Pre Post Pre Post Pre Post Pre Post
Gender, %
Male 51.6 49.5 48.6 52.9 47.6 54.4 49.1 52.3
Female 48.4 50.5 51.4 47.1 52.4 45.6 50.9 47.7
Race/ethnicity, %
African American 24.3 24.5 69.4 70.6 74.9 78.8 67.0 66.9
Other categories 75.7 75.5 30.6 29.4 25.1 21.2 33.0 33.1
Age, y, mean 1.89 1.83 2.09 2.06 2.06 2.02 2.11 2.07
Overall socioeconomic
15. disadvantage score
–0.83 –0.98 2.94 2.88 2.18 2.39 3.28 3.10
Note.WLL = water lead level. No statistically significant
differences were found in any pre–post value within
any of the 4 geographical areas.
AJPH RESEARCH
February 2016, Vol 106, No. 2 AJPH Hanna-Attisha et al. Peer
Reviewed Research 285
http://www.ajph.org
4 wards (1, 4, 7, and 9) experienced decreases
in predicted BLL, 3 wards (2, 5, and 6)
experienced large increases, and 2 wards
(3 and 8) remained largely the same (Figure A).
Overall, statistically significant differences
exist between the areas examined (outside
Flint, high WLL Flint, and lower WLL Flint)
in all demographic characteristics except sex.
The overall percentage of African American
children is 24.4% outside Flint, compared
with 76.8% in high WLL Flint and 67.0%
in lower WLL Flint (P < .001). Children
outside Flint were younger (mean = 1.86
years [SD = 1.10]) than high WLL Flint
(mean = 2.04 years [SD = 1.02]) and lower
WLL Flint (mean = 2.09 years [SD = 1.07];
P < .001). Differences in overall socioeco-
nomic disadvantage scores are likewise sig-
16. nificant (P < .001). Post hoc least significant
difference analysis shows statistically signifi-
cant differences for overall socioeconomic
disadvantage between outside Flint and
high WLL Flint (P < .001), between outside
Flint and lower WLL Flint (P < .001), and
between high WLL Flint and lower WLL
Flint (P < .001).
DISCUSSION
Our findings reveal a striking increase in
the percentage of Flint children with EBLL
when we considered identical seasons
before and after the water source switch, with
no statistically significant increase in EBLL
outside Flint. The spatial and statistical ana-
lyses highlight the greatest EBLL increase
within certain wards of Flint, which corre-
spond to the areas of elevated WLLs.
A review of alternative sources of lead
exposure reveals no other potential envi-
ronmental confounders during the same time
period. Demolition projects by the Genesee
County Land Bank Authority (Heidi
Phaneuf, written communication, October
29, 2015) showed no spatial relationship to
the areas of increased EBLL rates. As well,
no known new lead-producing factories
nor changes in indoor lead remediation
programs were implemented during the study
period. Although Flint has a significant
automobile history, the historical location of
potentially lead-using manufacturing (e.g.,
17. battery plants, paint and pigment storage,
production plants) do not align with current
exposures.
Because there was no known alternative
source for increased lead exposure during this
time period, the geospatial WLL results, the
innate corrosive properties of Flint River
water, and, most importantly, the lack of
corrosion control, our findings strongly
implicate the water source change as the
probable cause for the dramatic increase in
EBLL percentage.
As in many urban areas with high levels of
socioeconomic disadvantage and minority
populations,46 we found a preexisting dis-
parity in lead poisoning. In our pre water
source switch data, the EBLL percentage in
Flint was 2.4% compared with 0.7% outside
Flint. This disparity widened with a post
water source switch Flint EBLL of 4.8%, with
no change in socioeconomic or demographic
variables (Table 1). Flint children already
suffer from risk factors that innately increase
their lead exposure: poor nutrition, con-
centrated poverty, and older housing stock.
With limited protective measures, such as
low rates of breastfeeding,47,48 and scarce
resources for water alternatives, lead in water
further exacerbates preexisting risk factors.
Increased lead-poisoning rates have profound
implications for the life course potential of
an entire cohort of Flint children already
rattled with toxic stress contributors (e.g.,
18. poverty, violence, unemployment, food
insecurity). This is particularly troublesome
in light of recent findings of the epigenetic
effects of lead exposure on one’s
grandchildren.49
The Kriging analysis showed the highest
predicted BLLs within the city along a wide
swath north and west of downtown. This
area has seen significant demographic change,
an increase in poverty, and an increase in
vacant properties, especially over the past
25 years (Richard Sadler, written commu-
nication, October 5, 2015). Higher BLLs
were also predicted northeast of downtown
and in other older neighborhoods where
poverty and vacancy rates have been high for
many decades. Significantly, the biggest
changes in predicted BLL since 2013 were
also found in these impoverished neighbor-
hoods; more stable neighborhoods in the
far north and south of the city may have
experienced improved predicted BLLs be-
cause of prevention efforts taken by the
more-often middle-class residents in
response to the water source change. Of
considerable interest is that the areas shown
as having the best public health indices by
Board and Dunsmore in Figure 2 of their
1948 article37 are virtually identical to the
areas with the worst lead levels today.
After our preliminary zip code–based
findings (pre to post water source switch
0.7
20. g
e
Pre Post
Area Examined
Note. WLL = water lead level.
*P < .05.
FIGURE 1—Comparison of Elevated Blood Lead Level
Percentage, Before (Pre) and After
(Post) Water Source Change From Detroit-Supplied Lake Huron
Water to the Flint River:
Flint, MI, 2013 and 2015
AJPH RESEARCH
286 Research Peer Reviewed Hanna-Attisha et al. AJPH
February 2016, Vol 106, No. 2
EBLL = 2.1% to 4.0%; P < .05) were shared
at a press conference,50 the City of Flint and
the Genesee County Health Department
released health advisories,51 and the county
health department subsequently declared
a public health emergency.52 Shortly after,
the State of Michigan released an action
plan with short- and long-term solutions
focusing on additional sampling, filter dis-
tribution, and corrosion control.53 One
week later, Michigan’s governor revealed
WLLs in 3 schools to be in the toxic range
21. with 1 school showing a water lead level of
101 ppb, almost 7 times the level that
requires remediation.54 A $12 million plan
to reconnect to Detroit’s water source was
announced.54
We undertook our current spatial analytic
approach to overcome limitations of zip
code boundaries and to develop a more
thorough understanding of specific areas in
Flint where EBLL risk is more severe (post
office addresses often do not align with
municipal boundaries in Michigan, and one
third of Flint mailing addresses are not in
the city of Flint). This spatial analysis is
valuable for understanding subneighborhood
patterns in EBLL risk because aggregation
by zip code or ward minimizes the richness
of spatial variation and creates artificial
barriers that may obscure hot spots (as in
the confluence of wards 3, 4, and 5).
Such use of spatial analysis for estimating
lead exposure risk has been used to target
blood lead–screening programs. In our case,
in addition to identifying areas of risk,
spatial analysis helps guide municipal and
nongovernmental relief efforts aimed at
identifying vulnerable populations in specific
neighborhoods for priority distribution of
resources (e.g., bottled water, filters, pre-
mixed formula).
Limitations
22. Our research contains a few limitations.
First, we may have underestimated water-
based lead exposure. Our sample included
all children younger than 5 years with blood
lead screening, although the greatest risk
from lead in water is in utero and during
infancy when lead screening is not done.
If lead screening were recommended at
a younger age (e.g., 6 or 9 months) for
children who live in homes with potential
lead piping or lead service lines, more children
with EBLL from water could be identified,
although state and national comparison
rates would be lacking. Second, lead
screening is not completed for all children.
It is mandated by Medicaid and
CDC-recommended for other high-risk
groups; such data may be skewed toward
higher-risk children and thus overestimate
EBLL, especially in non–high-risk areas.
Third, the underserved population of Flint
has significant housing instability: lead levels
may reflect previous environmental expo-
sure, and exposure often cannot be ade-
quately estimated on the basis of current
residence alone.55
Fourth, although large, our sample does
not reflect all lead screening from Flint.
We estimate that our data capture approxi-
mately 60% to 70% of the Michigan Child-
hood Lead Poisoning Prevention Program
data for Flint. Annual data released from
this program further support our findings,
revealing an annual decrease in EBLL per-
23. centage from May to April 2010 to 2011
until the same period in 2013 to 2014 (4.1%,
Ward 2 WLL = 25%
Ward 6 WLL = 28%
Ward 7 WLL = 28%
Ward 8 WLL = 20%
0.7–0.75 (more optimal)
0.76–1
1.01–1.25
1.26–1.5
1.51–1.75
1.76–2
2.01–2.25
2.26–2.5
2.51–2.75
2.76–3.36 (more hazardous)
*Nonresidential zones screened from results
*Ward labels indicate % of ward where
any water sample exceeded 15 ppb
24. Flint City Wards
Major streets
Predicted BLL Based on Ordinary Kriging (μg/dL)
Ward 9 WLL = 20%
0 0.25 0.5 1 Miles
N
Ward 5 WLL = 32%
Ward 3 WLL = 18%
Ward 4 WLL = 6%
Ward 1 WLL = 10%
Note. BLL = blood lead level; WLL = water lead level.
FIGURE 2—Predicted Surface of Child Blood Lead Level and
Ward-Specific Elevated Water
Lead Level After (Post) Water Source Change From Detroit-
Supplied Lake Huron Water
to the Flint River: Flint, MI, 2015
AJPH RESEARCH
February 2016, Vol 106, No. 2 AJPH Hanna-Attisha et al. Peer
Reviewed Research 287
3.3%, 2.7%, 2.2%, respectively56; Robert L.
25. Scott, e-mail correspondence, September 25,
2015). Following the water switch in April
2014, the 4-year declining trend (as seen
nationally) reversed with an annual EBLL
of 3.0%.
We found consistent results (with
control for age and methodology) when
we analyzed Michigan Childhood Lead
Poisoning Prevention Program data for
both high WLL Flint (EBLL percentage in-
creased: 6.6% to 9.6%) and outside Flint
(EBLL percentage remained virtually
unchanged: 2.2% to 2.3%). Our institution-
processed laboratory blood lead tests, how-
ever, had an even greater proportion of
children with EBLLs versus state data in the
post period. This may reflect that the BLLs
processed at Hurley Medical Center, the
region’s only safety-net public hospital,
represent a patient population most at risk
with limited resources to afford tap water
alternatives.
Conclusions and Future Research
Future research directions include con-
ducting more detailed geospatial analyses of
lead service-line locations with locations
of elevated BLLs and WLLs; repeating
identical spatial and statistical analyses in
the same time period in 2016 reflecting
changes associated with the health advisory
and return to Lake Huron source water;
analyzing feeding type (breastfed or recon-
26. stituted formula) for children with EBLLs;
analyzing cord blood lead of Flint newborns
compared with non-Flint newborns; and
conducting water lead testing from homes of
children with EBLLs.
A once celebrated cost-cutting move for
an economically distressed city, the water
source change has now wrought untold
economic, population health, and geo-
political burdens. With unchecked lead ex-
posure for more than 18 months, it is
fortunate that the duration was not longer
(as was the case in Washington, DC,’s lead-in-
water issue).16 Even so, the Flint drinking
water crisis is a dramatic failure of primary
prevention. The legal safeguards and regu-
lating bodies designed to protect vulnerable
populations from preventable lead exposure
failed.
The Lead and Copper Rule requires
water utilities to notify the state of a water
source or treatment change recognizing that
such changes can unintentionally have an
impact on the system’s corrosion control.57
Although a review is required before
implementing changes, the scope of risk as-
sessment is not specified and is subject to
misinterpretation. In response to the Flint
drinking water crisis, the EPA recently re-
leased a memo reiterating and clarifying the
need for states to conduct corrosion
control reviews before implementing
27. changes.58 This recommendation is especially
relevant for communities with aging in-
frastructures, usurped city governance, and
minimal water utility capacity; in such situ-
ations, there is an increased need for state
and federal expertise and oversight to support
decisions that protect population health.
Through vigilant public health efforts,
lead exposure has fallen dramatically over the
past 30 years.13 With the increasing recog-
nition that no identifiable BLL is safe and
without deleterious and irreversible health
outcomes,13 Healthy People 2020 identified
the elimination of EBLLs and underlying
disparities in lead exposure as a goal.59
Regrettably, our research reveals that the
potentially increasing threat of lead in
drinking water may dampen the significant
strides in childhood lead-prevention efforts.
As our aging water infrastructures continue
to decay, and as communities across the
nation struggle with finances and water
supply sources, the situation in Flint,
Michigan, may be a harbinger for future
safe drinking-water challenges. Ironically,
even when one is surrounded by the Great
Lakes, safe drinking water is not
a guarantee.
CONTRIBUTORS
M. Hanna-Attisha originated the study, developed
methods, interpreted analysis, and contributed to the
writing of the article. J. LaChance and R. Casey Sadler
assisted with the development of the methods, analyzed
28. results, interpreted the findings, and contributed to the
writing of the article. A. Champney Schnepp assisted with
the interpretation of the findings and contributed to the
writing of the article.
ACKNOWLEDGMENTS
We would like to thank Marc Edwards, PhD, and Elin
Betanzo, MS, for their expert assistance with un-
derstanding the historical and scientific background of
lead in water.
HUMAN PARTICIPANT PROTECTION
This study was reviewed and approved by Hurley Medical
Center institutional review board.
REFERENCES
1. Associated Press. “I don’t even let my dogs drink this
water.” CBS News. March 4, 2015. Available at: http://
www.cbsnews.com/news/flint-michigan-break-away-
detroit-water-riles-residents. Accessed October 3, 2015.
2. City of Flint 2014 Annual Water Quality Report. 2014.
Available at: https://www.cityofflint.com/wp-content/
uploads/CCR-2014.pdf. Accessed September 30, 2015.
3. Edwards M, Triantafyllidou S. Chloride to sulfate mass
ratio and lead leaching to water. J Am Water Works Assoc.
2007;99(7):96–109.
TABLE 2—Ward-Based Comparison of WLL Percentages, Pre-
and Post-Switch EBLL
Percentages, and Predicted Post BLL and Change in Predicted
BLL by Ordinary Kriging
Geostatistical Analysis: Flint, MI, 2013 and 2015
Ward WLL % > 15 ppb Pre EBLL% Post EBLL% Predicted Post
29. BLLa
Change in Predicted BLL
From Pre to Post, mg/dL
1 10 0.0 2.8 1.4 –0.10
2 25 0.0 1.4 0.7 0.19
3 18 1.0 4.5 2.9 0.05
4 6 3.1 1.7 2.4 –0.15
5b 32 4.9 15.7 10.3 0.51
6b 28 2.2 9.3 5.5 0.27
7b 28 5.4 5.9 5.7 -0.26
8 20 2.7 1.4 2.0 0.01
9 20 3.4 1.6 2.5 –0.43
Note. BLL = blood lead level; EBLL = elevated blood lead
level; WLL = water lead level.
aOrdinary Kriging geostatistical analysis.
bIndicates wards defined as high WLL risk in this study.
AJPH RESEARCH
288 Research Peer Reviewed Hanna-Attisha et al. AJPH
February 2016, Vol 106, No. 2
http://www.cbsnews.com/news/flint-michigan-break-away-
detroit-water-riles-residents
http://www.cbsnews.com/news/flint-michigan-break-away-
detroit-water-riles-residents
30. http://www.cbsnews.com/news/flint-michigan-break-away-
detroit-water-riles-residents
https://www.cityofflint.com/wp-content/uploads/CCR-2014.pdf
https://www.cityofflint.com/wp-content/uploads/CCR-2014.pdf
4. Edwards M, McNeill LS. Effect of phosphate inhibitors
on lead release from pipes. J Am Water Works Assoc. 2007;
94(1):79–90.
5. Edwards M, Falkinham J, Pruden A. Synergistic
impacts of corrosive water and interrupted corrosion
control on chemical/microbiological water quality: Flint,
MI. National Science Foundation Grant abstract. Avail-
able at: http://www.nsf.gov/awardsearch/showAward?
AWD_ID=1556258&HistoricalAwards=false. Accessed
September 10, 2005.
6. Guyette C. Scary: leaded water and one Flint family’s
toxic nightmare. Deadline Detroit. July 9, 2015. Available
at: http://www.deadlinedetroit.com/articles/12697/
scary_leaded_water_and_one_flint_family_s_toxic_
nightmare#.VfYm6eeZZJN. Accessed September 13,
2015.
7. Fonger R. Flint data on lead water lines stored on
45,000 index cards. Mlive Media Group. October 1, 2015.
Available at: http://www.mlive.com/news/flint/index.
ssf/2015/10/flint_official_says_data_on_lo.html.
Accessed October 4, 2015.
8. Centers for Disease Control and Prevention. Pre-
venting lead poisoning in young children. 2005. Available
at: http://www.cdc.gov/nceh/lead/publications/
PrevLeadPoisoning.pdf. Accessed September 30, 2015.
31. 9. Gould E. Childhood lead poisoning: conservative
estimates of the social and economic benefits of lead
hazard control. Environ Health Perspect. 2009;117(7):
1162–1167.
10. Landrigan PJ, Schechter CB, Lipton JM, Fahs MC,
Schwartz J. Environmental pollutants and disease in
American children: estimates of morbidity, mortality, and
costs for lead poisoning, asthma, cancer, and de-
velopmental disabilities. Environ Health Perspect. 2002;110
(7):721–728.
11. Schwartz J. Societal benefits of reducing lead expo-
sure. Environ Res. 1994;66(1):105–124.
12. Pamuk E, Makuc D, Heck K, Reuben C, Lochner K.
Socioeconomic status and health chartbook. Health,
United States, 1998. Centers for Disease Control and
Prevention. 1998. Available at: http://www.cdc.gov/
nchs/data/hus/hus98cht.pdf. Accessed October 1, 2015.
13. Low level lead exposure harms children. A renewed
call for primary prevention. Report of the Advisory
Committee on Childhood Lead Poisoning Prevention.
Centers for Disease Control and Prevention. 2012.
Available at: http://www.cdc.gov/nceh/lead/acclpp/
final_document_030712.pdf. Accessed September 2015.
14. Landrigan PJ, Graef JW. Pediatric lead poisoning
in 1987: the silent epidemic continues. Pediatrics. 1987;
79(4):582–583.
15. Shannon MW. Etiology of childhood lead poisoning.
In: Pueschel SM, Linakis JG, Anderson AC, eds. Lead
Poisoning in Childhood. Baltimore, MD: Paul H. Brookes
Publishing Company; 1996:37–58.
32. 16. Edwards M, Triantafyllidou S, Best D. Elevated
blood lead in young children due to lead-contaminated
drinking water: Washington, DC. Environ Sci Technol.
2009;43(5):1618–1623.
17. Miranda ML, Kim D, Hull AP, Paul CJ, Overstreet
Galeano MA. Changes in blood lead levels associated
with use of choramines in water treatment systems. En-
viron Health Perspect. 2007;111(2):221–225.
18. Edwards M. Designing sampling for targeting lead and
copper: implications for exposure. Lecture presented to:
the US Environmental Protection Agency National
Drinking Water Advisory Group; September 18, 2014.
19. Davidson CI, Rabinowitz M. Lead in the environ-
ment: from sources to human receptors. In: Needleman
HL, ed. Human Lead Exposure. Boca Raton, FL: CRC
Pres; 1991.
20. Gaines RH. The corrosion of lead. J Ind Eng Chem.
1913;5(9):766–768.
21. Raab GM, Laxen DPH, Anderson N, Davis S, Heaps
M, Fulton M. The influence of pH and household
plumbing on water lead concentration. Environ Geochem
Health. 1993;15(4):191–200.
22. Toxicological profile for lead. US Department of
Health and Human Services, Public Health Service,
Agency for Toxic Substances and Diseases Registry. 2007.
Available at: http://www.atsdr.cdc.gov/toxprofiles/
tp13.pdf. Accessed October 6, 2015.
23. Ngueta G, Belkacem A, Tarduf R, St-Laurent J,
33. Levallois P. Use of a cumulative exposure index to es-
timate the impact of tap-water lead concentration on
blood lead levels in 1-to 5-year-old children (Montreal,
Canada). Environ Health Perspect. 2015; Epub ahead of
print.
24. Triantafyllidou S, Gallagher D, Edwards M. Assessing
risk with increasingly stringent public health goals: the
case of water lead and blood lead in children. J Water
Health. 2014;12(1):57–68.
25. US Environmental Protection Agency. Safe Drinking
Water Act Lead and Copper Rule (LCR). Fed Regist.
1991;56:26460–26564.
26. Edwards M. Fetal death and reduced birth rates as-
sociated with exposure to lead-contaminated drinking
water. Environ Sci Technol. 2014;48(1):739–746.
27. Advisory Committee on Childhood Lead Poisoning
Prevention. Recommendations for blood lead
screening of young children enrolled in Medicaid: tar-
geting a group at high risk. MMWR Recomm Rep. 2000;
49(RR-14):1–13.
28. Jacobs AJ. The impacts of variations in development
context on employment growth: a comparison of cen-
tral cities in Michigan and Ontario, 1980–2006. Econ Dev
Q. 2009;23(4):351–371.
29. Kids Count Data Center. A project of the Annie E
Casey Foundation. Available at: http://datacenter.
kidscount.org/data#MI/3/0. Accessed September 26,
2015.
30. County health rankings and roadmaps: building
34. a culture of health, county by county. Available at: http://
www.countyhealthrankings.org/app/michigan/2015/
overview. Accessed September 26, 2015.
31. Michigan MIECHV Needs Assessment FY2015.
Available at: http://www.michigan.gov/documents/
homevisiting/Updated_MHVI_Needs_Assessment_
2014_All_counties_474015_7.pdf. Accessed October 5,
2015.
32. US Census Bureau. Quick Facts Beta. Available at:
http://www.census.gov/quickfacts/table/PST045214/
00, 2629000,26. Accessed September 2015.
33. Lewis PF. Impact of Negro migration on the
electoral geography of Flint, Michigan, 1932–1962:
a cartographic analysis. Ann Assoc Am Geogr. 1965;55(1):
1–25.
34. Taeuber KE, Taeuber AF. Negroes in Cities: Residential
Segregation and Neighborhood Change. Chicago, IL: Aldine
Publishing Company: 1969.
35. Highsmith AR. Demolition means progress:
urban renewal, local politics, and state-sanctioned ghetto
formation in Flint, Michigan. J Urban Hist. 2009;35:
348–368.
36. Zimmer BG, Hawley AH. Approaches to the so-
lution of fringe problems: preferences of residents in the
Flint metropolitan area. Public Adm Rev. 1956;16(4):
258–268.
37. Board LM, Dunsmore HJ. Environmental health
problems related to urban decentralization: as observed in
a typical metropolitan community. Am J Public Health
35. Nations Health. 1948;38(7):986–996.
38. Martin R, Tang M. Percent lead in water by Flint
ward. Flint Water Study. 2015. Available at: http://i0.wp.
com/flintwaterstudy.org/wp-content/uploads/2015/
09/Flint-Ward-Map_252-989x1280-2.jpg. Accessed
September 26, 2015.
39. Pampalon R, Hamel D, Gamache P, Raymond G. A
deprivation index for health planning in Canada. Chronic
Dis Can. 2009;29(4):178–191.
40. Sadler RC, Gilliland JA, Arku G. Community de-
velopment and the influence of new food retail sources on
the price and availability of nutritious food. J Urban Aff.
2013;35(4):471–491.
41. Hastings D, Miranda ML. Using GIS-based models
to protect children from lead exposure in international
series in operations research and management science. In:
Johnson M, ed. Community-Based Operations Research:
Decision Modeling for Local Impact and Diverse Populations.
1st
ed. New York, NY: Springer-Verlag New York; 2012:
173–187.
42. Schwarz K, Pickett STA, Lathrop RG, Weathers KC,
Pouyat RV, Cadenasso ML. The effects of the urban
built environment on the spatial distribution of lead in
residential soils. Environ Pollut. 2012;163:32–39.
43. Griffith DA, Doyle PG, Wheeler DC, Johnson DL. A
tale of two swaths: urban childhood blood-lead levels
across Syracuse, New York. Ann Assoc Am Geogr. 1998;88
(4):640–665.
36. 44. Jernigan RW. A Primer on Kriging. Washington, DC:
US Environmental Protection Agency; 1986.
45. Markus J, McBratney AB. A review of the contam-
ination of soil with lead: II. Spatial distribution and
risk assessment of soil lead. Environ Int. 2001;27(5):
399–411.
46. Schulz A, Northridge ME. Social determinants of
health: implications for environmental health promotion.
Health Educ Behav. 2004;31(4):455–471.
47. Genesee County Health Department. Re: Breast-
feeding initiation challenge. 2010. Available at: http://
www.gchd.net/PressReleases/20100923bfeeding_
challenge.asp. Accessed October 6, 2015.
48. Sherlock JC, Quinn MJ. Relationship between blood
lead concentrations and dietary lead intake in infants: the
Glasgow Duplicate Diet Study 1979–1980. Food Addit
Contam. 1986;3(2):167–176.
49. Sen A, Heredia N, Senut M-C, et al. Multigenera-
tional epigenetic inheritance in humans: DNA methyl-
ation changes associated with maternal exposure to
lead can be transmitted to the grandchildren. Sci Rep.
2015;5:14466.
50. Fonger R. Elevated lead found in more Flint kids after
water switch, study finds. Mlive Media Group. September
24, 2015. Available at: http://www.mlive.com/news/
flint/index.ssf/2015/09/study_shows_twice_as_many_
flin.html. Accessed November 8, 2015.
51. Fonger R. Flint makes lead advisory official, suggests
water filters and flushing. Mlive Media Group. September
37. 25, 2015. Available at: http://www.mlive.com/news/
flint/index.ssf/2015/09/flint_makes_lead_advisory_offi.
html. Accessed October 6, 2015.
AJPH RESEARCH
February 2016, Vol 106, No. 2 AJPH Hanna-Attisha et al. Peer
Reviewed Research 289
http://www.nsf.gov/awardsearch/showAward?AWD_ID=155625
8&HistoricalAwards=false
http://www.nsf.gov/awardsearch/showAward?AWD_ID=155625
8&HistoricalAwards=false
http://www.deadlinedetroit.com/articles/12697/scary_leaded_wa
ter_and_one_flint_family_s_toxic_nightmare#.VfYm6eeZZJN
http://www.deadlinedetroit.com/articles/12697/scary_leaded_wa
ter_and_one_flint_family_s_toxic_nightmare#.VfYm6eeZZJN
http://www.deadlinedetroit.com/articles/12697/scary_leaded_wa
ter_and_one_flint_family_s_toxic_nightmare#.VfYm6eeZZJN
http://www.mlive.com/news/flint/index.ssf/2015/10/flint_officia
l_says_data_on_lo.html
http://www.mlive.com/news/flint/index.ssf/2015/10/flint_officia
l_says_data_on_lo.html
http://www.cdc.gov/nceh/lead/publications/PrevLeadPoisoning.
pdf
http://www.cdc.gov/nceh/lead/publications/PrevLeadPoisoning.
pdf
http://www.cdc.gov/nchs/data/hus/hus98cht.pdf
http://www.cdc.gov/nchs/data/hus/hus98cht.pdf
http://www.cdc.gov/nceh/lead/acclpp/final_document_030712.p
df
http://www.cdc.gov/nceh/lead/acclpp/final_document_030712.p
df
http://www.atsdr.cdc.gov/toxprofiles/tp13.pdf
http://www.atsdr.cdc.gov/toxprofiles/tp13.pdf
http://datacenter.kidscount.org/data#MI/3/0
39. _lead_advisory_offi.html
http://www.mlive.com/news/flint/index.ssf/2015/09/flint_makes
_lead_advisory_offi.html
http://www.mlive.com/news/flint/index.ssf/2015/09/flint_makes
_lead_advisory_offi.html
52. Johnson J. Don’t drink Flint’s water, Genesee County
leaders warn. Mlive Media Group. October 1, 2015.
Available at: http://www.mlive.com/news/flint/index.
ssf/2015/10/genesee_county_leaders_warn_do.html.
Accessed October 6, 2015.
53. Erb R, Gray K. State to tackle unsafe water in Flint
with tests, filters. Detroit Free Press. October 2, 2015.
Available at: http://www.freep.com/story/news/local/
michigan/2015/10/02/state-officials-outline-plan-flint-
water/73200250. Accessed October 6, 2015.
54. J. Snyder announces $12 million-plan to fix Flint
water. Detroit Free Press. October 8, 2015. Available at:
http://www.freep.com/story/news/local/michigan/
2015/10/08/snyder-flint-water-reconnect/73567778.
Accessed October 8, 2015.
55. Kestens Y, Lebel A, Chaix B, et al. Association be-
tween activity space exposure to food establishments and
individual risk of overweight. PLoS One. 2012;7(8):
e41418.
56. Tanner K, Kaffer N. State data confirms higher
blood-lead levels in Flint kids. Detroit Free Press. Sep-
tember 29, 2015. Available at: http://www.freep.com/
story/opinion/columnists/nancy-kaffer/2015/09/26/
state-data-flint-lead/72820798. Accessed October 7,
2015.
40. 57. US Environmental Protection Agency, Office of
Water. Lead and Copper Rule 2007 short-term regula-
tory revisions and clarifications state implementation
guidance. June 2008. Available at: http://water.epa.gov/
lawsregs/rulesregs/sdwa/lcr/upload/New-Lead-and-
Copper-Rule-LCR-2007-Short-Term-Regulatory-
Revisions-and-Clarifications-State-Implementation-
Guidance.pdf. Accessed October 25, 2015.
58. Grevatt PC. Lead and Copper Rule requirements for
optimal corrosion control treatment for large drinking
water systems. Memo to EPA Regional Water Division
Directors, Regions I-X. November 3, 2015. Available at:
http://flintwaterstudy.org/wp-content/uploads/2015/
11/LCR-Requirements-for-OCCT-for-Large-DW-
Systems-11-03-2015.pdf. Accessed December 8, 2015.
59. Healthy People 2020: topics and objectives index.
Washington, DC: US Department of Health and Human
Services; 2012. Available at: http://www.healthypeople.
gov/2020/topicsobjectives2020. Accessed October 27,
2015.
AJPH RESEARCH
290 Research Peer Reviewed Hanna-Attisha et al. AJPH
February 2016, Vol 106, No. 2
http://www.mlive.com/news/flint/index.ssf/2015/10/genesee_co
unty_leaders_warn_do.html
http://www.mlive.com/news/flint/index.ssf/2015/10/genesee_co
unty_leaders_warn_do.html
http://www.freep.com/story/news/local/michigan/2015/10/02/sta
te-officials-outline-plan-flint-water/73200250
http://www.freep.com/story/news/local/michigan/2015/10/02/sta