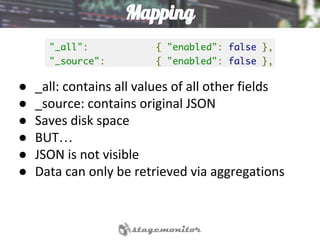
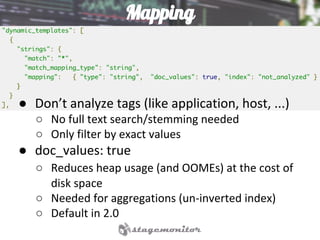
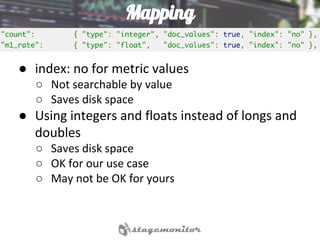
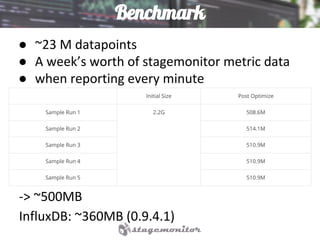
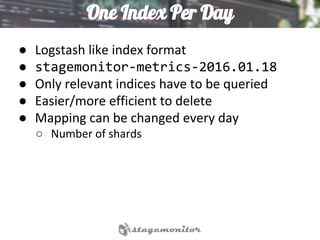
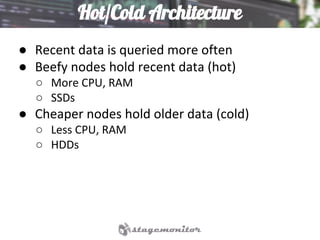
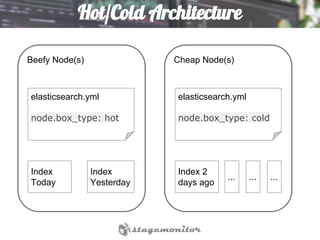
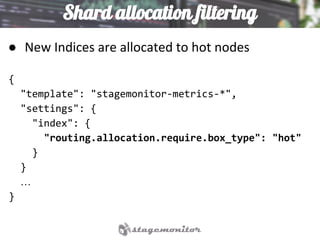
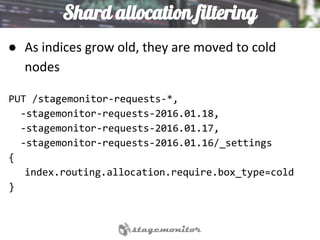
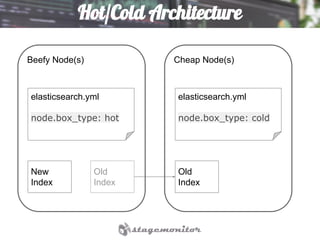
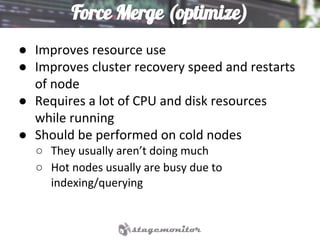
Elasticsearch as a time series
database
Felix Barnsteiner | iSYS Software
Felix Barnsteiner
● Author of the blog “Elasticsearch
as a Time Series Data Store”
● Project Lead stagemonitor
○ Open Source performance
monitoring
● iSYS Software GmbH
○ custom software
○ jstage.de
■ E-Commerce Platform, Consulting
and Services
○ We’re hiring!
Agenda
● Time Series What?
● Why Elasticsearch?
● Data Model
● Elasticsearch Mapping Tuning
● Index Management
Time Series what?
Time
t
Time Series what?
Series
t
Time Series what?
Series
t
Time Series what?
t
CPUUtilisation%
Time Series what?
t
Revenue/minute
Why Elasticsearch?
Decision Process
In search for a new TSDB
● New database for stagemonitor
● Replacing Graphite
○ Installation can be tricky
○ Scaling issues
○ Memory hungry
○ No support for special chars
■ GET /index.html
■ GET_|index:html
● Good things about Graphite
○ Grafana
○ Functions
○ Community/Tools/Collectors
Stagemonitor
● Open Source Java Performance Monitoring
○ Mainly Web Applications
● Monitoring of clustered environments
● For Dev, QA and Ops
In Browser Widget
●
Request Analysis
● Stores Request Traces directly to
Elasticsearch
○ Response Time
○ Status Code
○ Browser/Device/OS/User Agent Type
○ Exceptions
● No Logstash/Log parsing needed
● Kibana dashboard
Metrics
● Response Times
● Real User Monitoring
● JVM
● Operating System
● EhCache
● Logging
● JDBC
TSDB Requirements
● Easy to install
● Scalability
● Variety of functions
○ derivative
○ max/min/std
○ percentiles
○ ...
● Great visualization support
● Maturity
Many Options
● InfluxDB
● OpenTSDB
● Elasticsearch
● KairosDB
● Prometheus
● Druid
Don’t Match Requirements
● OpenTSDB
○ Not easy to install
○ Hadoop and Hbase
● KairosDB
○ Not easy to install
○ Cassandra + KairosDB + Config
● Prometheus
○ No Clustering
● Druid
○ No visualization tool
Easy to install
● InfluxDB
○ rpm, deb, homebrew
● Elasticsearch
○ rpm, deb, download & run
○ Runs anywhere
○ Stagemonitor already requires Elasticsearch
Scaleability
● InfluxDB
○ CERN Presentation*
● Elasticsearch
* http://cds.cern.ch/record/2011172/files/LHCb-TALK-2015-060.pdf
*
Maturity
● InfluxDB
○ Many core changes
○ Clustering in alpha state (max 3 nodes)
○ New Storage Engine in beta
● Elasticsearch
○ Yes!
Functions
● InfluxDB
○ docs.influxdata.com/influxdb/v0.
9/query_language/functions/
● Elasticsearch
○ www.elastic.
co/guide/en/elasticsearch/reference/current/se
arch-aggregations.html
○ Hold-Winters: predictions based on seasonal
patterns
Visualization Support
● InfluxDB
○ Grafana
○ Chronograf
● Elasticsearch
○ Kibana
○ Grafana
○ Timelion
Elasticsearch Benefits
● Large community
● Proven to scale
● Redundancy - replicas
● Backups - snapshot and restore
● Easy to install and manage
● Already needed for stagemonitor
○ Only one instead of two data bases to install
● Marvel uses ES as a TSDB
● CERN says
Stagemonitor Outputs
● Elasticsearch
○ Default
○ Preconfigured Dashboards
● InfluxDB
● Graphite
Data Model
How do Timers work?
● Stagemonitor uses Dropwizard Metrics
● Not one report per request
○ Not scaleable
○ Sampling
● Response times are aggregated in memory
● Stores 1000 representative response times
● Computes metrics like percentiles, min/max,
stdev, throughput/rate
● Reports each 60 seconds (configurable)
metics_store_benchmark.my_hostname.local.timer_1.count 10
metics_store_benchmark.my_hostname.local.timer_1.mean 123
metics_store_benchmark.my_hostname.local.timer_1.min 12
metics_store_benchmark.my_hostname.local.timer_1.max 1234
metics_store_benchmark.my_hostname.local.timer_1.p50 124
…
Doesn’t really fit into Elasticsearch’s data model
How do I filter by a certain host? Regex??
Classic Data Model - Timer
Application Host Instance Name Value
Regex??
Data Model 2.0
● Tags and values
● Self descriptive
● Add tags
(dimensions)
afterwards
○ Without changing
identity
○ Backwards
compatible
Data Model - Timer
● Metric Timer name
○ http_time
○ jdbc_time
Data Model - Timer
● Metric Timer name
○ http_time
○ jdbc_time
Data Model - Timer
● Global tags
○ Application
○ Host
○ Instance
○ Region
○ Datacenter
○ Availability Zone
○ ...
Data Model - Timer
● Metrics
○ mean/min/max
○ percentiles
○ throughput, count
Elasticsearch Mapping Tuning
Mapping Template
Mapping
● _all: contains all values of all other fields
● _source: contains original JSON
● Saves disk space
● BUT…
● JSON is not visible
● Data can only be retrieved via aggregations
Mapping
● Don’t analyze tags (like application, host, ...)
○ No full text search/stemming needed
○ Only filter by exact values
● doc_values: true
○ Reduces heap usage (and OOMEs) at the cost of
disk space
○ Needed for aggregations (un-inverted index)
○ Default in 2.0
Mapping
● index: no for metric values
○ Not searchable by value
○ Saves disk space
● Using integers and floats instead of longs and
doubles
○ Saves disk space
○ OK for our use case
○ May not be OK for yours
Benchmark
● ~23 M datapoints
● A week’s worth of stagemonitor metric data
● when reporting every minute
-> ~500MB
InfluxDB: ~360MB (0.9.4.1)
Index Management
One Index Per Day
● Logstash like index format
● stagemonitor-metrics-2016.01.18
● Only relevant indices have to be queried
● Easier/more efficient to delete
● Mapping can be changed every day
○ Number of shards
Hot/Cold Architecture
● Recent data is queried more often
● Beefy nodes hold recent data (hot)
○ More CPU, RAM
○ SSDs
● Cheaper nodes hold older data (cold)
○ Less CPU, RAM
○ HDDs
Hot/Cold Architecture
Beefy Node(s) Cheap Node(s)
elasticsearch.yml
node.box_type: hot
elasticsearch.yml
node.box_type: cold
Index
Today
Index
Yesterday
Index 2
days ago
... ... ...
Shard allocation filtering
● New Indices are allocated to hot nodes
{
"template": "stagemonitor-metrics-*",
"settings": {
"index": {
"routing.allocation.require.box_type": "hot"
}
}
…
}
Shard allocation filtering
● As indices grow old, they are moved to cold
nodes
PUT /stagemonitor-requests-*,
-stagemonitor-requests-2016.01.18,
-stagemonitor-requests-2016.01.17,
-stagemonitor-requests-2016.01.16/_settings
{
index.routing.allocation.require.box_type=cold
}
Hot/Cold Architecture
Beefy Node(s) Cheap Node(s)
elasticsearch.yml
node.box_type: hot
elasticsearch.yml
node.box_type: cold
New
Index
Old
Index
Old
Index
Force Merge (optimize)
● Improves resource use
● Improves cluster recovery speed and restarts
of node
● Requires a lot of CPU and disk resources
while running
● Should be performed on cold nodes
○ They usually aren’t doing much
○ Hot nodes usually are busy due to
indexing/querying
Deleting indices
● Limit storage requirements
● Only keep metrics for one year
Lifecycle
New Old
Very
Old
Cheap Node
Optimize
Beefy Node Delete
Archive
Tools
● Curator
○ Command line tool by Elastic
○ Execute 3 jobs as cron
● Stagemonitor
○ Automatically handled
○ How many days on hot nodes
○ Configurable delete delay
Questions?
Blog: elastic.co/blog/elasticsearch-as-a-time-
series-data-store
Stagemonitor: stagemonitor.org
Twitter: @felix_b, @stagemonitor
@felix_b

Elasticsearch as a time series database