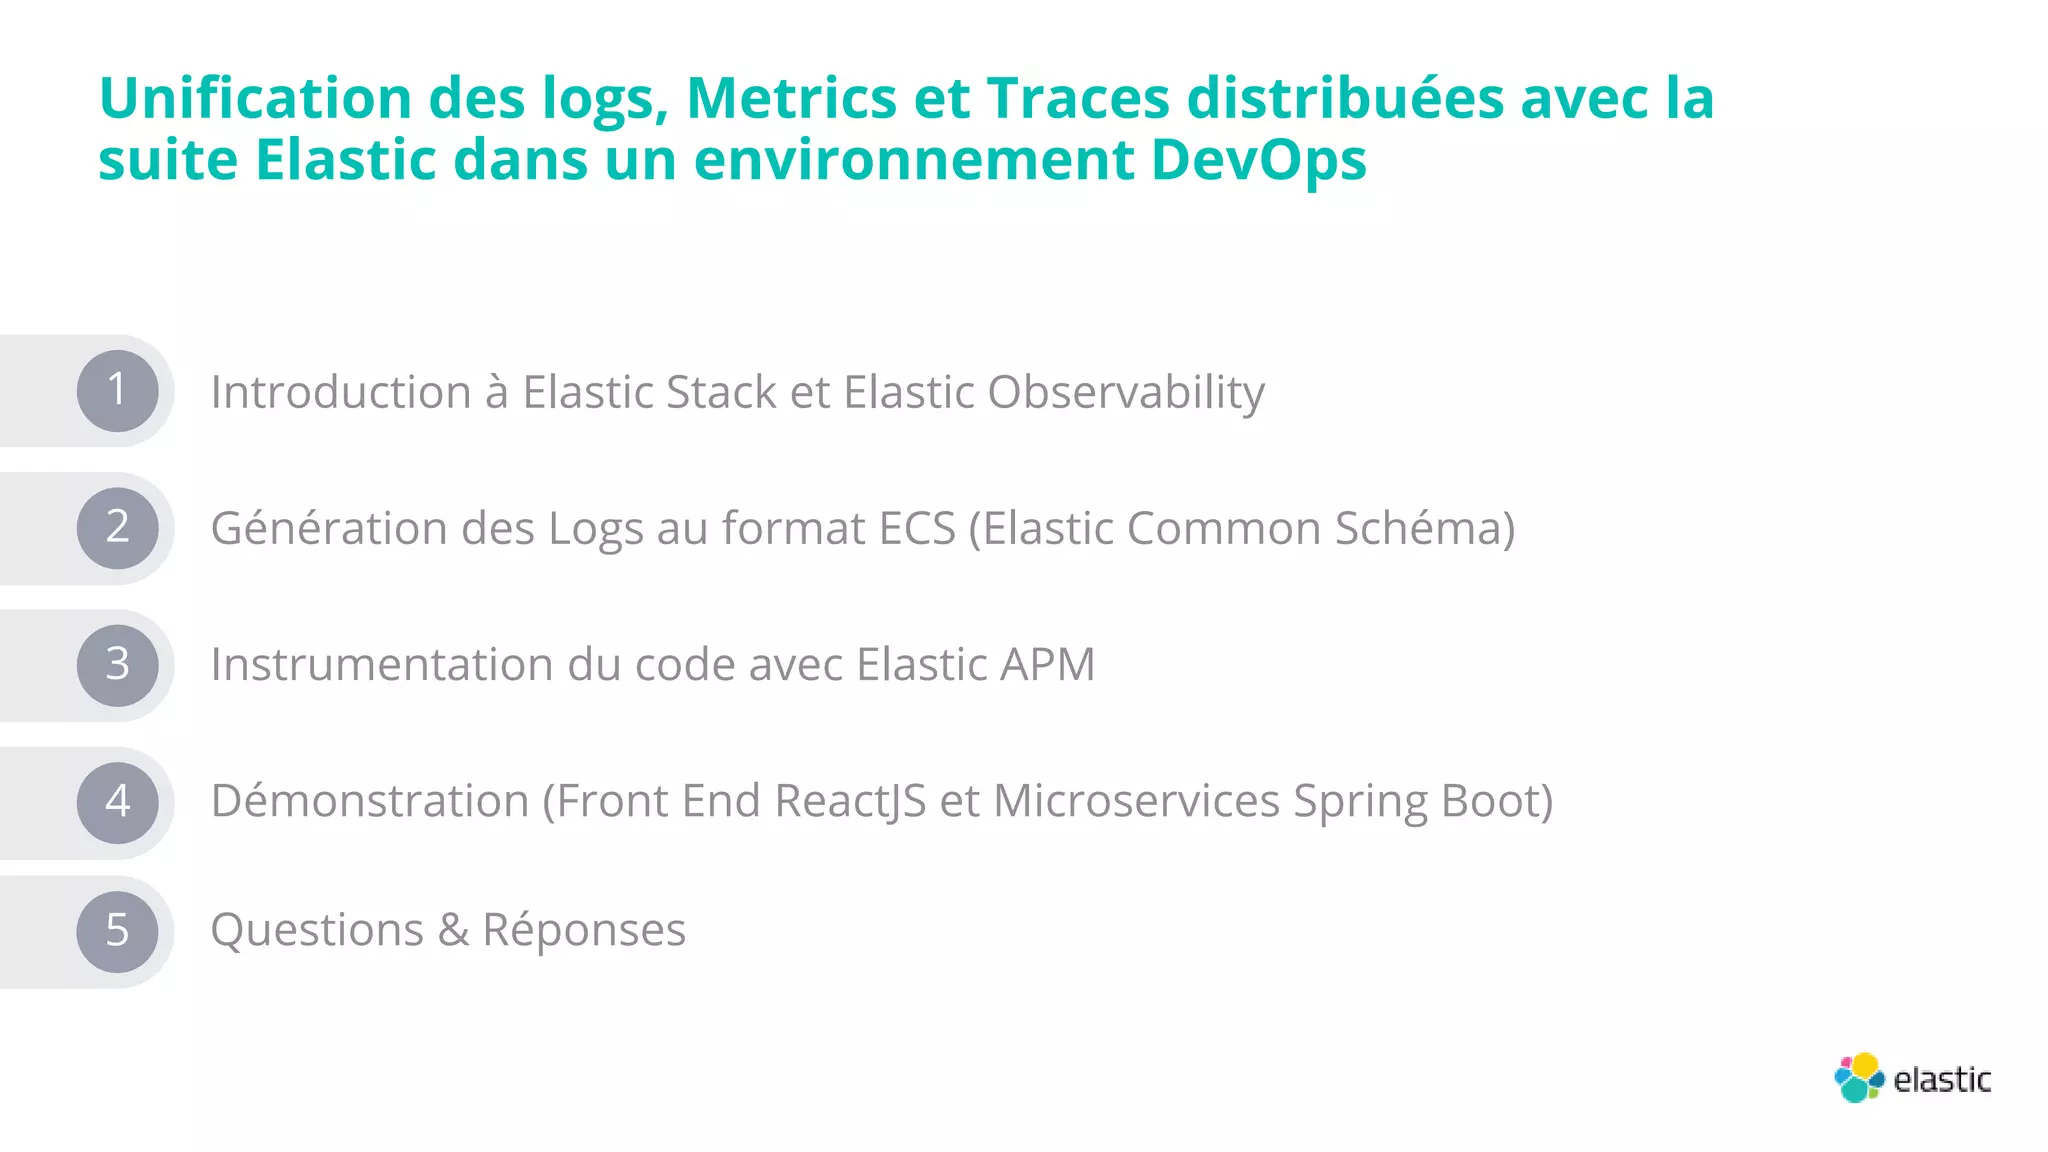
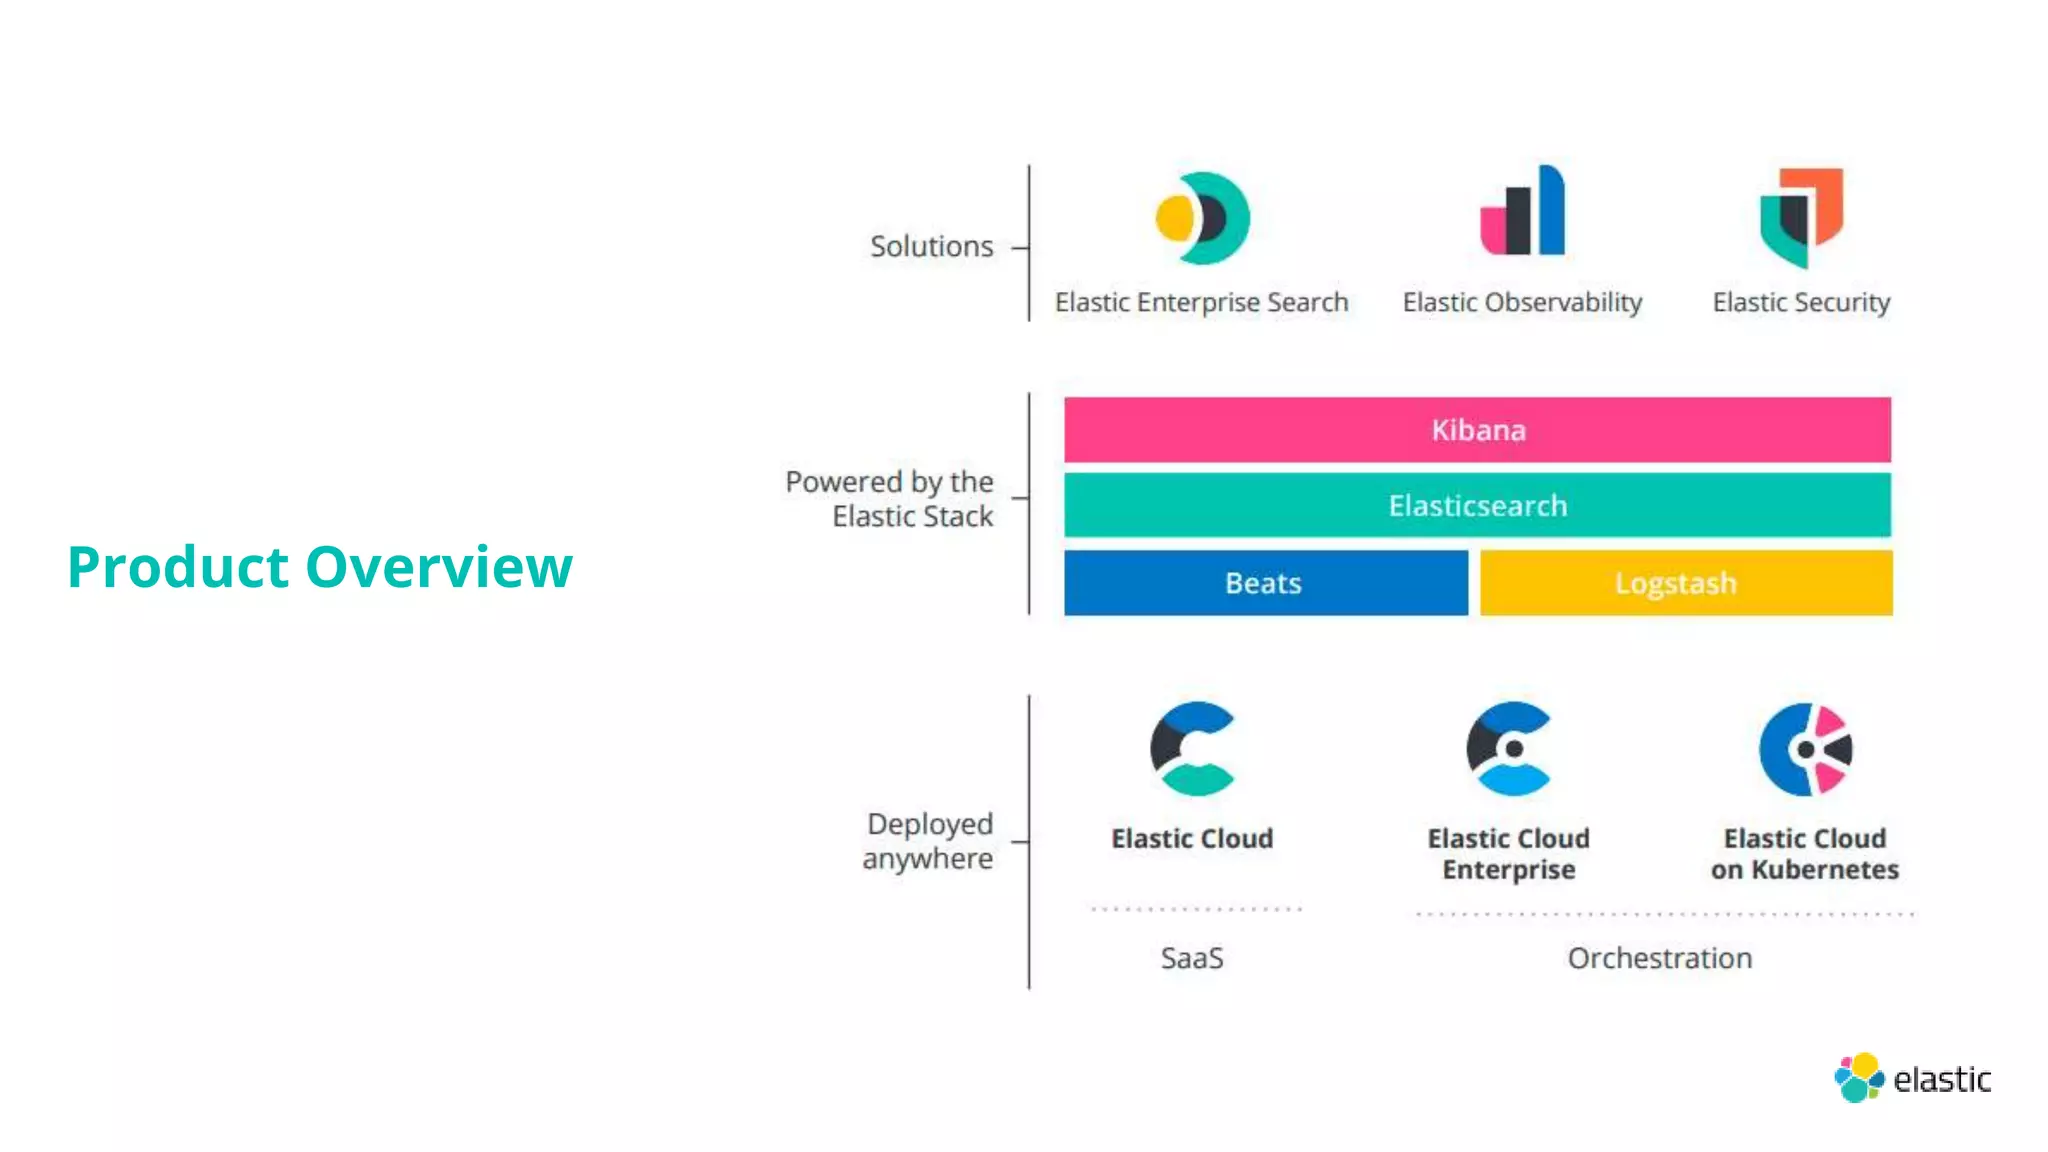
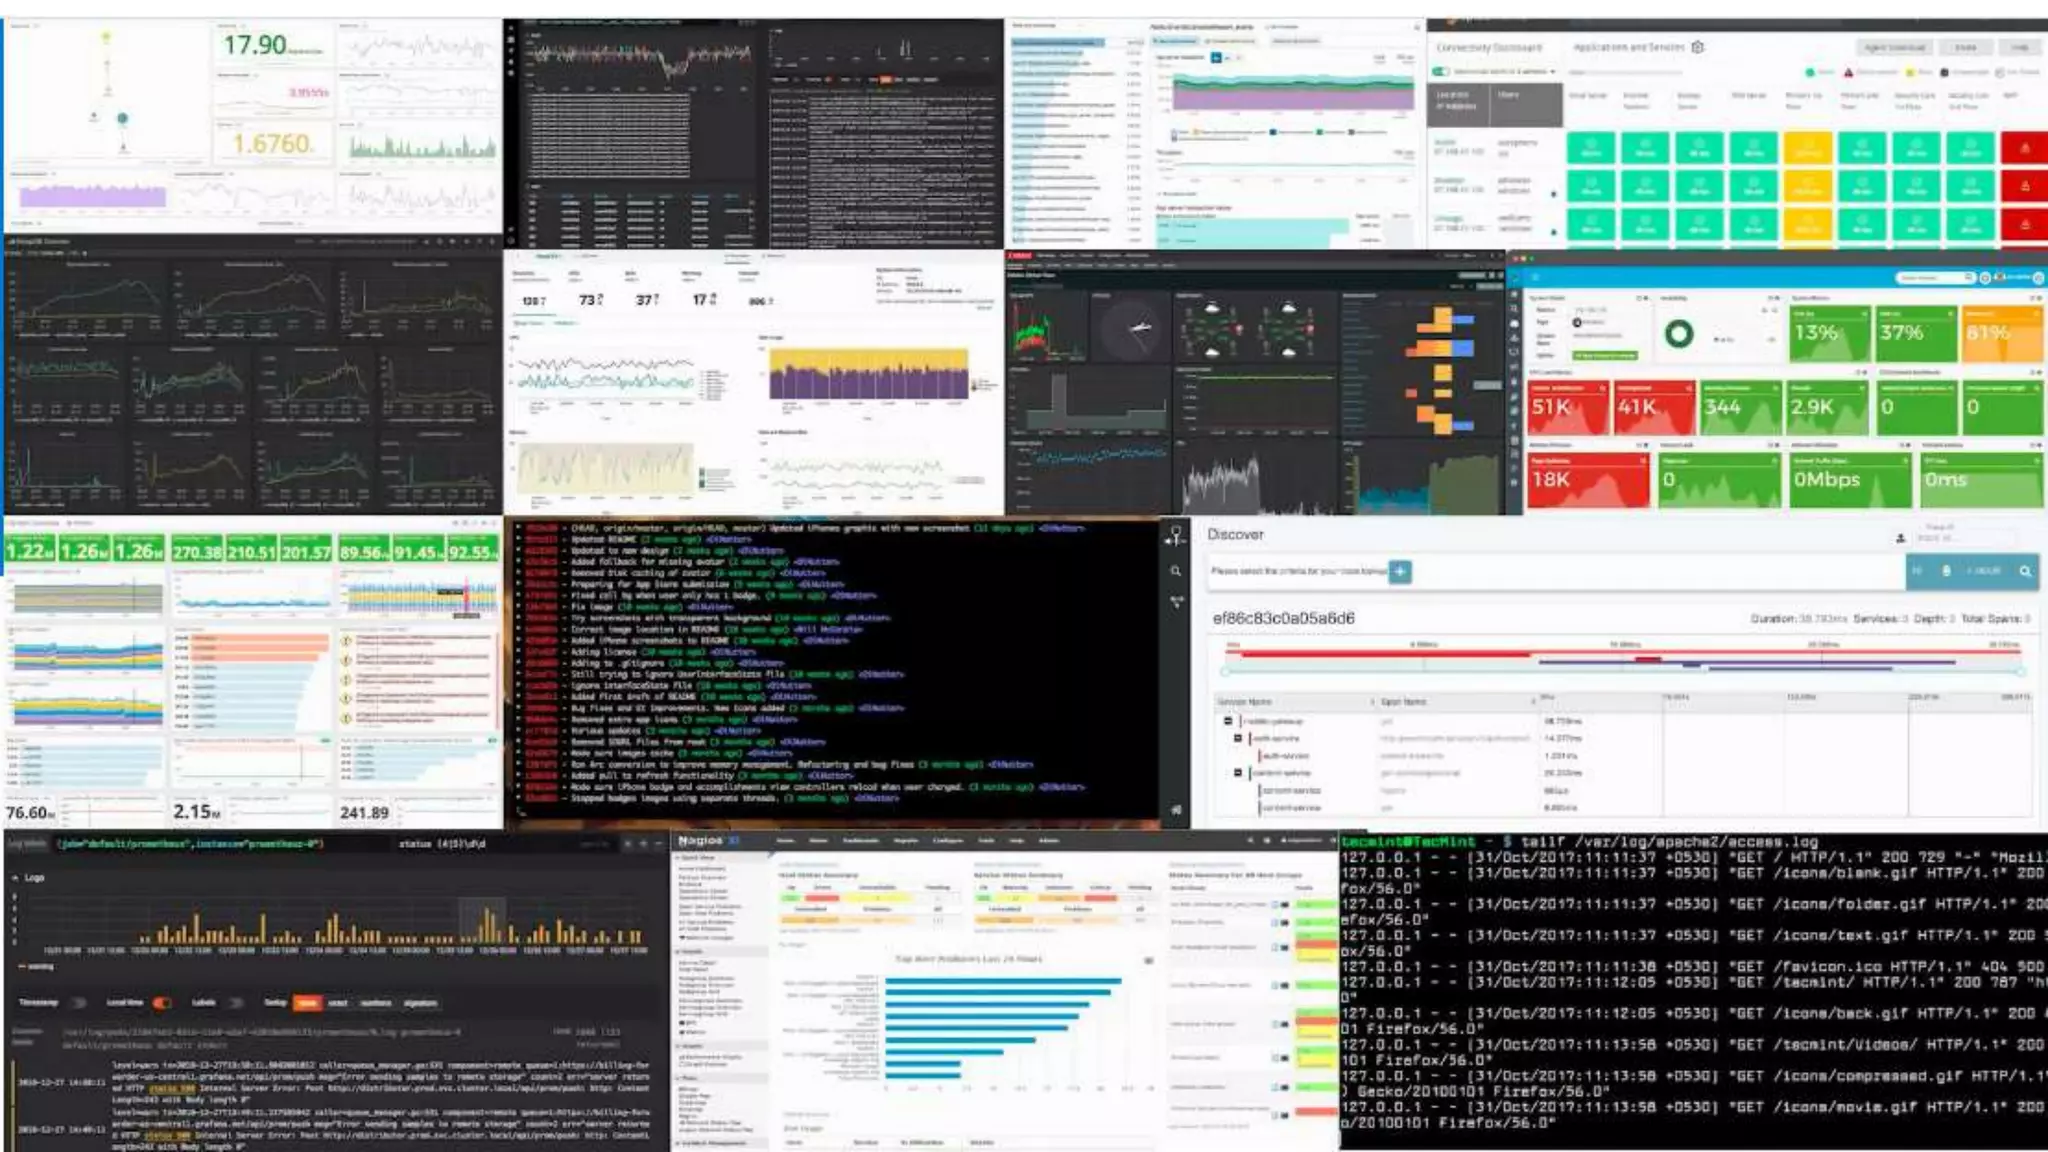
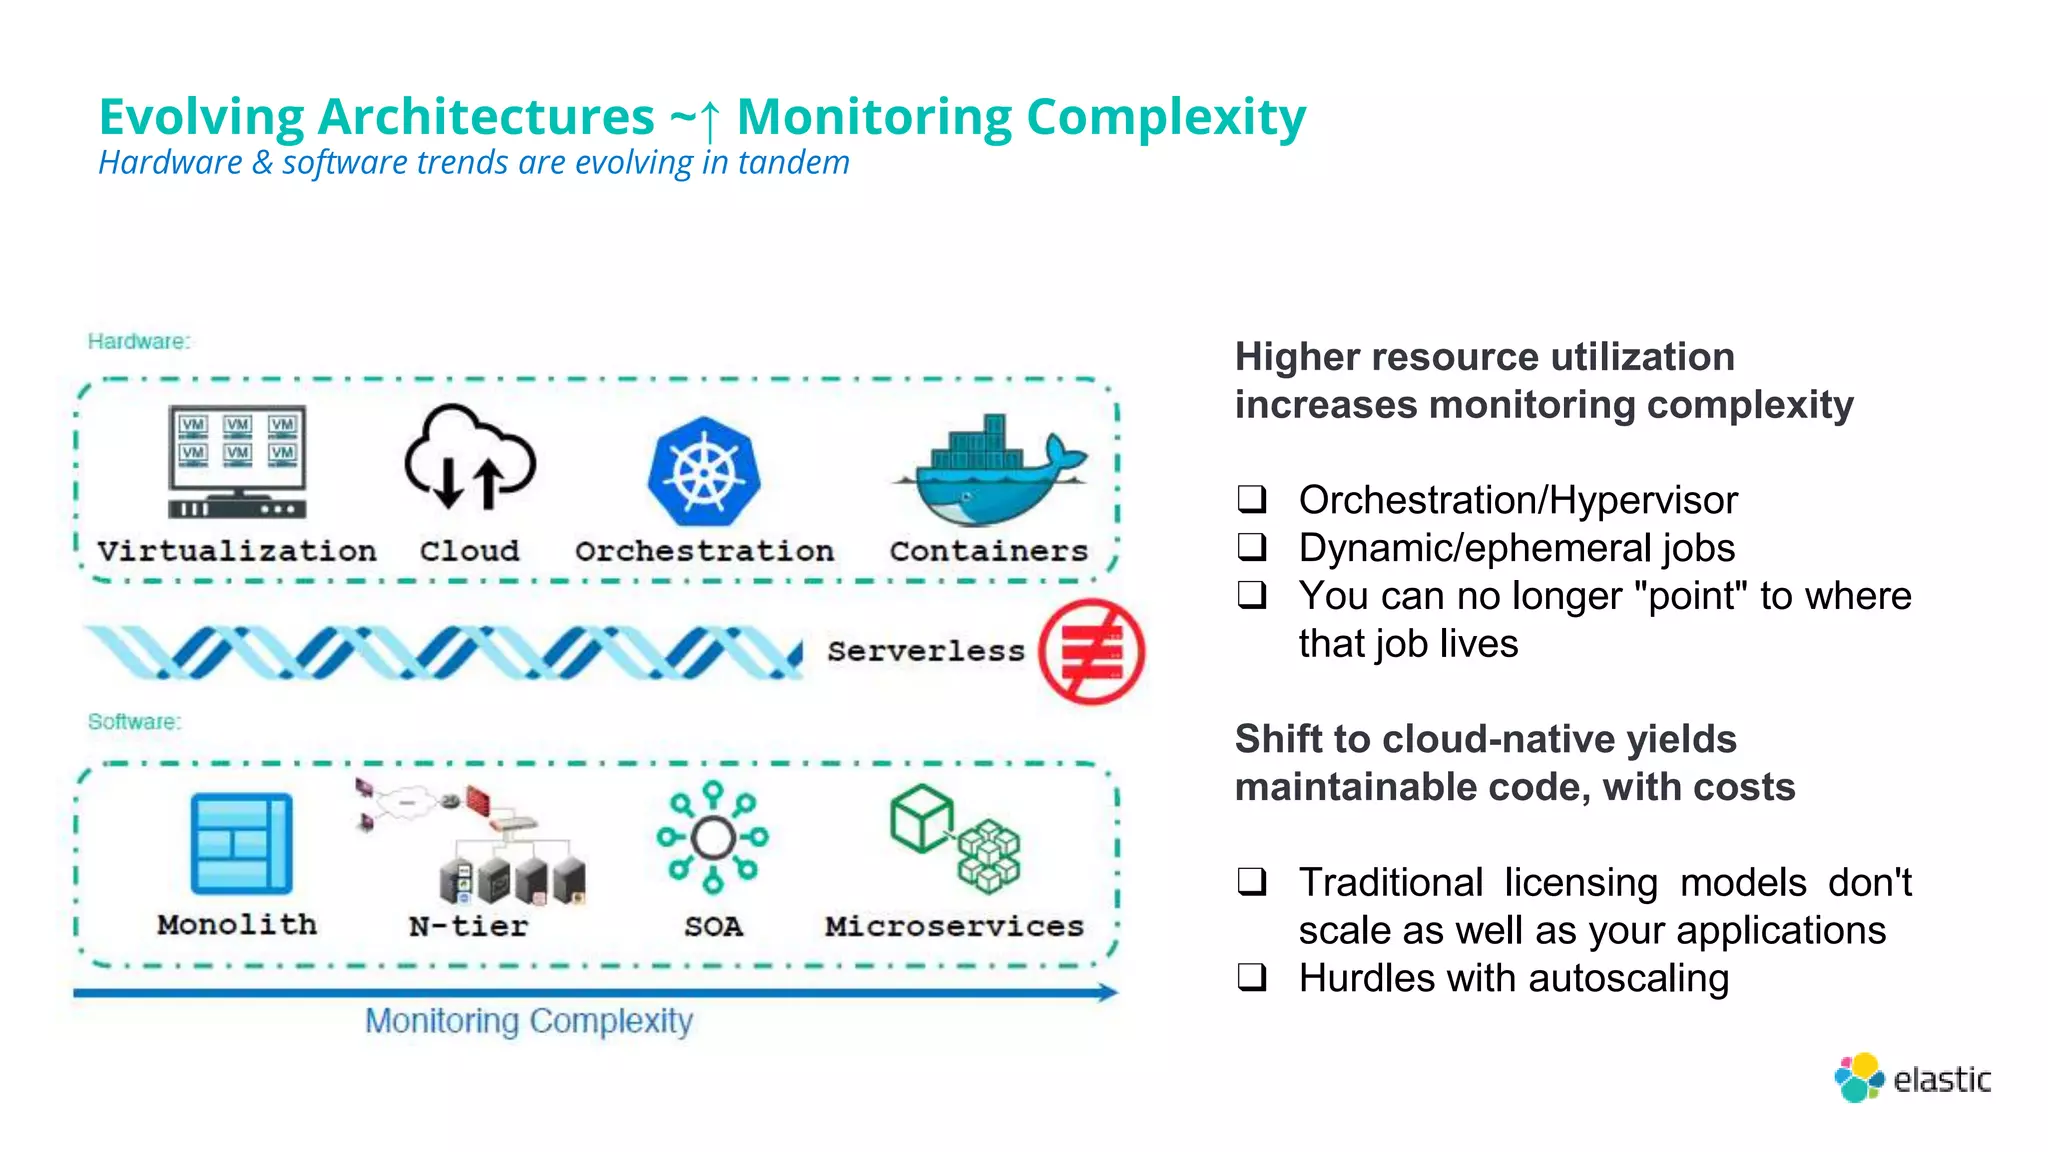
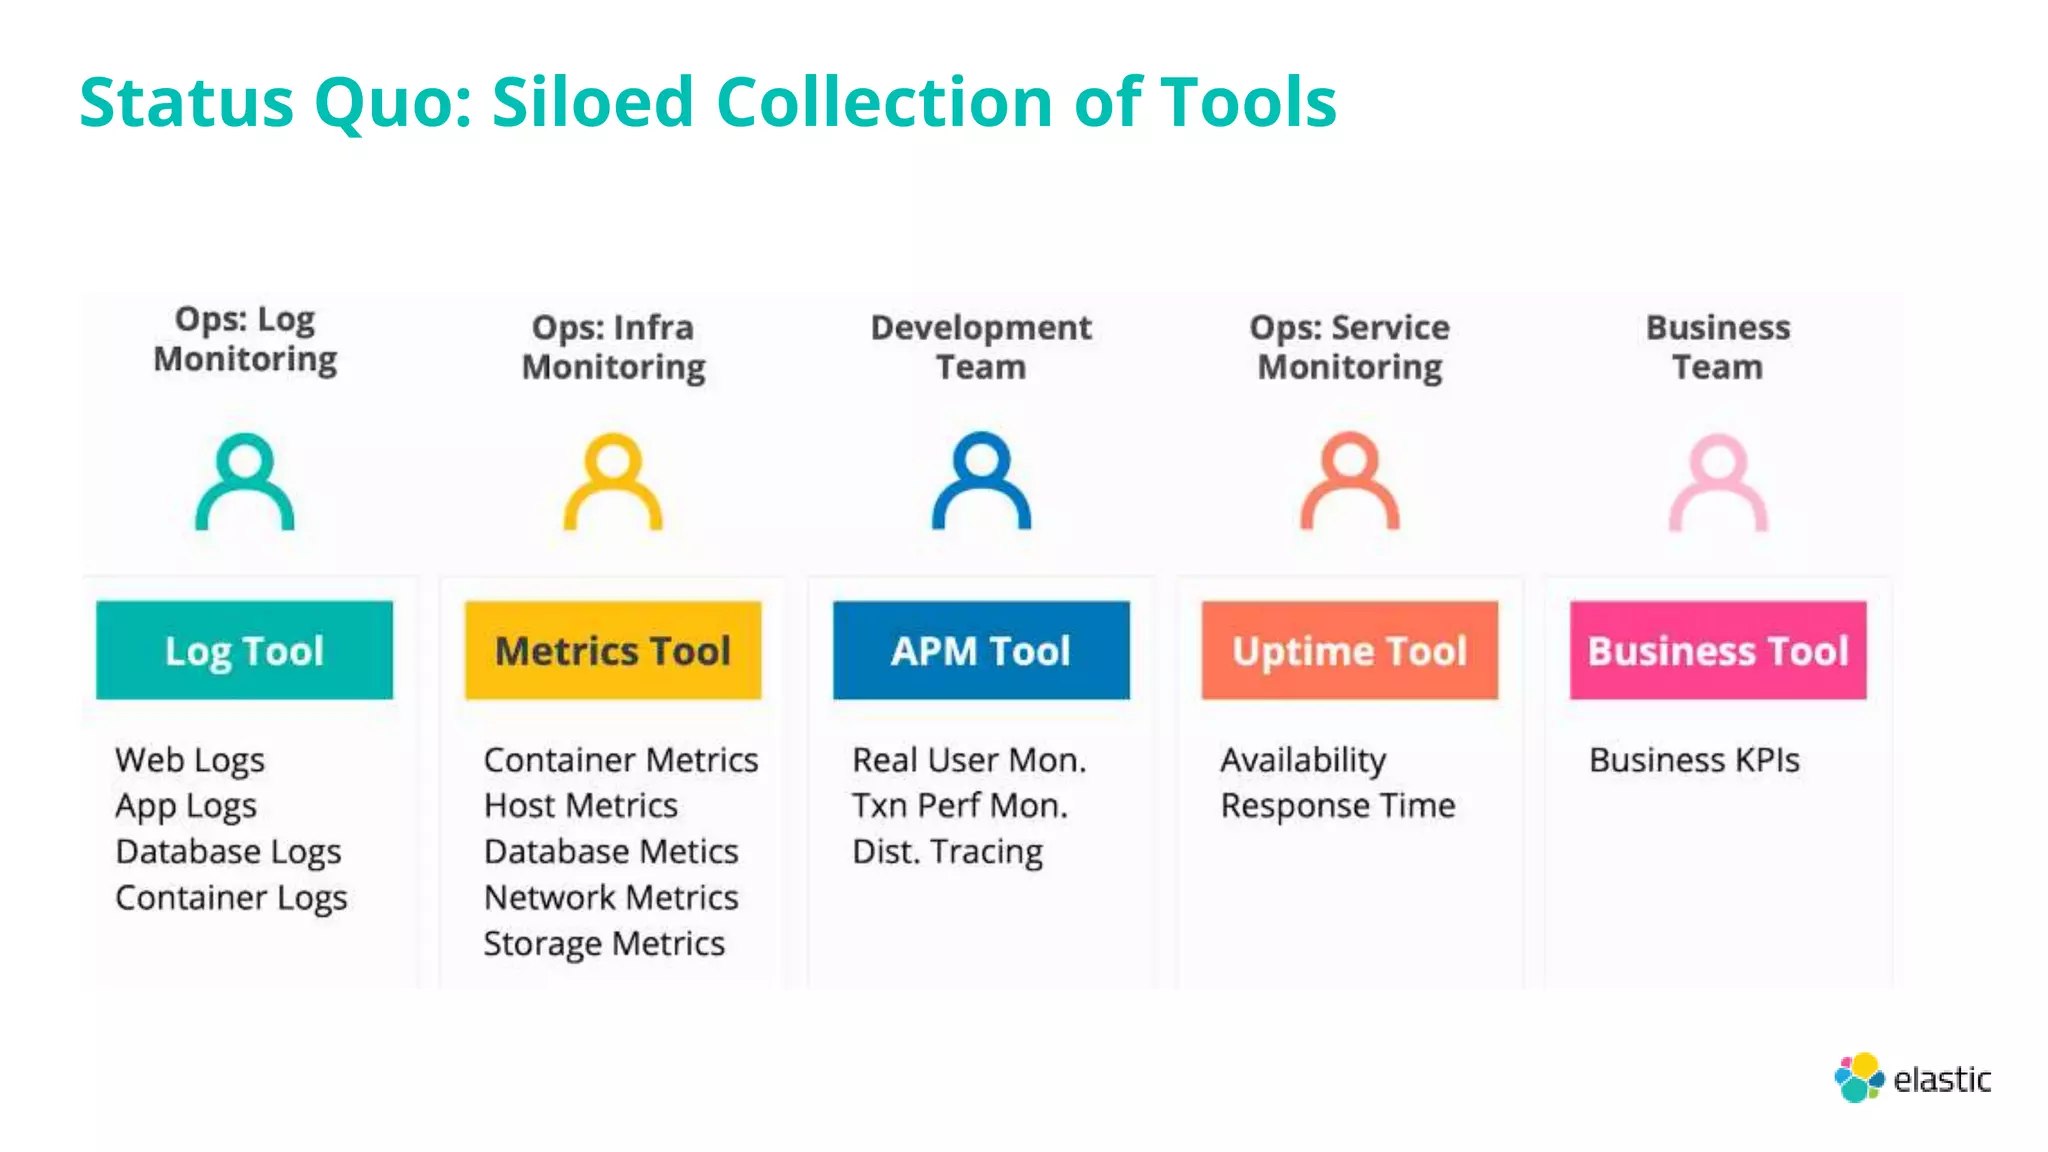
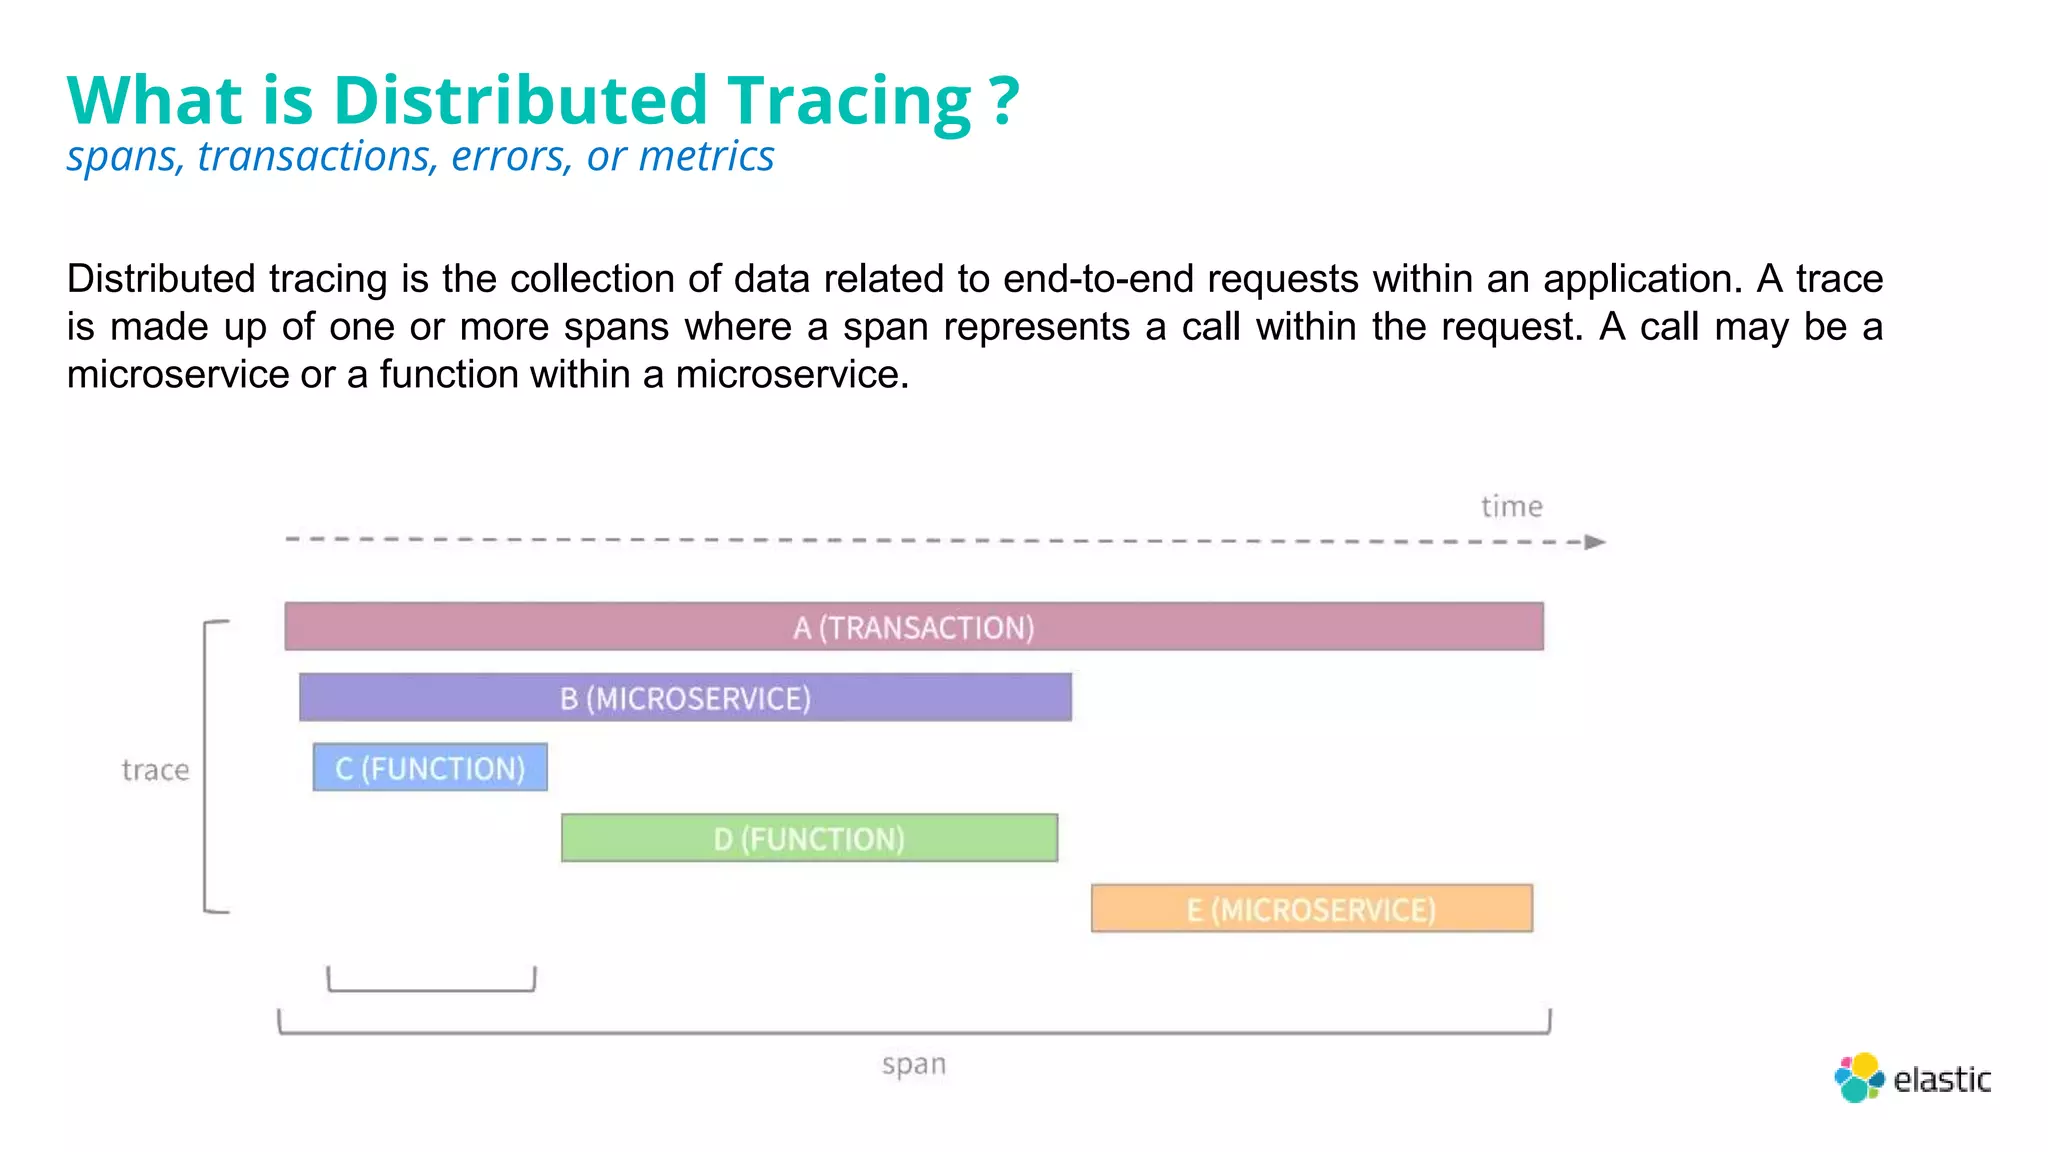
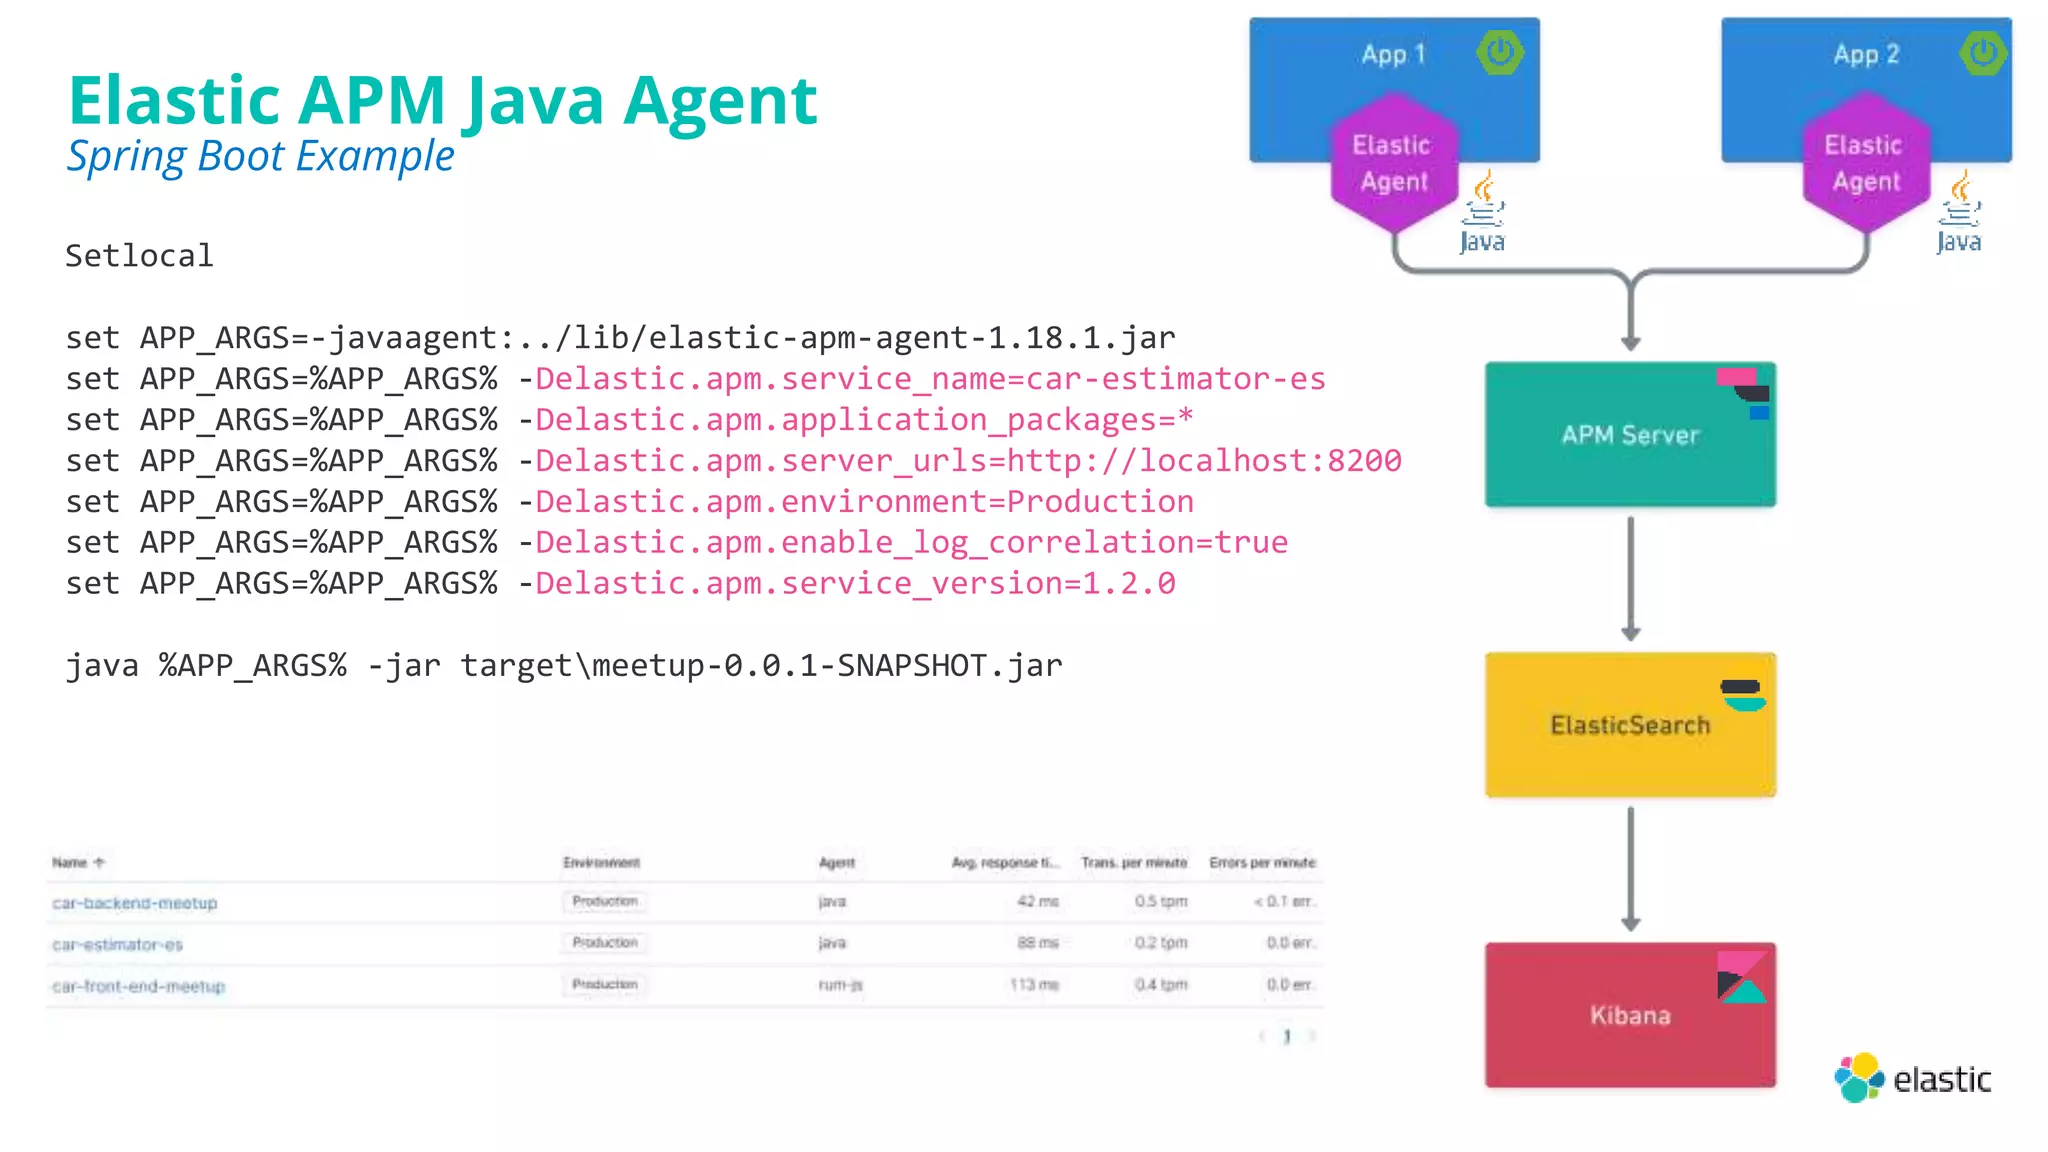
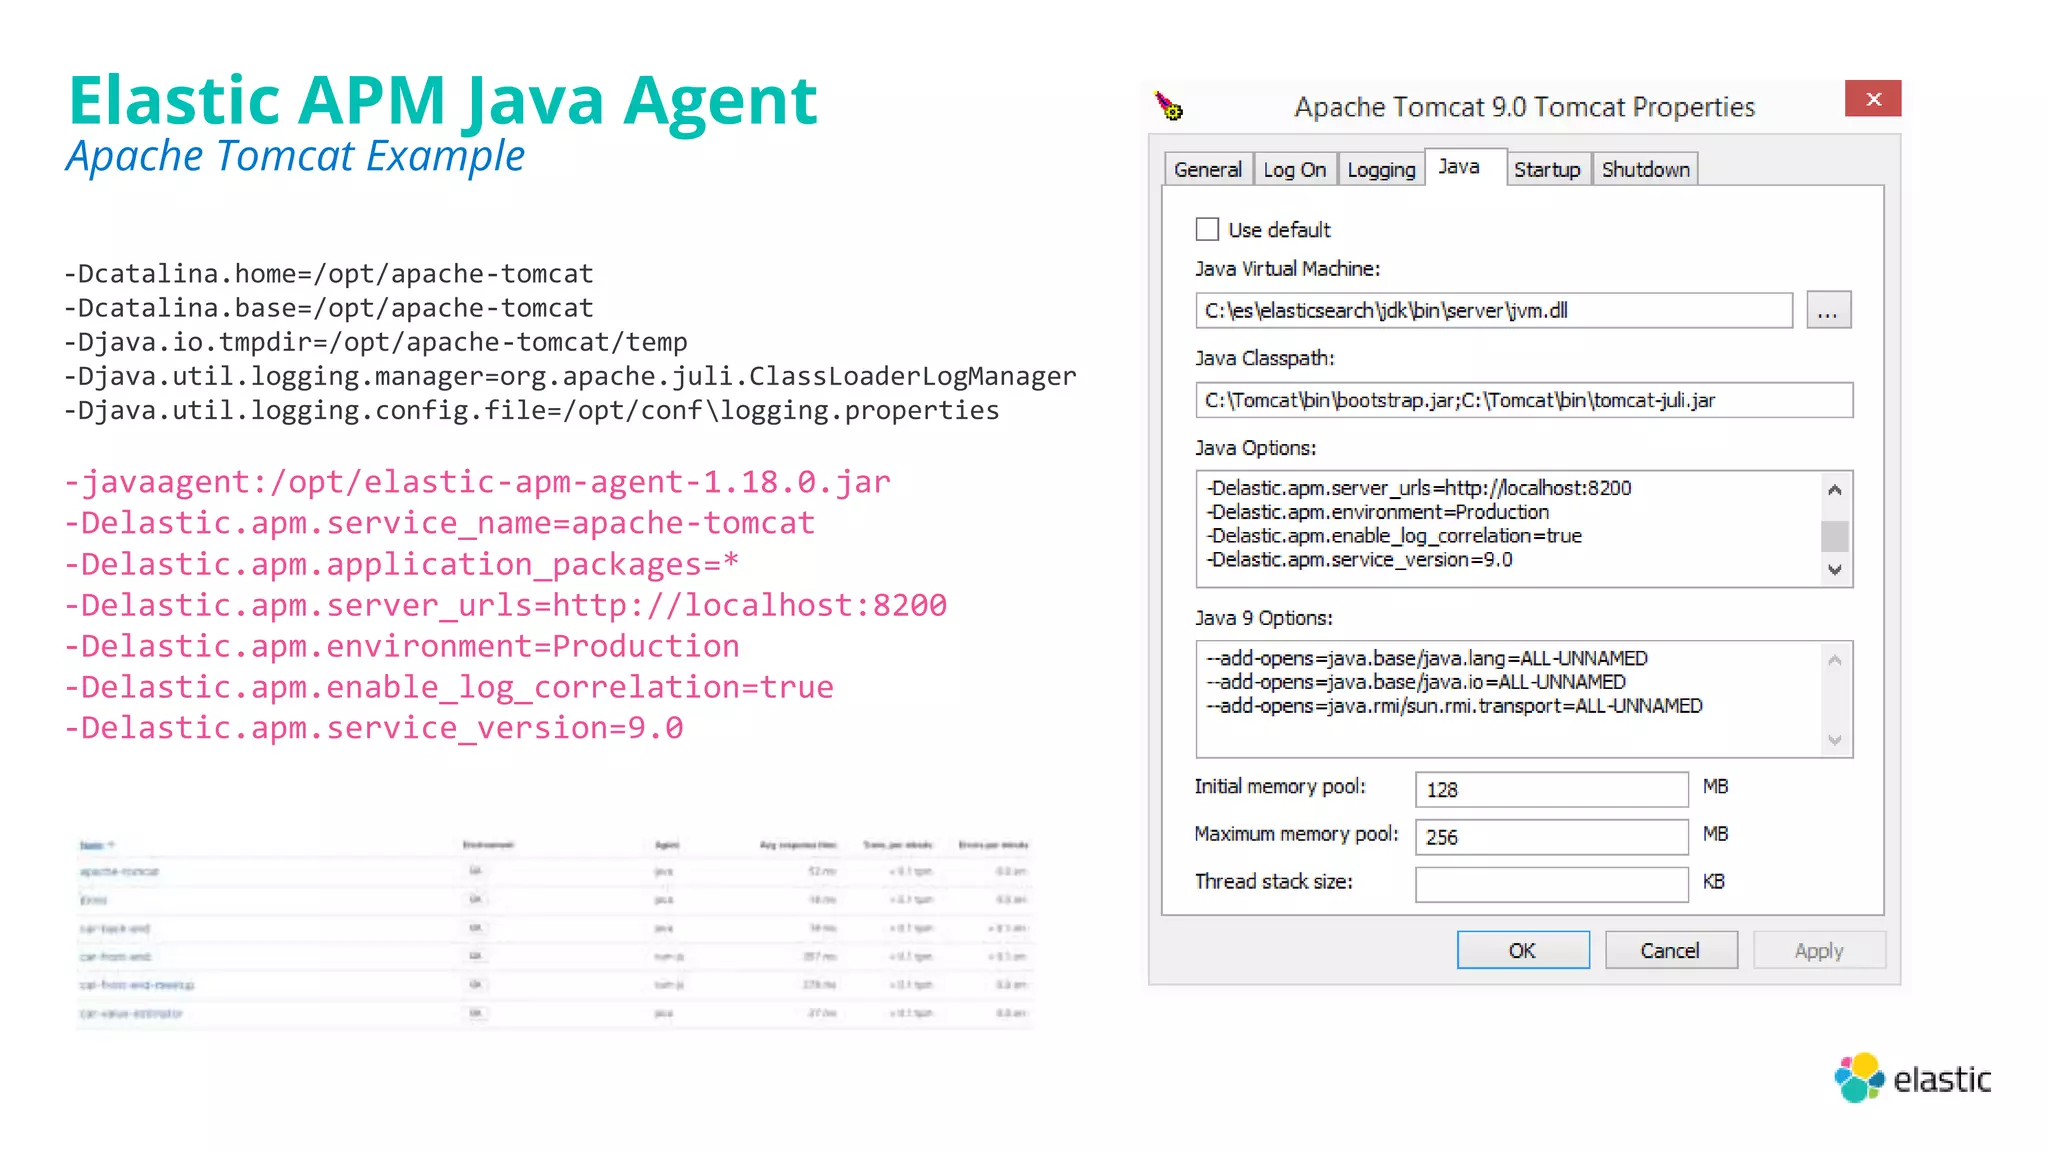
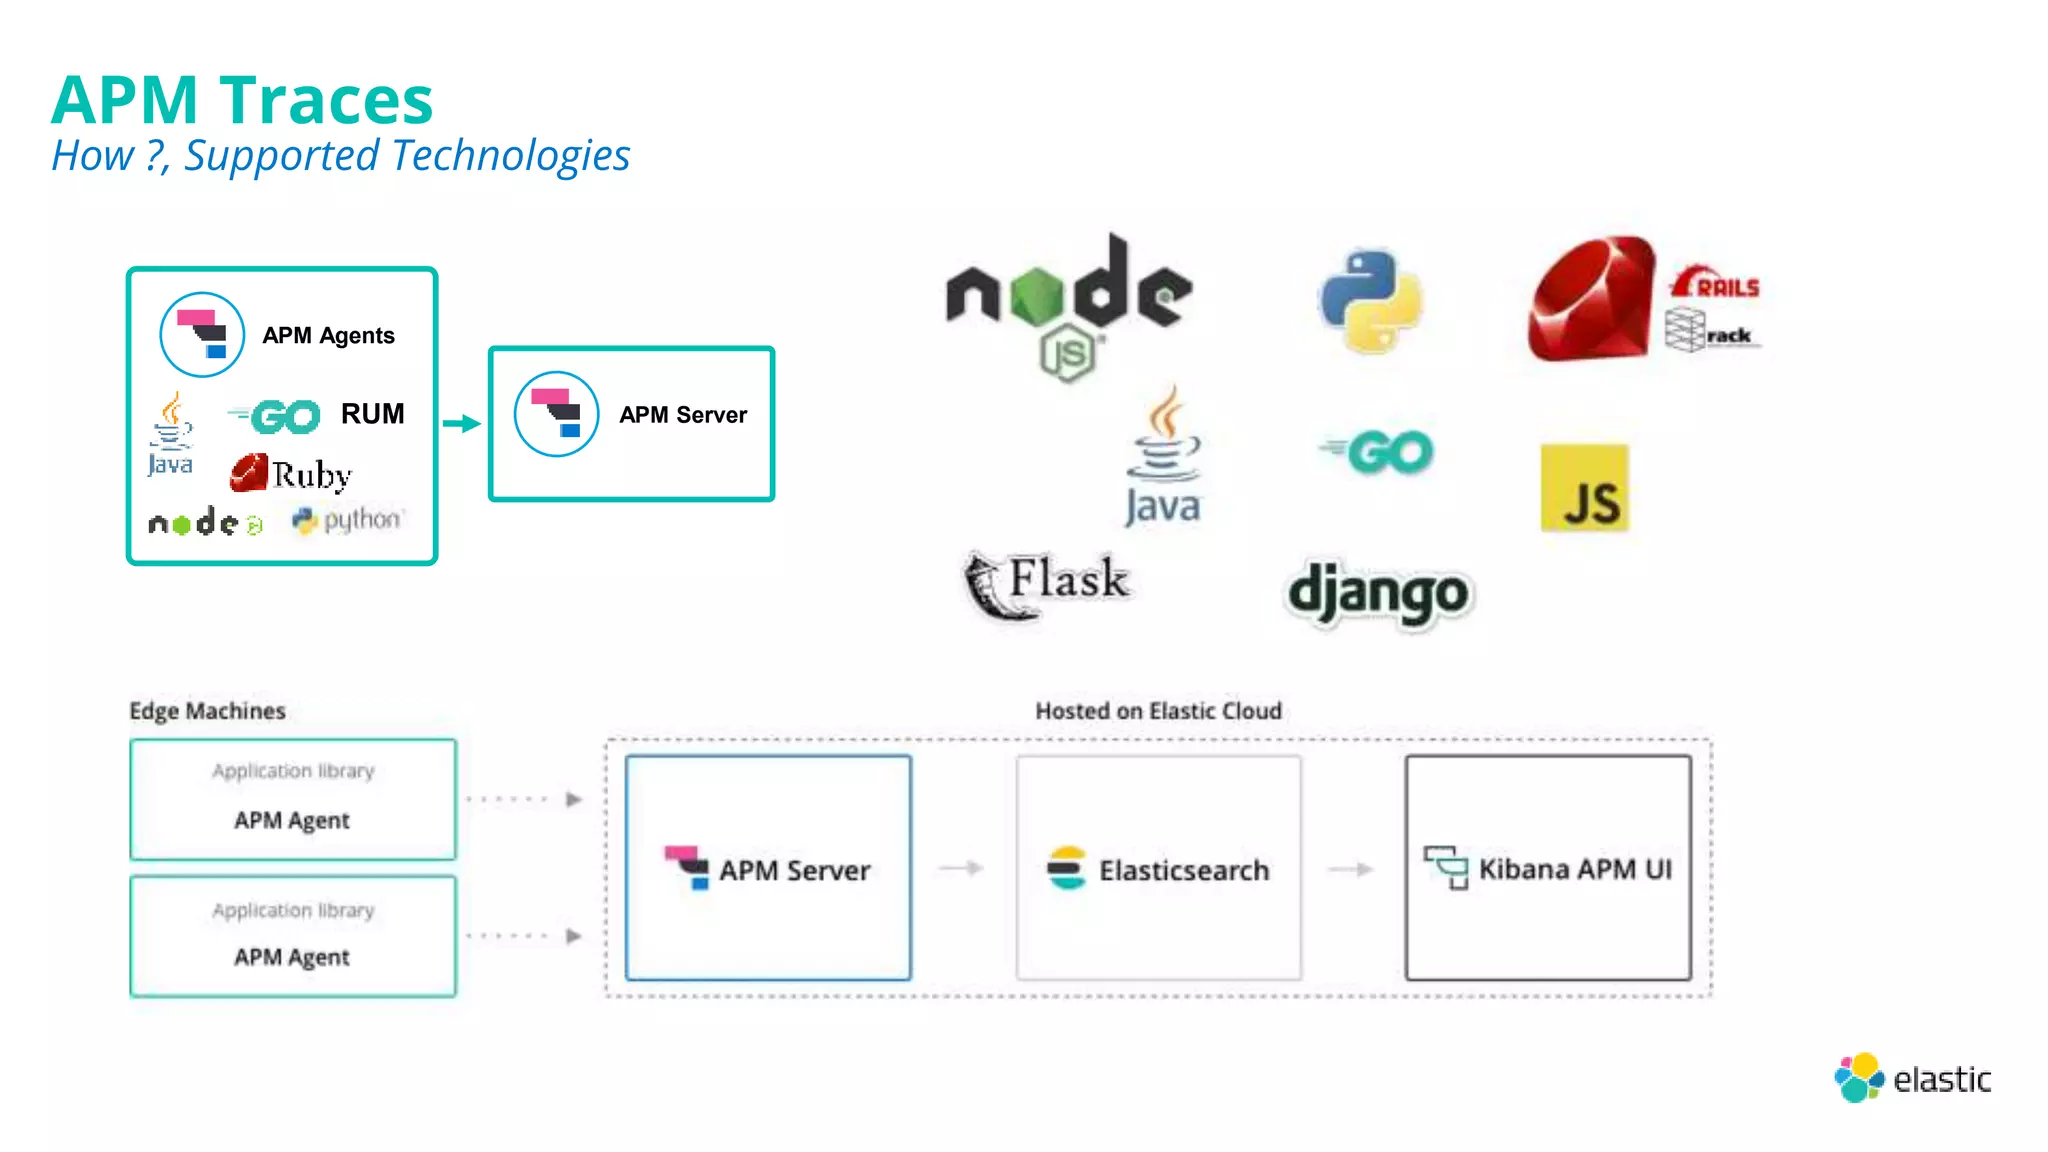
This document summarizes a presentation on unifying logs, metrics, and distributed traces with the Elastic suite in a DevOps environment. The presentation introduces Elastic Stack and Elastic Observability, demonstrates log generation in the ECS format, and instrumenting code with Elastic APM using a React and Spring Boot demo. It also discusses the Elastic Contributor Program and provides examples of configuring the Elastic APM and RUM agents.
![2019-03-05 10:57:51.253 INFO 45469 --- [ost-startStop-1] o.s.web.context.ContextLoader
: Root WebApplicationContext: initialization completed in 1358 ms
2019-03-05 10:57:51.702 INFO 45469 --- [ost-startStop-1]
o.s.b.c.embedded.FilterRegistrationBean : Mapping filter: 'hiddenHttpMethodFilter' to: [/*]
2020-10-28 11:03:27.265 DEBUG 11672 --- [nio-8082-exec-1] c.b.e.d.MarketEstimate : message
2020-04-07 20:20:33.679 ERROR 41436 --- [ restartedMain] o.s.boot.SpringApplication :
Application run failed
....
... 22 common frames omitted
Caused by: java.lang.NoClassDefFoundError: ProducerFactory
...
... 38 common frames omitted
Caused by: java.lang.ClassNotFoundException: ProducerFactory
....
... 42 common frames omitted
Logging in Spring Boot
Logs parsing & Ingest](https://image.slidesharecdn.com/elasticmoroccousergroup-meetup05-201109141341/75/Elastic-Morocco-Meetup-Nov-2020-11-2048.jpg)
![2020-10-28 11:03:27.265 DEBUG 11672 --- [nio-8082-exec-1] c.b.e.d.MarketEstimate : message
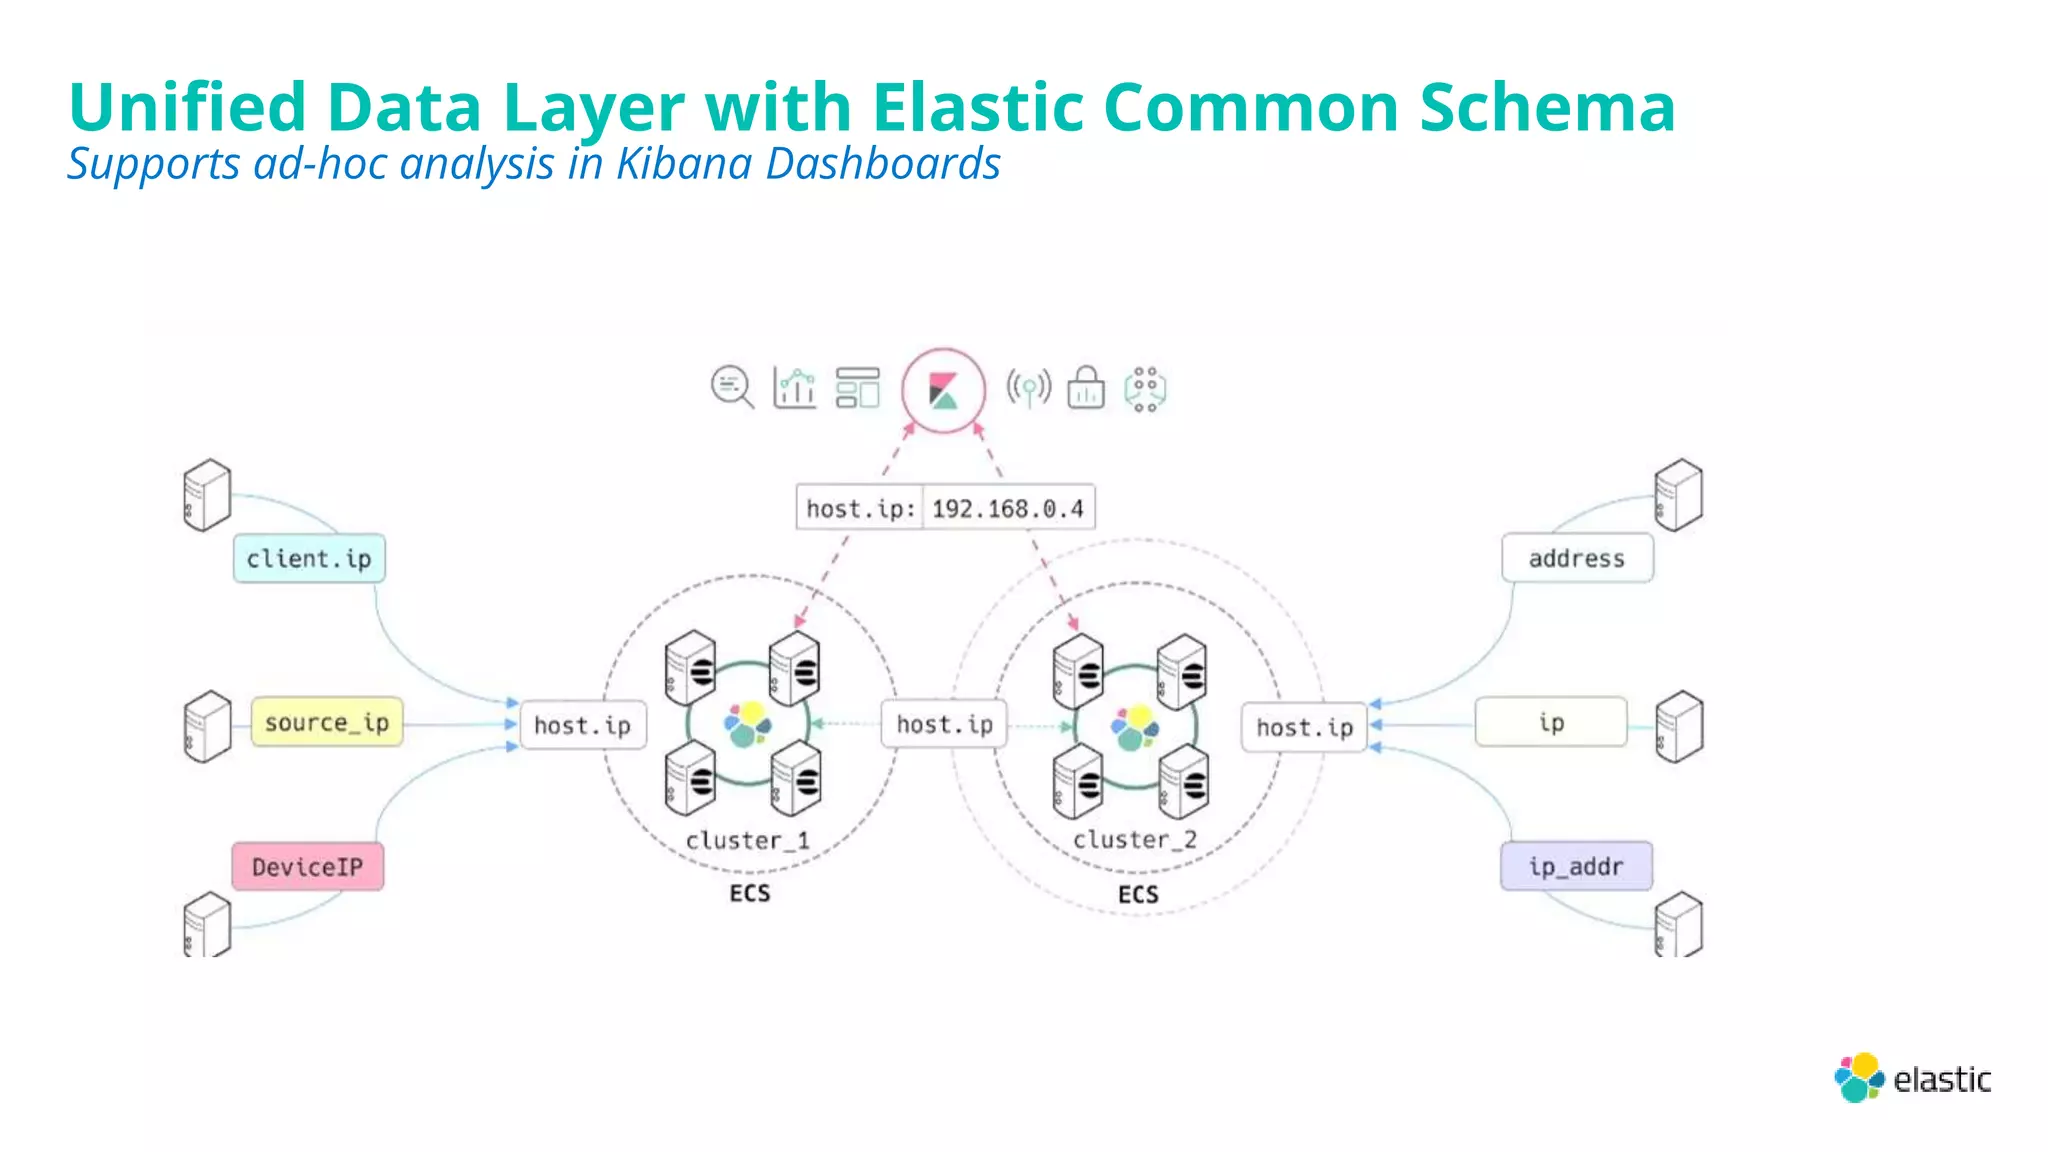
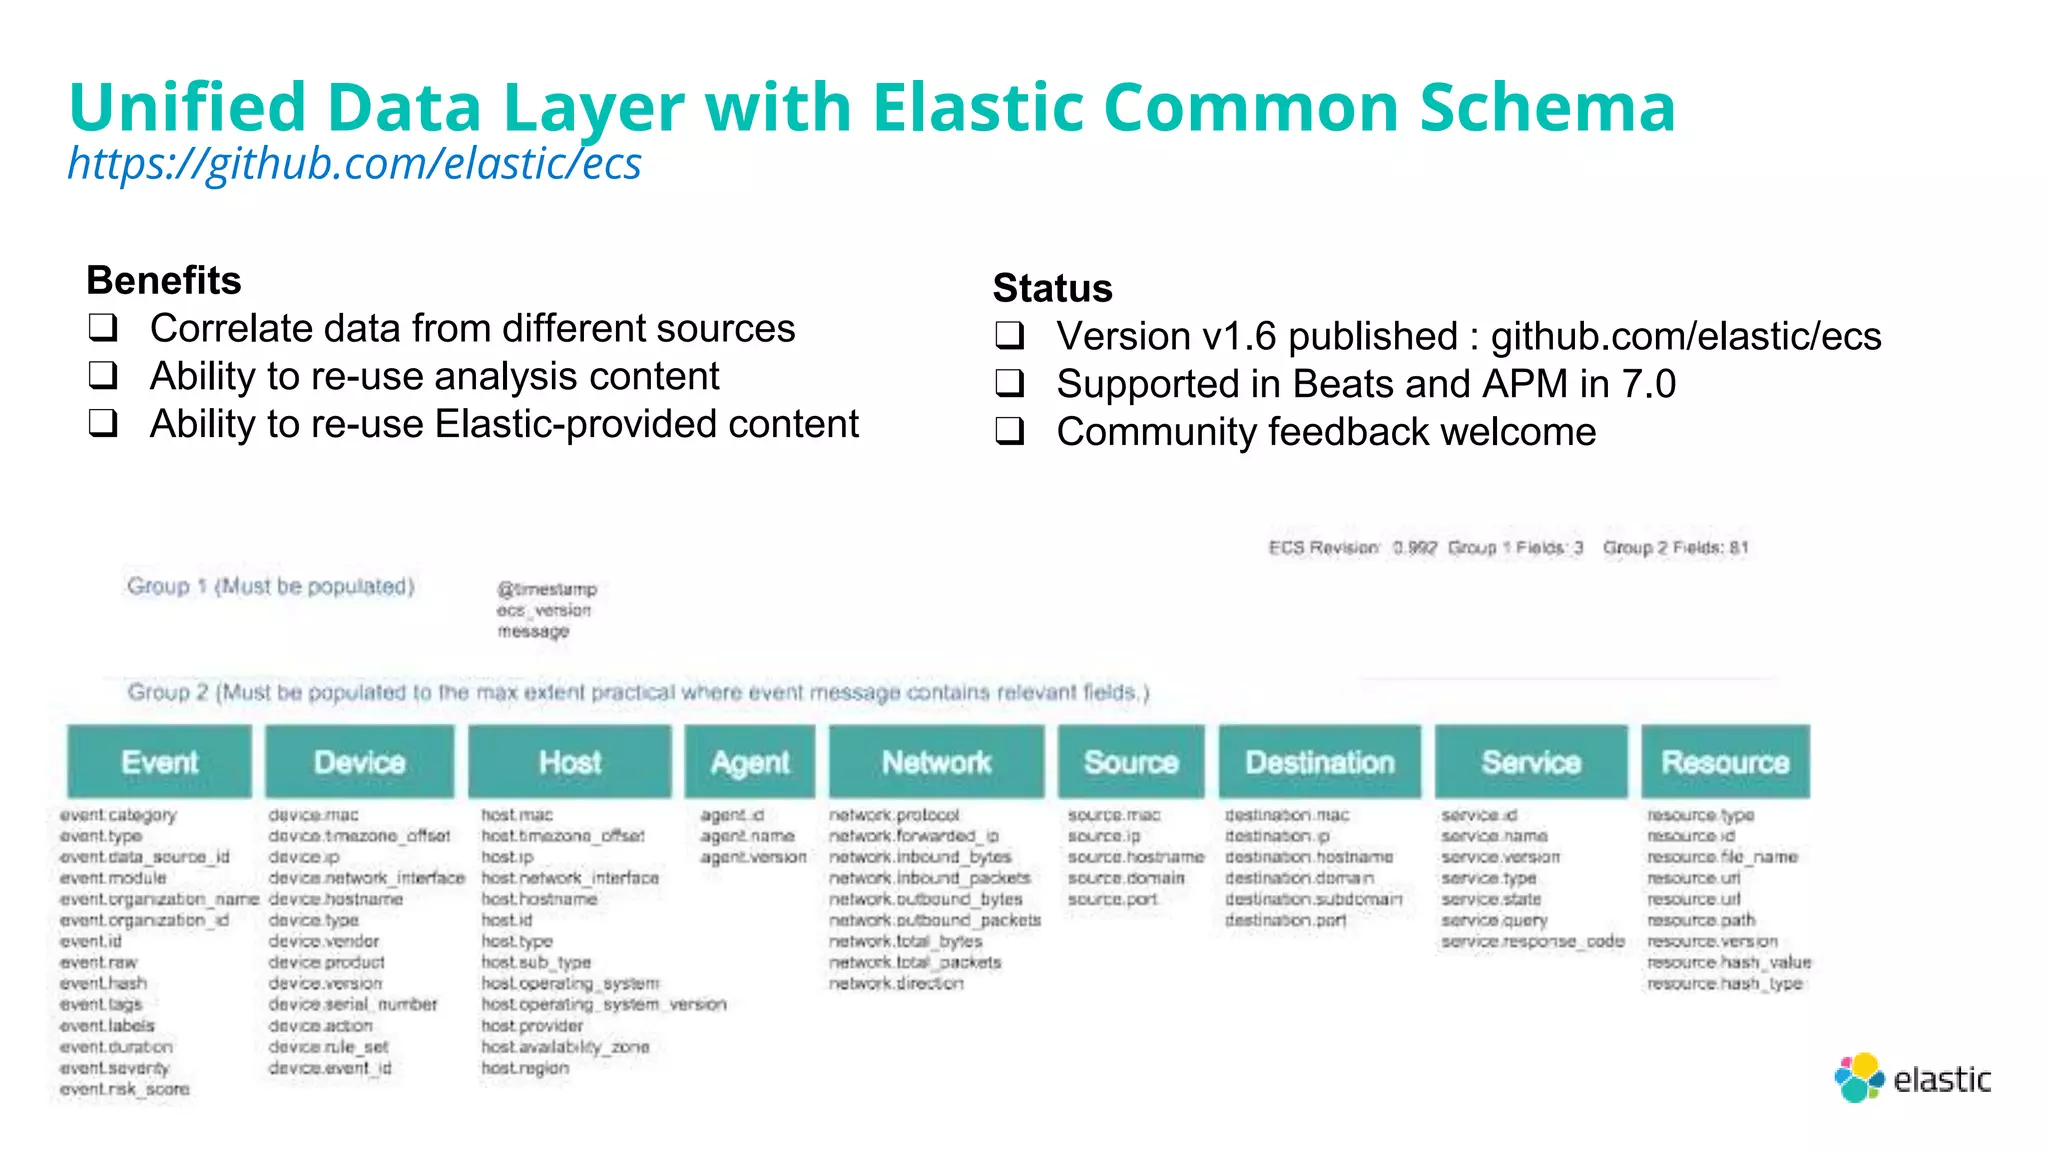
ECS-based logging for Java applications
https://github.com/elastic/ecs-logging-java](https://image.slidesharecdn.com/elasticmoroccousergroup-meetup05-201109141341/75/Elastic-Morocco-Meetup-Nov-2020-12-2048.jpg)
![<script src="https://unpkg.com/@elastic/apm-rum@4.0.1/dist/bundles/elastic-apm-rum.umd.min.js">
</script>
<script>
elasticApm.init({
serviceName: 'front-end',
serverUrl: 'http://localhost:8200',
serviceVersion: '1.2.0‘,
distributedTracingOrigins: ['http://localhost:8080'],
environment: 'Production'
})
</script>
Elastic RUM Agent
HTML Configuration Example](https://image.slidesharecdn.com/elasticmoroccousergroup-meetup05-201109141341/75/Elastic-Morocco-Meetup-Nov-2020-18-2048.jpg)
![npm install @elastic/apm-rum --save
import { init as initApm } from '@elastic/apm-rum'
var apm = initApm({
// Set required service name (allowed characters: a-z, A-Z, 0-9, -, _, and space)
serviceName: 'front-end',
// Set the version of your application
// Used on the APM Server to find the right source map
serviceVersion: '1.2.1',
// Set custom APM Server URL (default: http://localhost:8200)
serverUrl: 'http://localhost:8200',
// For distributed tracing to different origin (CORS)
distributedTracingOrigins: ['http://localhost:8080'],
// Check all possible config values here
// https://www.elastic.co/guide/en/apm/agent/rum-js/current/configuration.html
environment: 'Production',
//logLevel: 'debug'
})
export default apm;
Elastic RUM Agent
React-JS Configuration Example](https://image.slidesharecdn.com/elasticmoroccousergroup-meetup05-201109141341/75/Elastic-Morocco-Meetup-Nov-2020-19-2048.jpg)


![[Virtual Meetup] Using Elasticsearch as a Time-Series Database in the Endpoin...](https://cdn.slidesharecdn.com/ss_thumbnails/2020-200909133305-thumbnail.jpg?width=640&height=640&fit=bounds)


![Coded Agents – with UiPath SDK + LangGraph [Virtual Hands-on Workshop]](https://cdn.slidesharecdn.com/ss_thumbnails/codedagentsdeck-251215155422-5497c599-thumbnail.jpg?width=640&height=640&fit=bounds)


