Egyptian foreign trade digest feb 2018
•
0 likes•152 views

This document provides trade data for Egypt including exports, imports and trade balance for February 2018 and previous years. Some key highlights: - Exports in February 2018 were $3 billion, a 10% increase from the previous year. Imports in January 2018 were $4.63 billion, a 13% decrease. - The largest export categories in 2018 were engineering/electronics, chemicals and building materials. The largest import categories were chemicals, building materials and industrial equipment. - Egypt's main export partners are the EU, Arab League and USA. Main import partners are the EU, China and USA. - The trade balance deficit decreased 23% in January 2018 compared to the previous year, to $1.62

More Related Content
What's hot
What's hot (15)
Similar to Egyptian foreign trade digest feb 2018
Similar to Egyptian foreign trade digest feb 2018 (20)
More from Samir El-Gammal
Recently uploaded
Recently uploaded (20)
Egyptian foreign trade digest feb 2018
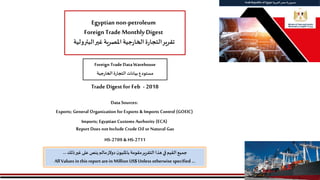
- 1. ArabRepublicof Egypt العربيةمصرجمهورية Foreign TradeDataWarehouse جيةرالخاةرالتجا بيانات مستودع Egyptian non-petroleum Foreign Trade Monthly Digest البتروغيراملصرية جيةرالخاةرالتجاتقريرلية ذلكغيرعلى ينص مالمدوالر نباملليو مقومةالتقرير هذا فيالقيمجميع... All Values in this report are in Million US$ Unless otherwise specified … Trade Digestfor Feb - 2018 Data Sources: Exports; General Organization for Exports & Imports Control (GOEIC) Imports; Egyptian Customs Aurhority (ECA) ReportDoes notInclude Crude Oil or Natural Gas HS-2709 & HS-2711
- 2. (2)Exports by End of Feb - 2018Imports by End of Jan - 2018 Historic Data20172016201520142013 Exports22,49920,40918,67422,25322,083 Value Vs. LastYear2,0911,735(3,580)170 % Change10%9%-16%1% Imports57,61266,07071,47071,55361,803 Value Vs. LastYear(8,458)(5,400)(83)9,750 % Change-13%-8%0%16% Trade Volume80,11186,47990,14493,80683,887 Value Vs. LastYear(6,368)(3,665)(3,663)9,920 % Change-7%-4%-4%12% Trade Balance(35,112)(45,661)(52,796)(49,300)(39,720) Value Vs. LastYear10,5497,135(3,496)(9,580) % Change-23%-14%7%24% Non-petroleumExports & Imports Outlook Exports 3.00 39% Imports 4.63 61% TotalExports&Imports- 2018 1,9321,66116%2714,6284,707-2%(79)(2,696)(3,046)-11%(350) 1,0711,775-40%(704)4,165(4,165)(2,390) 2,0875,124(5,124)(3,037) 1,9024,663(4,663)(2,761) 2,0785,095(5,095)(3,017) 1,6933,736(3,736)(2,043) 1,7895,355(5,355)(3,566) 1,9525,106(5,106)(3,154) 1,6024,763(4,763)(3,161) 1,9385,116(5,116)(3,178) 1,8654,786(4,786)(2,921) 2,1564,994(4,994)(2,838) 3,0033,436-13%(433)4,6284,707-2%(79)(1,625)(1,271)28%(354) Feb Mar May Oct Nov Dec Jul Aug Apr Sep Jan 2017 2018 Trade Balance 20182017 % & Value to LastYear 2017 2018 Total Imports Total Exports % & Value to LastYear % & Value to LastYear Last& Current Year Jun (Jan)(Jan) (Jan Feb )
- 3. (3)Exports by End of Feb - 2018Imports by End of Jan - 2018 1.93 1.66 1.78 2.09 1.90 2.08 1.69 1.79 1.95 1.60 1.94 1.87 2.16 - 0.50 1.00 1.50 2.00 2.50 Jan Feb Mar Apr May Jun Jul Aug Sep Oct Nov Dec MonthlyExports-Current&LastYear-BillionUS$ 2018 2017 4.63 4.71 4.17 5.12 4.66 5.09 3.74 5.36 5.11 4.76 5.12 4.79 4.99 - 2.00 4.00 6.00 Jan Feb Mar Apr May Jun Jul Aug Sep Oct Nov Dec MonthlyImports- Current&LastYear- BillionUS$ 2018 2017 3.00 22.50 20.41 18.67 22.25 22.084.63 57.61 66.07 71.47 71.55 61.80 7.63 80.11 86.48 90.14 93.81 83.89 (1.62) (35.11) (45.66) (52.80) (49.30) (39.72) (100.00) (50.00) 0.00 50.00 100.00 150.00 (Jan)2018 2017 2016 2015 2014 2013 TradeBalance- BillionUS$ Exports Imports Trade Volume Trade Balance EgyptianTradeBalance- BillionUS$
- 4. (4)Exports by End of Feb - 2018Imports by End of Jan - 2018 1.49 1.48 1.82 1.61 1.79 1.64 1.40 1.49 1.29 1.47 1.44 1.76 1.33 1.55 1.91 1.76 1.94 1.81 1.47 1.71 1.41 1.67 1.87 1.98 1.66 1.78 2.09 1.90 2.08 1.69 1.79 1.95 1.60 1.94 1.87 2.16 1.93 5.63 5.34 6.52 5.96 6.28 6.29 6.08 6.58 5.35 5.71 5.83 5.91 4.91 6.10 6.32 5.71 6.02 5.40 5.59 6.37 4.46 5.40 4.94 4.85 4.71 4.17 5.12 4.66 5.09 3.74 5.36 5.11 4.76 5.12 4.79 4.99 4.71 (4.1) (3.9) (4.7) (4.4) (4.5) (4.6) (4.7) (5.1) (4.1) (4.2) (4.4) (4.2) (3.6) (4.6) (4.4) (4.0) (4.1) (3.6) (4.1) (4.7) (3.1) (3.7) (3.1) (2.9) (3.0) (2.4) (3.0) (2.8) (3.0) (2.0) (3.6) (3.2) (3.2) (3.2) (2.9) (2.8) (2.8) 6.00- 4.00- 2.00- - 2.00 4.00 6.00 8.00 1 2 3 4 5 6 7 8 9 10 11 12 1 2 3 4 5 6 7 8 9 10 11 12 1 2 3 4 5 6 7 8 9 10 11 12 1 2 3 2015 2016 2017 2018 MonthlyEgyptianExports& Imports- BillionUS$ Exports Imports TradeBalance Monthly Exports & Imports - EarlierYears (Billion US$)
- 5. (5)Exports by End of Feb - 2018Imports by End of Jan - 2018 EU 852 28% ArabLeague 1,195 40% Africa Excl Arab 175 6% USA 133 4% Others 648 22% GeographicExportsCurrentYear(JanFeb) EU 1,396 30% Arab League 268 6% Africa Excl Arab 57 1% USA 289 6% CHINA 772 17% Others 1,846 40% GeographicImportsCurrentYear(Jan) Geographic Distribution forEgyptian Exports & Imports 20182017 852937-9%EU6,1864,9884,7826,463 1,1951,467-19%Arab League9,1439,4178,0799,387 1751637%Africa Excl Arab1,3591,2651,1221,212 133176-24%USA1,3001,1311,2361,281 648693-7%Others4,5113,6083,4553,910 3,0033,436-13%Total22,49920,40918,67422,253 20182017 1,3961,812-23%EU19,41022,76023,20422,916 268317-15%Arab League3,1964,5516,2026,202 574917%Africa Excl Arab695711709727 28923821%USA3,7643,8614,6095,679 77268513%CHINA8,0949,44210,0728,742 1,8461,60515%Others22,45324,74526,67527,287 4,6284,707-2%Total57,61266,07071,47071,553 (Jan Feb ) (Jan) %2017201620152014 2017201620152014 Geographic Imports Geographic Exports %
- 6. (6)Exports by End of Feb - 2018Imports by End of Jan - 2018 Furniture 141 3% MedicalSector 221 5% LeatherProducts 13 0% Agro(Fresh Produce) 509 12% Eng.&Electronics 1,110 27% ProcessedFood 477 12% Textile 224 6% Media 4 0% HomeTextile 9 0% Ready-made Garments (RMG) 37 1% Chemicals& Fertilizers 653 16% BuildingMaterials 704 17% Handicrafts 29 1% Imports;CouncilsClassifications(Jan)2018 Furniture 44 2% MedicalSector 51 2% LeatherProducts 14 0% Agro(Fresh Produce) 337 12% Eng.& Electronics 284 10% ProcessedFood 342 12% Textile 102 4% Media 1 0% HomeTextile 60 2% Ready-made Garments(RMG) 169 6% Chemicals& Fertilizers 577 21% BuildingMaterials 768 28% Handicrafts 27 1% Exports;CouncilsClassifications(JanFeb) 2018 Exports & Imports fortheCurrentYear(Councils Classifications)
- 7. (7)Exports by End of Feb - 2018Imports by End of Jan - 2018 44 51 14 337 284 342 102 60 169 577 768 2761 63 18 447 315 410 124 75 210 613 945 24 -28% -19% -23% -25% -10% -17% -18% -20% -19% -6% -19% 11% 200- - 200 400 600 800 1,000 Furniture MedicalSector LeatherProducts Agro (Fresh Produce) Eng.& Electronics ProcessedFood Textile HomeTextile Ready-made Garments(RMG) Chemicals& Fertilizers BuildingMaterials Handicrafts Exports;CouncilsClassifications(JanFeb) 2018 (JanFeb) 2018 2017 % 141 221 13 509 1,110 477 224 9 37 653 704 29 112 245 10 453 1,244 479 198 6 25 644 689 2326% -10% 23% 12% -11% -1% 14% 56% 49% 1% 2% 23% 200- - 200 400 600 800 1,000 1,200 1,400 Furniture MedicalSector LeatherProducts Agro (Fresh Produce) Eng.& Electronics ProcessedFood Textile HomeTextile Ready-made Garments(RMG) Chemicals & Fertilizers BuildingMaterials Handicrafts Imports;CouncilsClassifications(Jan)2018 (Jan)2018 2017 % Exports & Imports fortheCurrent/ LastYear(Councils Classifications)
- 8. (8)Exports by End of Feb - 2018Imports by End of Jan - 2018 SectoralExports & Imports (Councils Classifications) 201420152016201720172018%20172018%201420152016201720172018% 3543483723326144-27.8%2719-29.6%Furniture2,1052,0591,7931,50811214125.8% 6225115154756351-18.9%3319-41.3%Medical Sector2,8773,1072,9932,840245221-9.6% 2141691291181814-22.8%95-50.9%Leather Products185312215152101322.5% 2,2862,2602,1512,213447337-24.6%230138-40.1%Agro (Fresh Produce)7,4356,7966,0766,30745350912.4% 2,9322,4912,3252,572315284-9.8%151114-24.7%Eng. & Electronics17,95219,15518,94714,0981,2441,110-10.8% 2,9342,6562,7052,794410342-16.6%204128-37.3%Processed Food6,9757,2267,1585,837479477-0.6% 1,002921783833124102-17.7%6040-32.5%Textile2,4992,7282,5252,72319822413.5% 1819191011-22.6%0.550.33-39.1%Media718772444412.2% 7205764995227560-19.9%3622-39.1%Home Textile205194104866955.6% 1,4311,3861,2741,452210169-19.3%10653-49.5%Ready-made Garments (RMG)9361,186717416253749.3% 4,2082,9743,3634,474613577-5.9%326213-34.7%Chemicals & Fertilizers9,0459,0928,4898,0906446531.3% 4,0143,1454,9175,111945768-18.8%519208-59.8%Building Materials11,1149,3498,7828,7996897042.2% 449342230202242710.7%12135.9%Handicrafts278312264272232922.7% 22,25318,67420,40922,4993,4363,003-12.6%1,7751,071-39.7%Total Exports & Imports71,55371,47066,07057,6124,9084,707-4.1% )Jan( Imports Imp. Full Year Exp. Current Month -FebSector Exports Exp. Full Year) Jan Feb(
- 9. (9)Exports by End of Feb - 2018Imports by End of Jan - 2018 IndustrialEquipment 2,084 50% CapitalGoods 719 17%ConsumerGoods 408 10% Food& Beverage 866 21% FuelandLubricants 82 2% Imports -(Jan)2018-BroadEconomicCategories(BEC) IndustrialEquipment 1,089 57% CapitalGoods 52 3% ConsumerGoods 304 16% Food& Beverage 367 19% FuelandLubricants 99 5% Exports -(Jan)2018-BroadEconomicCategories(BEC) Exports & Imports;CurrentYear Broad Economic Categories (BEC) Industrial Equipment1,0892,0843,173(995)8592,0032,862(1,143)11,66925,93237,601(14,263) Capital Goods52719771(666)39884922(845)6999,98710,686(9,287) Consumer Goods304408713(104)310369679(59)4,1754,3498,524(174) Food & Beverage3678661,233(499)3748121,186(438)4,30510,52614,831(6,221) Fuel and Lubricants99821821752260311(208)1,2172,5623,779(1,345) Transportation Equipment28385(81)45155(46)83627710(544) Others18385404(367)23329352(307)54109163(55) Total1,9324,6286,560(2,696)1,6614,7076,367(3,046)22,49957,61280,111(35,112) Trade Balance (Jan) - 2017 (Jan) 2018 Exports Trade Balance ExportsExports Imports Full Year 2017 Imports Trade Volume Trade Volume Imports Trade Volume Trade Balance
- 10. (10)Exports by End of Feb - 2018Imports by End of Jan - 2018 TopMarkets (Jan Feb ) 2018 20172016201520142013 (Jan) 2018 20172016201520142013 (Jan) 2018 20172016201520142013 UAE3662,3992,3891,060973637CHINA7728,0949,44210,0728,7426,796CHINA(747)(7814)(9268)(9897)(8521)(6505) TURKEY2541,9161,3901,2011,3701,552GERMANY3534,4916,0775,8305,7855,006GERMANY(300)(3900)(5540)(5305)(5134)(4390) SAUDI ARABIA1921,5661,7902,0452,1272,037RUSSIA3403,3382,8193,0983,3371,872ITALY(100)(3541)(3828)(3754)(2768)(2295) ITALY1921,4081,1431,0711,6081,397USA2893,7643,8614,6095,6795,294USA(201)(2464)(2730)(3373)(4397)(4051) USA1331,3001,1311,2361,2811,243ITALY2254,9494,9724,8254,3763,691KSA5264(390)(882)(30)(62) SPAIN107719496455589583BRAZIL2182,7352,2002,7422,2692,204TURKEY(16)(124)(1218)(1800)(1365)(696) UK105882833778857895TURKEY1872,0402,6083,0022,7352,248RUSSIA(301)(2941)(2536)(2764)(2978)(1604) LEBANON97586755424624707UKRAINE1542,3502,7412,5073,1093,038UAE21315121481(158)(795)(1018) JORDAN91510492473538655INDIA1491,9352,2082,3283,0112,256UKRAINE(148)(2300)(2712)(2481)(3057)(2972) GERMANY81592537525652616UNITED KINGDOM1231,5851,4921,3161,6041,343INDIA(109)(1630)(1918)(2047)(2699)(1974) FRANCE77553474399698833INDONESIA1101,0761,0651,0971,071944FRANCE(48)(911)(1273)(2064)(1547)(1186) RUSSIAN FEDERATION72398283334359269SAUDI ARABIA1101,3022,1802,9272,1572,099BRAZIL(212)(2620)(2100)(2647)(2106)(2028) IRAQ65526390475793741KOREA SOUTH1061,8112,6392,5642,4501,553UK(53)(703)(659)(538)(747)(448) SWITZERLAND632994333136106FRANCE961,4651,7472,4632,2452,019KOREA SOUTH(105)(1776)(2608)(2523)(2408)(1524) NETHERLANDS62383327253392283BELGIUM959248049169611,055SPAIN(13)(555)(1480)(925)(756)(658) INDIA58305290281312282SPAIN891,2741,9761,3801,3451,241ARGENTINA(76)(1473)(2287)(1410)(1250)(1442) TUNISIA54284176158203229JAPAN781,0281,3761,8481,6401,369JAPAN(74)(979)(1334)(1804)(1584)(1329) MOROCCO53393329335484397SWEDEN78756736693849725NETHERLANDS(26)(397)(540)(917)(633)(734) MALTA5216895245393152ARGENTINA771,5032,2941,4141,2561,453BELGIUM(74)(619)(555)(679)(667)(673) SUDAN45448593539442550NETHERLANDS727798661,1701,0261,018INDONESIA(103)(985)(999)(1021)(995)(845) CHINA44279175175221291SWITZERLAND656787367779471,356SWITZERLAND(9)(380)(303)(746)(911)(1250) KUWAIT42319384410321282THAILAND617899151,2621,158800THAILAND(61)(721)(853)(1226)(1134)(787) KENYA39294266242248241UNITED ARAB EMIRATES558879071,2191,7681,655KUWAIT22272233(227)(738)(624) LIBYA374145455741,0071,289VIET NAM43383274287270196LIBYA183734795269581191 BELGIUM34305249237294382FINLAND35436466453458374SWEDEN(75)(728)(712)(668)(811)(692) Total Countries2,41517,24515,96313,95616,82216,648Total Countries3,9803,98057,40260,80160,24851,606 Total Exports3,00322,49920,40918,67422,25322,083Total Imports4,62857,61266,07071,47071,55361,803 % Countries to Total80%77%78%75%76%75%% Countries to Total86%7%87%85%84%83% Trade Balance; Top Markets Imports; Top Markets Exports; Top Markets
- 11. Exports & Imports Details
- 12. (12)Exports by End of Feb - 2018Imports by End of Jan - 2018 StrategicSupplies Fish & Crustaceans1.9152.9054.81(51.00)3.3031.8435.14(28.55)30.95562.66593.61(531.70) Rice0.002.182.18(2.18)0.008.408.40(8.40)0.0051.3651.36(51.36) Milk and Dairy Products25.6258.3183.93(32.69)23.2449.6572.89(26.41)304.45470.24774.69(165.79) Chicken0.046.196.23(6.15)0.392.763.15(2.37)0.90154.87155.77(153.97) Corn0.26134.10134.36(133.85)0.02136.88136.90(136.86)1.411,785.941,787.34(1,784.53) Sugar16.8821.2838.16(4.40)19.01109.87128.89(90.86)239.28788.551,027.83(549.27) Tea0.4135.6936.10(35.29)0.0812.3112.39(12.24)7.42273.17280.59(265.75) lentil0.246.977.21(6.73)0.3217.3417.66(17.03)2.7089.1291.82(86.41) Bean2.6913.2115.90(10.52)2.3318.8321.15(16.50)25.52220.86246.38(195.34) Wheat0.00204.64204.64(204.64)0.06171.24171.31(171.18)0.312,625.762,626.07(2,625.45) Meat0.39108.34108.72(107.95)0.5058.6759.17(58.17)4.621,402.181,406.80(1,397.56) Live animals0.0022.1322.13(22.13)0.056.346.39(6.29)0.38137.05137.43(136.68) Vegetable Oils6.6896.35103.04(89.67)7.96136.69144.65(128.73)100.561,311.251,411.81(1,210.68) Soya Beans0.0088.1288.12(88.12)0.0045.6045.60(45.60)0.26862.65862.91(862.39) Dried Fruits & Nuts8.238.8317.06(0.60)8.834.4213.244.4134.8054.8889.68(20.08) Total Strategic Supply63859923(796)66811877(745)75410,79111,544(10,037) Other Commodities1,8683,7695,6371,5943,8965,49021,74646,82168,567 Total1,9324,6286,5601,6614,7076,36722,49957,61280,111 % Strategic Supplies to Total3%19%14%4%21%16%3%23%17% Imports (Jan) - 2017Full Year 2017 Trade Balance ExportsImports Trade Volume Trade Balance ExportsImports Trade Volume Trade Balance (Jan) 2018 Trade Volume Exports
- 13. (13)Exports by End of Feb - 2018Imports by End of Jan - 2018 BroadEconomic Categories (BEC) Main categorySection Primary Industrial Supplies81336417(255)51322374(271)8154,2655,080(3,449) Manufactured Industrial Supplies1,0081,7482,756(740)8081,6802,488(872)10,85321,66732,521(10,814) 1,0892,0843,173(995)8592,0032,862(1,143)11,66925,93237,601(14,263) Capital Goods (non-transport)27522549(496)26589615(563)3756,6156,990(6,241) Spare Parts26196222(171)13294307(282)3253,3713,696(3,047) 52719771(666)39884922(845)6999,98710,686(9,287) Non-durable Consumer Goods89224313(135)90233323(143)1,2242,5913,814(1,367) Durable Consumer Goods94621563210854162541,4236132,035810 Semi-durable Consumer Goods121122243(1)11282194311,5291,1452,675384 304408713(104)310369679(59)4,1754,3498,524(174) Primary Foodstuff - Consumption2151103251052151073221082,2961,1663,4621,130 Primary Foodstuff - Industry12353364(341)14237251(223)1373,9094,045(3,772) Manufactured Foodstuff - Consumption119262381(144)130255385(125)1,5843,1294,712(1,545) Manufactured Foodstuff - Industry22141163(120)15213228(198)2892,3232,612(2,034) 3678661,233(499)3748121,186(438)4,30510,52614,831(6,221) Fuel and grease lubricated for use in non-motor power95611563549250299(201)1,1812,3053,486(1,124) Crude Fuel & Oil42125(18)3912(7)36257293(221) 99821821752260311(208)1,2172,5623,779(1,345) Passenger Cars0152153(152)0146146(145)11,6801,681(1,679) Transport Spare Parts15154170(139)19173192(155)2941,8252,118(1,531) Transportation equipment for non - industrial uses123(0)011(1)21517(14) 28385(81)45155(46)83627710(544) 27778(75)295(7)54109163(55) 1,9324,6286,560(2,696)1,6614,7076,367(3,046)22,49957,61280,111(35,112) Total - Transportation Equipment Fuel and Lubricants Food & Beverage Total - Food & Beverage Total - Fuel and Lubricants (Jan) - 2017 Trade Volume ExportsImportsExportsImports (Jan) 2018Full Year 2017 Exports Trade Balance Trade Volume Trade Balance Broad Economic Categories (BEC) Industrial Equipment Total - Industrial Equipment Capital Goods Total - Capital Goods Imports Others Total Transportation Equipment Consumer Goods Total - Consumer Goods Trade Volume Trade Balance
- 15. (15)Exports by End of Feb - 2018Imports by End of Jan - 2018 - 6,186 4,988 4,782 6,463 6,124 852 937 779 725 1,150 987 - 2,000 4,000 6,000 8,000 2018 2017 2016 2015 2014 2013 Exports - EU Total Year (Jan Feb ) - 19,410 22,760 23,204 22,916 19,807 1,396 1,812 1,691 2,012 1,393 1,946 - 5,000 10,000 15,000 20,000 25,000 2018 2017 2016 2015 2014 2013 Imports - EU Total Year (Jan) - 9,143 9,417 8,079 9,387 9,162 1,195 1,467 1,254 1,270 1,508 1,467 - 2,000 4,000 6,000 8,000 10,000 2018 2017 2016 2015 2014 2013 Exports - Arab League Total Year (Jan Feb ) - 3,196 4,551 6,202 6,202 5,914 268 317 408 438 451 482 - 2,000 4,000 6,000 8,000 2018 2017 2016 2015 2014 2013 Imports - Arab League Total Year (Jan) - 1,187 997 966 1,225 1,282 198 163 140 142 177 176 - 500 1,000 1,500 2018 2017 2016 2015 2014 2013 Exports - Agadir Agr. Total Year (Jan Feb ) - 288 549 515 325 253 27 38 29 28 21 21 - 200 400 600 2018 2017 2016 2015 2014 2013 Imports - Agadir Agr. Total Year (Jan) Groups & Agreements
- 16. (16)Exports by End of Feb - 2018Imports by End of Jan - 2018 االتفاقيات لودوالدوليةاملجموعاتGroups& Agreements - 3,423 3,471 3,277 3,999 4,389 407 458 481 516 622 862 - 1,000 2,000 3,000 4,000 5,000 2018 2017 2016 2015 2014 2013 Exports - Africa Total Year (Jan Feb ) - 1,025 1,355 1,303 1,122 1,069 98 101 69 69 71 114 - 500 1,000 1,500 2018 2017 2016 2015 2014 2013 Imports - Africa Total Year (Jan) - 1,359 1,265 1,122 1,212 1,374 175 163 177 184 178 368 - 500 1,000 1,500 2018 2017 2016 2015 2014 2013 Exports - Africa;No-Arab Total Year (Jan Feb ) - 695 711 709 727 726 57 49 40 48 50 54 - 200 400 600 800 2018 2017 2016 2015 2014 2013 Imports - Africa;No-Arab Total Year (Jan) - 632 660 523 570 775 85 72 88 97 82 286 - 200 400 600 800 1,000 2018 2017 2016 2015 2014 2013 Exports - Africa;non-Arab & non-COMESA Total Year (Jan Feb ) - 239 232 236 163 198 8 14 11 9 11 12 - 100 200 300 2018 2017 2016 2015 2014 2013 Imports - Africa;non-Arab & non-COMESA Total Year (Jan) Groups & Agreements
- 17. (17)Exports by End of Feb - 2018Imports by End of Jan - 2018 االتفاقيات لودوالدوليةاملجموعاتGroups& Agreements - 1,005 1,091 1,023 944 1,022 114 154 146 154 136 141 - 500 1,000 1,500 2018 2017 2016 2015 2014 2013 Exports - Nile Basin Total Year (Jan Feb ) - 379 410 385 566 414 53 20 32 31 26 34 - 200 400 600 2018 2017 2016 2015 2014 2013 Imports - Nile Basin Total Year (Jan) - 391 422 305 374 541 40 46 54 76 47 219 - 200 400 600 2018 2017 2016 2015 2014 2013 Exports - SADC Total Year (Jan Feb ) - 346 305 306 234 280 19 32 11 17 28 24 - 100 200 300 400 2018 2017 2016 2015 2014 2013 Imports - SADC Total Year (Jan) Groups & Agreements - 5,326 5,437 4,487 4,693 4,069 704 892 734 713 728 661 - 2,000 4,000 6,000 2018 2017 2016 2015 2014 2013 Exports - GCC Total Year (Jan Feb ) - 2,516 3,508 5,157 5,354 4,987 197 233 348 371 396 374 - 2,000 4,000 6,000 2018 2017 2016 2015 2014 2013 Imports - GCC Total Year (Jan)
- 18. (18)Exports by End of Feb - 2018Imports by End of Jan - 2018 االتفاقيات لودوالدوليةاملجموعاتGroups& Agreements - 2,402 2,306 2,498 3,494 3,744 319 351 325 387 573 569 - 1,000 2,000 3,000 4,000 2018 2017 2016 2015 2014 2013 Exports - Arab Common Market Agr. Total Year (Jan Feb ) - 436 849 1,301 1,498 1,501 34 57 88 99 140 169 - 500 1,000 1,500 2,000 2018 2017 2016 2015 2014 2013 Imports - Arab Common Market Agr. Total Year (Jan) - 3,359 2,566 2,340 2,625 2,833 459 458 349 368 420 442 - 1,000 2,000 3,000 4,000 2018 2017 2016 2015 2014 2013 Exports - Arab; no-Asian Total Year (Jan Feb ) - 18,453 21,965 24,084 23,144 18,178 1,609 1,467 1,767 1,841 1,293 1,571 - 10,000 20,000 30,000 2018 2017 2016 2015 2014 2013 Imports - Arab; no-Asian Total Year (Jan) - 5,787 5,802 5,823 6,899 6,616 736 854 838 913 1,119 1,044 - 2,000 4,000 6,000 8,000 2018 2017 2016 2015 2014 2013 Exports - Arab; no-COMESA Total Year (Jan Feb ) - 2,059 3,358 4,705 4,103 3,932 182 196 298 325 302 331 - 1,000 2,000 3,000 4,000 5,000 2018 2017 2016 2015 2014 2013 Imports - Arab; no-COMESA Total Year (Jan) Groups & Agreements
- 19. (19)Exports by End of Feb - 2018Imports by End of Jan - 2018 االتفاقيات لودوالدوليةاملجموعاتGroups& Agreements - 1,597 1,765 1,704 2,068 2,426 174 240 245 258 345 388 - 1,000 2,000 3,000 2018 2017 2016 2015 2014 2013 Exports - COMESA Total Year (Jan Feb ) - 620 644 582 733 694 73 47 44 42 46 78 - 200 400 600 800 2018 2017 2016 2015 2014 2013 Imports - COMESA Total Year (Jan) - 455 479 471 543 512 50 35 29 38 39 39 - 200 400 600 2018 2017 2016 2015 2014 2013 Imports - COMESA; non-Arab Total Year (Jan) - 734 626 591 617 586 91 89 94 89 95 81 - 200 400 600 800 2018 2017 2016 2015 2014 2013 Exports - COMESA;non-Arab Total Year (Jan Feb ) Groups & Agreements - 336 293 255 221 276 33 62 36 41 38 75 - 100 200 300 400 2018 2017 2016 2015 2014 2013 Exports - ASEAN Total Year (Jan Feb ) - 2,873 2,860 3,337 3,235 2,863 262 234 209 239 224 211 - 1,000 2,000 3,000 4,000 2018 2017 2016 2015 2014 2013 Imports - ASEAN Total Year (Jan)
- 20. (20)Exports by End of Feb - 2018Imports by End of Jan - 2018 االتفاقيات لودوالدوليةاملجموعاتGroups& Agreements - 313 444 44 49 121 64 111 28 6 8 11 - 100 200 300 400 500 2018 2017 2016 2015 2014 2013 Exports - EFTA Agr. Total Year (Jan Feb ) - 887 880 1,085 1,109 1,537 98 73 75 79 70 75 - 500 1,000 1,500 2,000 2018 2017 2016 2015 2014 2013 Imports - EFTA Agr. Total Year (Jan) - 1,404 1,216 1,749 1,824 1,804 141 190 191 297 292 344 - 500 1,000 1,500 2,000 2018 2017 2016 2015 2014 2013 Exports - North American Free Trade Agr. (NAFTA) Total Year (Jan Feb ) - 4,078 4,177 5,033 6,063 5,760 315 265 271 461 315 361 - 2,000 4,000 6,000 8,000 2018 2017 2016 2015 2014 2013 Imports - North AmericanFree Trade Agr. (NAFTA) Total Year (Jan) - 176 123 111 181 209 11 24 7 22 28 33 - 50 100 150 200 250 2018 2017 2016 2015 2014 2013 Exports - MERCOSUR Total Year (Jan Feb ) - 4,368 4,596 4,362 3,817 3,957 308 231 243 257 191 327 - 1,000 2,000 3,000 4,000 5,000 2018 2017 2016 2015 2014 2013 Imports - MERCOSUR Total Year (Jan) Groups & Agreements
- 21. (21)Exports by End of Feb - 2018Imports by End of Jan - 2018 - 2,399 2,389 1,060 973 637 366 448 252 173 128 103 - 1,000 2,000 3,000 2018 2017 2016 2015 2014 2013 Exports - UAE Total Year (Jan Feb ) - 1,916 1,390 1,201 1,370 1,552 254 248 195 186 230 212 - 500 1,000 1,500 2,000 2,500 2018 2017 2016 2015 2014 2013 Exports - TURKEY Total Year (Jan Feb ) - 1,566 1,790 2,045 2,127 2,037 192 245 300 317 363 362 - 500 1,000 1,500 2,000 2,500 2018 2017 2016 2015 2014 2013 Exports - SAUDIARABIA Total Year (Jan Feb ) - 887 907 1,219 1,768 1,655 55 90 72 93 139 75 - 500 1,000 1,500 2,000 2018 2017 2016 2015 2014 2013 Imports - UAE Total Year (Jan) - 2,040 2,608 3,002 2,735 2,248 187 177 254 223 138 162 - 1,000 2,000 3,000 4,000 2018 2017 2016 2015 2014 2013 Imports - TURKEY Total Year (Jan) - 1,302 2,180 2,927 2,157 2,099 110 92 189 179 139 154 - 1,000 2,000 3,000 4,000 2018 2017 2016 2015 2014 2013 Imports - SAUDI ARABIA Total Year (Jan) TopExports’Markets
- 22. (22)Exports by End of Feb - 2018Imports by End of Jan - 2018 - 1,408 1,143 1,071 1,608 1,397 192 241 175 195 282 249 - 500 1,000 1,500 2,000 2018 2017 2016 2015 2014 2013 Exports - ITALY Total Year (Jan Feb ) - 1,300 1,131 1,236 1,281 1,243 133 176 178 203 223 194 - 500 1,000 1,500 2018 2017 2016 2015 2014 2013 Exports - USA Total Year (Jan Feb ) - 719 496 455 589 583 107 114 66 73 106 86 - 200 400 600 800 2018 2017 2016 2015 2014 2013 Exports - SPAIN Total Year (Jan Feb ) - 4,949 4,972 4,825 4,376 3,691 225 406 342 417 202 453 - 2,000 4,000 6,000 2018 2017 2016 2015 2014 2013 Imports - ITALY Total Year (Jan) - 3,764 3,861 4,609 5,679 5,294 289 238 249 399 290 343 - 2,000 4,000 6,000 2018 2017 2016 2015 2014 2013 Imports - USA Total Year (Jan) - 1,274 1,976 1,380 1,345 1,241 89 90 105 129 59 103 - 500 1,000 1,500 2,000 2,500 2018 2017 2016 2015 2014 2013 Imports - SPAIN Total Year (Jan) TopExports’Markets
- 23. (23)Exports by End of Feb - 2018Imports by End of Jan - 2018 اترالصاد أسواقأكبرTop Exports’ Markets - 882 833 778 857 895 105 121 134 115 142 133 - 200 400 600 800 1,000 2018 2017 2016 2015 2014 2013 Exports - UK Total Year (Jan Feb ) - 586 755 424 624 707 97 113 66 64 120 129 - 200 400 600 800 2018 2017 2016 2015 2014 2013 Exports - LEBANON Total Year (Jan Feb ) - 1,585 1,492 1,316 1,604 1,343 123 183 89 130 114 99 - 500 1,000 1,500 2,000 2018 2017 2016 2015 2014 2013 Imports - UK Total Year (Jan) - 89 109 128 106 111 9 7 8 9 5 12 - 50 100 150 2018 2017 2016 2015 2014 2013 Imports - LEBANON Total Year (Jan) TopExports’Markets - 510 492 473 538 655 91 79 74 66 83 78 - 200 400 600 800 2018 2017 2016 2015 2014 2013 Exports - JORDAN Total Year (Jan Feb ) - 103 99 116 122 120 10 478 10 11 10 10 - 200 400 600 2018 2017 2016 2015 2014 2013 Imports - JORDAN Total Year (Jan)
- 24. (24)Exports by End of Feb - 2018Imports by End of Jan - 2018 8,094 9,442 10,072 8,742 6,796 772 685 821 772 525 583 - 5,000 10,000 15,000 2018 2017 2016 2015 2014 2013 Imports - CHINA Total Year (Jan) 4,491 6,077 5,830 5,785 5,006 353 478 538 465 342 452 - 2,000 4,000 6,000 8,000 2018 2017 2016 2015 2014 2013 Imports - GERMANY Total Year (Jan) 3,338 2,819 3,098 3,337 1,872 340 205 196 180 188 237 - 1,000 2,000 3,000 4,000 2018 2017 2016 2015 2014 2013 Imports - RUSSIA Total Year (Jan) 279 175 175 221 291 25 31 24 33 34 55 - 100 200 300 400 2018 2017 2016 2015 2014 2013 Exports - CHINA Total Year (Jan Feb ) 592 537 525 652 616 53 93 88 76 99 94 - 200 400 600 800 2018 2017 2016 2015 2014 2013 Exports - GERMANY Total Year (Jan Feb ) 398 283 334 359 269 38 62 65 75 91 73 - 100 200 300 400 500 2018 2017 2016 2015 2014 2013 Exports - RUSSIA Total Year (Jan Feb ) TopImports’Markets
- 25. (25)Exports by End of Feb - 2018Imports by End of Jan - 2018 3,764 3,861 4,609 5,679 5,294 289 238 249 399 290 343 - 2,000 4,000 6,000 2018 2017 2016 2015 2014 2013 Imports - USA Total Year (Jan) 4,949 4,972 4,825 4,376 3,691 225 406 342 417 202 453 - 2,000 4,000 6,000 2018 2017 2016 2015 2014 2013 Imports - ITALY Total Year (Jan) 2,735 2,200 2,742 2,269 2,204 218 130 167 210 147 276 - 1,000 2,000 3,000 2018 2017 2016 2015 2014 2013 Imports - BRAZIL Total Year (Jan) 1,300 1,131 1,236 1,281 1,243 88 176 178 203 223 194 - 500 1,000 1,500 2018 2017 2016 2015 2014 2013 Exports - USA Total Year (Jan Feb ) 1,408 1,143 1,071 1,608 1,397 125 241 175 195 282 249 - 500 1,000 1,500 2,000 2018 2017 2016 2015 2014 2013 Exports - ITALY Total Year (Jan Feb ) 115 101 95 162 176 6 21 5 19 25 27 - 50 100 150 200 2018 2017 2016 2015 2014 2013 Exports - BRAZIL Total Year (Jan Feb ) TopImports’Markets
- 26. (26)Exports by End of Feb - 2018Imports by End of Jan - 2018 2,040 2,608 3,002 2,735 2,248 187 177 254 223 138 162 - 1,000 2,000 3,000 4,000 2018 2017 2016 2015 2014 2013 Imports - TURKEY Total Year (Jan) 2,350 2,741 2,507 3,109 3,038 154 206 157 223 337 246 - 1,000 2,000 3,000 4,000 2018 2017 2016 2015 2014 2013 Imports - UKRAINE Total Year (Jan) 1,916 1,390 1,201 1,370 1,552 171 248 195 186 230 212 - 500 1,000 1,500 2,000 2,500 2018 2017 2016 2015 2014 2013 Exports - TURKEY Total Year (Jan Feb ) 50 28 26 52 67 6 9 6 7 11 22 - 20 40 60 80 2018 2017 2016 2015 2014 2013 Exports - UKRAINE Total Year (Jan Feb ) TopImports’Markets
- 27. (27)Exports by End of Feb - 2018Imports by End of Jan - 2018 1,935 2,208 2,328 3,011 2,256 149 131 138 193 146 223 - 1,000 2,000 3,000 4,000 2018 2017 2016 2015 2014 2013 Imports - INDIA Total Year (Jan) 1,585 1,492 1,316 1,604 1,343 123 183 89 130 114 99 - 500 1,000 1,500 2,000 2018 2017 2016 2015 2014 2013 Imports - UNITED KINGDOM Total Year (Jan) 305 290 281 312 282 40 33 29 39 35 43 - 100 200 300 400 2018 2017 2016 2015 2014 2013 Exports - INDIA Total Year (Jan Feb ) 882 833 778 857 895 70 121 134 115 142 133 - 200 400 600 800 1,000 2018 2017 2016 2015 2014 2013 Exports - UNITED KINGDOM Total Year (Jan Feb ) TopImports’Markets
- 29. (29)Exports by End of Feb - 2018Imports by End of Jan - 2018 البناء موادBuilding MaterialsBuildingMaterials 20182017201620152014% 17-18% 16-17% 15-16% 14-15Month20182017201620152014% 17-18% 16-17% 15-16% 14-15 55942617227332131%148%-37%-15%Jan7046896588598192%5%-23%5% 208519283251332-60%83%13%-24%Feb-618785743746-21%6%0% -45541530735510%35%-14%Mar-794817858879-3%-5%-2% -46040627335813%49%-24%Apr-680703821753-3%-14%9% -445500301398-11%66%-24%May-725788822926-8%-4%-11% -322467289379-31%62%-24%Jun-567613762900-7%-20%-15% -336370245320-9%51%-23%Jul-89069677169028%-10%12% -455550244314-17%125%-22%Aug-7938518051,110-7%6%-27% -3963702293017%61%-24%Sep-7366466511,01214%-1%-36% -3963712432587%53%-6%Oct-7577687341,117-1%5%-34% -420520225325-19%131%-31%Nov-7107317861,038-3%-7%-24% -480493264354-3%87%-25%Dec-8397287361,12415%-1%-35% 7685,1114,9173,1454,0144%56%-22%Total7048,7998,7829,34911,1140%-6%-16% 768945455524653-19%108%-13%-20%YTD7046896588598192%5%-23%5% 300322499204091867422253462857612660707147071553 25.56%22.72%24.10%16.84%18.04%15.21%15.27%13.29%13.08%15.53% Imports - Building Materials Exports - Building Materials % Sector to Total Exports% Sector to Total Imports Total ExportsTotal Imports
- 30. (30)Exports by End of Feb - 2018Imports by End of Jan - 2018 البناء موادBuilding Materials Top 10 Countries - Sector Exports (Jan Feb ) 2018 20172016201520142013Top 10 Countries - Sector Imports(Jan) 201820172016201520142013 UAE280.721,630.001,627.25159.93206.52105.38UKRAINE77.07761.591,038.011,030.221,390.101,276.99 SAUDI ARABIA20.37179.97223.65320.26512.59705.50CHINA91.78938.581,327.421,515.971,343.71894.14 ITALY64.41458.90307.92312.62382.91414.75USA28.22510.96494.31620.21838.92955.31 LEBANON63.44198.46388.0897.94142.76260.00TURKEY47.49560.18791.62757.93601.69465.01 SOUTH AFRICA1.2218.79167.9470.3766.62256.94ITALY56.99758.16663.80499.55618.31559.71 LIBYA8.1796.69107.52141.46338.36512.00RUSSIA65.76810.97731.38690.50631.13379.06 CANADA0.021.551.28441.51461.67495.48GERMANY34.11454.58562.30488.64604.16519.10 SWITZERLAND59.54267.66409.555.782.9275.73BRAZIL43.30516.98286.13203.82290.14507.97 TURKEY48.30268.66209.54119.37128.31175.17UK28.47389.94319.54199.87419.60343.06 CHINA7.7151.1071.2094.91139.11176.78SPAIN17.06322.06340.96391.58311.22344.73 % to Total Sector72%62%71%56%59%63%% to Total Sector70%68%75%68%63%58% 5,111 4,917 3,145 4,014 768 945 455 524 653 - 2,000 4,000 6,000 2018 2017 2016 2015 2014 Exports - Building Materials Total Year (Jan Feb ) 8,799 8,782 9,349 11,114 704 689 658 859 819 - 5,000 10,000 15,000 2018 2017 2016 2015 2014 Imports - Building Materials Total Year (Jan) BuildingMaterials
- 31. (31)Exports by End of Feb - 2018Imports by End of Jan - 2018 واألسمدةالكيماوياتChemicals & FertilizersChemicals & Fertilizers 20182017201620152014% 17-18% 16-17% 15-16% 14-15Month20182017201620152014% 17-18% 16-17% 15-16% 14-15 36428725222833227%14%10%-31%Jan6536446187105941%4%-13%19% 213326230234398-35%42%-2%-41%Feb-654712671557-8%6%20% -37229225940527%13%-36%Mar-699823782772-15%5%1% -32123023038039%0%-40%Apr-646725779663-11%-7%18% -41624524842070%-1%-41%May-726830836812-13%-1%3% -33526721334925%26%-39%Jun-528711808783-26%-12%3% -38927921925439%27%-14%Jul-7527477646761%-2%13% -38423325834465%-10%-25%Aug-715737833928-3%-12%-10% -34523423430547%0%-23%Sep-64757865982312%-12%-20% -44133125832033%28%-19%Oct-692705742768-2%-5%-3% -365398265330-8%50%-20%Nov-652661776813-1%-15%-5% -49437232737233%14%-12%Dec-73664173285715%-12%-15% 5774,4743,3632,9744,20833%13%-29%Total6538,0908,4899,0929,045-5%-7%1% 577613482462729-6%27%4%-37%YTD6536446187105941%4%-13%19% 300322499204091867422253462857612660707147071553 19.21%19.88%16.48%15.92%18.91%14.10%14.04%12.85%12.72%12.64% Total ExportsTotal Imports % Sector to Total Exports% Sector to Total Imports Imports - Chemicals & Fertilizers Exports - Chemicals & Fertilizers
- 32. (32)Exports by End of Feb - 2018Imports by End of Jan - 2018 واألسمدةالكيماوياتChemicals & Fertilizers Top 10 Countries - Sector Exports (Jan Feb ) 2018 20172016201520142013Top 10 Countries - Sector Imports(Jan) 201820172016201520142013 TURKEY123.651,026.92625.28476.51634.13723.52SAUDI ARABIA79.97937.231,030.071,200.621,235.161,056.74 FRANCE41.61275.65217.45159.72427.41529.65CHINA96.29964.851,057.971,102.231,081.16952.15 ITALY59.19242.58191.63139.21327.81230.13GERMANY47.03675.12829.73869.92810.02823.02 SPAIN31.26265.40159.22116.98269.29268.99USA31.13435.39453.50494.45479.83471.54 BELGIUM15.77185.75132.33121.14150.22198.58ITALY27.93372.09367.99402.00407.53410.30 SAUDI ARABIA22.64171.25158.30195.12162.60158.17TURKEY33.35382.37431.85457.34380.17335.45 UK13.06142.4082.7295.97119.37120.53KOREA SOUTH24.42329.44326.41369.22523.50376.45 USA6.3399.49110.7754.0966.9964.06INDIA28.94397.86342.31311.36299.25289.69 MOROCCO13.93120.3694.4195.14102.8088.96FRANCE21.02268.80288.48286.98317.68304.88 KENYA16.06121.0597.80105.20127.79112.41UAE18.13257.68304.10308.88246.57223.94 % to Total Sector60%59%56%52%57%57%% to Total Sector63%62%64%64%64%63% 4,474 3,363 2,974 4,208 577 613 482 462 729 - 2,000 4,000 6,000 2018 2017 2016 2015 2014 Exports - Chemicals & Fertilizers Total Year (Jan Feb ) 8,090 8,489 9,092 9,045 653 644 618 710 594 - 5,000 10,000 2018 2017 2016 2015 2014 Imports - Chemicals & Fertilizers Total Year (Jan) Chemicals & Fertilizers
- 33. (33)Exports by End of Feb - 2018Imports by End of Jan - 2018 واإللكترونية الهندسية السلعEngineering & ElectronicsEng.& Electronics 20182017201620152014% 17-18% 16-17% 15-16% 14-15Month20182017201620152014% 17-18% 16-17% 15-16% 14-15 1701641611681814%2%-4%-7%Jan1,1101,2441,4521,5681,019-11%-14%-7%54% 114151184167208-25%-18%11%-20%Feb-1,0731,9821,490904-46%33%65% -2222142393254%-11%-26%Mar-1,2841,6761,7171,496-23%-2%15% -2031962222094%-12%6%Apr-1,0741,5661,5091,170-31%4%29% -2212102642855%-20%-7%May-1,2501,6791,6281,555-26%3%5% -1921822102896%-13%-27%Jun-9391,4791,7191,510-37%-14%14% -23618018817931%-4%5%Jul-1,3681,5601,7071,430-12%-9%19% -22519424628316%-21%-13%Aug-1,2602,2231,7061,944-43%30%-12% -2222231822670%22%-32%Sep-1,0491,1511,3891,754-9%-17%-21% -26821420717326%3%19%Oct-1,2741,5751,4821,698-19%6%-13% -26018618226040%2%-30%Nov-1,0721,3301,5051,721-19%-12%-13% -20818421527213%-15%-21%Dec-1,2121,2731,7341,751-5%-27%-1% 2842,5722,3252,4912,93211%-7%-15%Total1,11014,09818,94719,15517,952-26%-1%7% 284315345335389-10%-9%3%-14%YTD11101244145215681019-11%-14%-7%54% 300322499204091867422253462857612660707147071553 9.46%11.43%11.39%13.34%13.18%23.98%24.47%28.68%26.80%25.09% Total Imports % Sector to Total Exports Imports - Eng. & Electronics Exports - Eng. & Electronics Total Exports % Sector to Total Imports
- 34. (34)Exports by End of Feb - 2018Imports by End of Jan - 2018 واإللكترونية الهندسية السلعEngineering & Electronics Top 10 Countries - Sector Exports (Jan Feb ) 2018 20172016201520142013Top 10 Countries - Sector Imports(Jan) 201820172016201520142013 SAUDI ARABIA26.52268.77340.01431.26527.90333.42CHINA319.293,351.444,045.073,908.673,357.062,794.43 UAE31.02311.78299.30398.63317.99136.05GERMANY178.402,064.132,953.502,782.382,886.472,258.35 UK45.57311.57302.50262.33244.53277.23ITALY87.611,448.811,371.981,208.861,470.751,513.20 QATAR3.82212.62136.07140.44162.3989.30KOREA SOUTH50.21726.371,779.571,465.581,392.12830.00 ALGERIA11.55104.09126.92146.50205.66198.07USA37.44882.421,143.241,216.911,043.981,198.12 IRAQ11.86149.25110.82126.47309.89163.32JAPAN48.26577.51956.461,292.471,148.08909.53 GERMANY10.4677.5384.8993.05100.88113.94FRANCE21.76408.25528.39794.10756.16557.82 FRANCE12.83100.3898.5564.5597.2475.30SPAIN18.39457.981,150.16548.37433.80533.05 LIBYA2.8225.8233.6939.17116.8786.94THAILAND23.96355.00373.08738.07661.14377.54 LEBANON9.2466.9160.1062.6482.3781.05TURKEY47.98461.65496.89534.38477.72320.24 % to Total Sector58%63%69%71%74%67%% to Total Sector75%76%78%76%76%76% 2,572 2,325 2,491 2,932 284 315 345 335 389 - 1,000 2,000 3,000 4,000 2018 2017 2016 2015 2014 Exports - Eng. & Electronics Total Year (Jan Feb ) 14,098 18,947 19,155 17,952 1,110 1,244 1,452 1,568 1,019 - 10,000 20,000 30,000 2018 2017 2016 2015 2014 Imports - Eng. & Electronics Total Year (Jan) Eng.& Electronics
- 35. (35)Exports by End of Feb - 2018Imports by End of Jan - 2018 الغذائيةالصناعاتProcessed FoodProcessedFood 20182017201620152014% 17-18% 16-17% 15-16% 14-15Month20182017201620152014% 17-18% 16-17% 15-16% 14-15 2142061802022394%15%-11%-15%Jan477479444594456-1%8%-25%30% 128204218213235-37%-7%3%-9%Feb-359574500474-38%15%5% -2802592592648%0%-2%Mar-529660679640-20%-3%6% -2632532462564%3%-4%Apr-461684597528-33%15%13% -269272259313-1%5%-17%May-499662626638-25%6%-2% -208231215269-10%8%-20%Jun-371636610653-42%4%-7% -24820420920922%-2%0%Jul-534677599525-21%13%14% -25421121221020%0%1%Aug-490616715661-20%-14%8% -1851771832564%-3%-28%Sep-485591495574-18%19%-14% -2202202262100%-2%7%Oct-550558560573-1%0%-2% -222236216244-6%9%-11%Nov-542558658595-3%-15%10% -235243218230-3%12%-5%Dec-5374985936568%-16%-10% 3422,7942,7052,6562,9343%2%-9%Total4775,8377,1587,2266,975-18%-1%4% 342410398415473-17%3%-4%-12%YTD477479444594456-1%8%-25%30% 300322499204091867422253462857612660707147071553 11.39%12.42%13.26%14.22%13.19%10.30%10.13%10.83%10.11%9.75% % Sector to Total Exports% Sector to Total Imports Total Imports Total Exports Exports - Processed FoodImports - Processed Food
- 36. (36)Exports by End of Feb - 2018Imports by End of Jan - 2018 الغذائيةالصناعاتProcessed Food Top 10 Countries - Sector Exports (Jan Feb ) 2018 20172016201520142013Top 10 Countries - Sector Imports(Jan) 201820172016201520142013 SAUDI ARABIA39.51313.71332.79342.30324.10346.17BRAZIL76.61953.741,016.201,323.49831.16764.42 LIBYA10.15151.82208.16185.50211.97235.87USA50.27500.85614.15671.77738.69664.28 JORDAN18.98137.42122.17120.86136.38149.28INDONESIA79.99785.76719.98682.30661.94534.56 UAE15.38117.34115.79134.00151.67136.19ARGENTINA22.48556.87906.91649.02568.02454.89 IRAQ16.62112.3274.8578.46134.47170.13INDIA22.10415.18619.86508.67660.93413.30 SUDAN1.7248.37204.38131.83102.11134.49KENYA32.26239.20291.23264.12330.11257.08 LEBANON6.9067.5771.5384.90126.66135.34UKRAINE2.29191.61225.98208.02233.25346.94 YEMEN11.57113.3098.6095.6191.6190.87MALAYSIA7.90143.09184.13141.64243.21285.90 USA15.12100.9092.0494.6583.9073.29NETHERLANDS13.36174.26228.41244.13231.35197.39 MOROCCO8.7771.0786.3056.19123.0190.56RUSSIA14.84287.29243.00155.52351.16271.15 % to Total Sector42%44%52%50%51%55%% to Total Sector68%73%71%67%70%67% 2,794 2,705 2,656 2,934 342 410 398 415 473 - 1,000 2,000 3,000 4,000 2018 2017 2016 2015 2014 Exports - Processed Food Total Year (Jan Feb ) 5,837 7,158 7,226 6,975 477 479 444 594 456 - 2,000 4,000 6,000 8,000 2018 2017 2016 2015 2014 Imports - Processed Food Total Year (Jan) ProcessedFood
- 37. (37)Exports by End of Feb - 2018Imports by End of Jan - 2018 اعيةرالز الحاصالتAgro (FreshProduce)Agro(FreshProduce) 20182017201620152014% 17-18% 16-17% 15-16% 14-15Month20182017201620152014% 17-18% 16-17% 15-16% 14-15 199217199204235-8%9%-3%-13%Jan50945344056052412%3%-21%7% 138230227223263-40%1%2%-15%Feb-448575544347-22%6%57% -2872752572825%7%-9%Mar-6176026866802%-12%1% -2222182152172%2%-1%Apr-6476195874774%6%23% -229273235290-16%16%-19%May-59946046974630%-2%-37% -2212082572936%-19%-12%Jun-377455393571-17%16%-31% -127801169459%-31%23%Jul-411438542412-6%-19%31% -9790114898%-21%29%Aug-60350662778919%-19%-21% -89871101053%-21%5%Sep-64244554783045%-19%-34% -133146142105-9%3%35%Oct-53345152863918%-15%-17% -14212914112010%-9%18%Nov-466568573752-18%-1%-24% -217219246193-1%-11%27%Dec-512519740668-1%-30%11% 3372,2132,1512,2602,2863%-5%-1%Total5096,3076,0766,7967,4354%-11%-9% 337447426427499-25%5%0%-14%YTD50945344056052412%3%-21%7% 300322499204091867422253462857612660707147071553 11.22%9.84%10.54%12.10%10.27%11.00%10.95%9.20%9.51%10.39% Total Imports % Sector to Total Exports% Sector to Total Imports Exports - Agro (Fresh Produce)Imports - Agro (Fresh Produce) Total Exports
- 38. (38)Exports by End of Feb - 2018Imports by End of Jan - 2018 اعيةرالز الحاصالتAgro (FreshProduce) Top 10 Countries - Sector Exports (Jan Feb ) 2018 20172016201520142013Top 10 Countries - Sector Imports(Jan) 201820172016201520142013 SAUDI ARABIA49.91328.94383.90377.17287.44263.19UKRAINE69.491,349.301,395.921,148.061,393.641,303.65 RUSSIA60.84317.81236.86280.60303.90227.00RUSSIA175.951,596.561,084.621,198.671,148.94554.58 UK17.70140.88170.73159.38171.79207.90USA48.89497.30327.95584.421,242.00861.60 NETHERLANDS16.96150.55134.15107.31114.83103.31ARGENTINA51.72760.33911.34573.26586.96889.23 UAE15.45123.60108.54140.15112.2699.49BRAZIL66.78533.52377.09617.11482.92551.76 ITALY12.67104.4596.3674.12101.97130.60FRANCE1.7577.98195.15524.46431.96355.81 KUWAIT9.5988.94154.79169.6195.6859.92ROMANIA-252.31290.69318.40487.42454.97 IRAQ9.9280.1736.4578.18141.36137.54AUSTRALIA10.44175.81156.85244.15227.74281.75 GERMANY14.0883.8589.1075.0273.7059.21CANADA5.8744.7794.89167.28122.95125.63 LIBYA2.7521.7245.1553.29116.94136.67UK2.0482.90142.28144.76149.10138.44 % to Total Sector62%65%68%67%66%65%% to Total Sector85%85%82%81%84%85% 2,213 2,151 2,260 2,286 337 447 426 427 499 - 1,000 2,000 3,000 2018 2017 2016 2015 2014 Exports - Agro (Fresh Produce) Total Year (Jan Feb ) 6,307 6,076 6,796 7,435 509 453 440 560 524 - 2,000 4,000 6,000 8,000 2018 2017 2016 2015 2014 Imports - Agro (Fresh Produce) Total Year (Jan) Agro(FreshProduce)
- 39. (39)Exports by End of Feb - 2018Imports by End of Jan - 2018 الجاهزة املالبسReady-MadeGarments (RMG)Ready-madeGarments (RMG) 20182017201620152014% 17-18% 16-17% 15-16% 14-15Month20182017201620152014% 17-18% 16-17% 15-16% 14-15 1161049811513311%6%-15%-14%Jan372569532449%-64%30%117% 53106103117113-49%3%-12%4%Feb-28879234-68%-6%170% -12110211711619%-13%1%Mar-3412414066-72%-11%111% -1161111171175%-6%0%Apr-36546033-32%-11%84% -12710512311521%-15%7%May-451039640-56%7%141% -1221141231237%-8%0%Jun-226012150-64%-50%143% -12511211213112%0%-14%Jul-3528694823%-59%44% -15512112212328%0%-1%Aug-394511339-13%-60%191% -958210313016%-21%-21%Sep-3436125160-5%-71%-22% -131961079137%-10%18%Oct-5053137151-5%-61%-9% -1191121031076%8%-4%Nov-36341051506%-67%-30% -13111912513211%-5%-5%Dec-32257514130%-67%-47% 1691,4521,2741,3861,43114%-8%-3%Total374167171,186936-42%-40%27% 169210201233246-19%4%-14%-6%YTD372569532449%-64%30%117% 300322499204091867422253462857612660707147071553 5.64%6.45%6.24%7.42%6.43%0.80%0.72%1.09%1.66%1.31% Imports - Ready-made Garments (RMG) Exports - Ready-made Garments (RMG) Total ExportsTotal Imports % Sector to Total Exports% Sector to Total Imports
- 40. (40)Exports by End of Feb - 2018Imports by End of Jan - 2018 الجاهزة املالبسReady-MadeGarments (RMG) Top 10 Countries - Sector Exports (Jan Feb ) 2018 20172016201520142013Top 10 Countries - Sector Imports(Jan) 201820172016201520142013 USA77.83725.35633.38751.32763.16738.21CHINA16.98244.96474.57851.27703.15310.08 UK13.76106.67102.02113.21141.06147.09TURKEY4.0836.1267.85127.7358.7819.41 TURKEY18.30108.53114.89111.72116.12124.67SPAIN0.1014.4259.2262.4756.9141.95 SPAIN14.64132.75102.1288.4179.1570.24BANGLADESH5.6145.1938.9730.4912.086.30 GERMANY7.0368.2062.6567.7792.54114.95UAE0.876.3911.7625.0323.6213.38 ITALY7.7875.3557.3357.9137.8033.87GERMANY0.164.6522.5921.4517.2010.87 FRANCE7.3855.7546.7439.9231.7631.89SYRIA0.000.453.428.313.005.55 BELGIUM3.6019.7318.2231.3335.8935.48INDIA4.588.832.675.839.1115.09 SAUDI ARABIA5.1436.1924.8925.4821.3219.96ITALY0.496.156.647.467.374.76 NETHERLANDS2.2212.6416.7210.4514.6014.54VIET NAM2.0112.972.602.951.823.11 % to Total Sector93%92%93%94%93%93%% to Total Sector94%91%96%96%95%93% 1,452 1,274 1,386 1,431 169 210 201 233 246 - 500 1,000 1,500 2,000 2018 2017 2016 2015 2014 Exports - Ready-made Garments (RMG) (Jan Feb ) Total Year (Jan Feb ) 416 717 1,186 936 37 25 69 53 24 - 500 1,000 1,500 2018 2017 2016 2015 2014 Imports - Ready-made Garments (RMG) Total Year (Jan) Ready-madeGarments (RMG)
- 41. (41)Exports by End of Feb - 2018Imports by End of Jan - 2018 واملنسوجات لالغزWeaving & SpinningTextile 20182017201620152014% 17-18% 16-17% 15-16% 14-15Month20182017201620152014% 17-18% 16-17% 15-16% 14-15 6264627374-4%4%-16%-1%Jan22419819919817714%-1%1%12% 4060776887-33%-23%13%-21%Feb-187226212163-17%7%30% -797394908%-22%4%Mar-220248268179-11%-8%50% -71737571-3%-3%6%Apr-2081902211609%-14%38% -8064839025%-23%-7%May-2482492542130%-2%20% -53637690-17%-16%-16%Jun-188225234207-16%-4%13% -7350776248%-36%24%Jul-28621222517435%-6%29% -7861778728%-21%-12%Aug-28022725428423%-10%-11% -575674943%-25%-21%Sep-23817719923635%-11%-15% -63727475-14%-2%-2%Oct-25321622522017%-4%2% -7366708710%-5%-19%Nov-19517221723614%-21%-8% -8466809626%-17%-17%Dec-22218422125320%-17%-12% 1028337839211,0026%-15%-8%Total2242,7232,5252,7282,4998%-7%9% 102124139142160-18%-11%-2%-12%YTD22419819919817714%-1%1%12% 300322499204091867422253462857612660707147071553 3.39%3.70%3.84%4.93%4.50%4.85%4.73%3.82%3.82%3.49%% Sector to Total Imports Total Exports % Sector to Total Exports Total Imports Exports - TextileImports - Textile
- 42. (42)Exports by End of Feb - 2018Imports by End of Jan - 2018 واملنسوجات لالغزWeaving & Spinning Top 10 Countries - Sector Exports (Jan Feb ) 2018 20172016201520142013Top 10 Countries - Sector Imports(Jan) 201820172016201520142013 TURKEY35.23290.47238.81261.79269.05266.64CHINA125.571,358.191,203.291,208.861,060.34914.58 ITALY18.08157.53161.96163.15208.13195.23INDIA16.74283.89297.36370.32337.54293.50 USA0.687.7734.6194.0196.79102.01TURKEY22.75269.80224.46238.94243.35253.17 SAUDI ARABIA2.6931.9537.7251.7824.3023.12INDONESIA10.52111.12122.87129.98112.83132.21 GERMANY3.1121.8632.7828.0631.7915.75PAKISTAN4.4060.9979.4789.9666.6689.95 PORTUGAL1.8015.1819.0632.7821.9227.61ITALY3.4862.9966.6179.5765.7976.39 FRANCE1.868.937.6721.6425.3018.81KOREA SOUTH3.2460.9854.4268.5763.4563.75 SUDAN2.7416.6212.2316.8214.3217.37USA4.0283.9244.1063.8367.0853.99 TUNISIA2.9026.7424.7618.1416.366.43GERMANY3.5056.6851.4552.1357.8046.41 INDIA0.466.053.366.5917.4533.55TAIWAN2.2318.3520.7926.4058.0568.89 % to Total Sector68%70%73%75%72%75%% to Total Sector88%87%86%85%85%83% 833 783 921 1,002 102 124 139 142 160 - 500 1,000 1,500 2018 2017 2016 2015 2014 Exports - Textile Total Year (Jan Feb ) 2,723 2,525 2,728 2,499 224 198 199 198 177 - 1,000 2,000 3,000 2018 2017 2016 2015 2014 Imports - Textile Total Year (Jan) Textile
- 43. (43)Exports by End of Feb - 2018Imports by End of Jan - 2018 شاتواملفرTextilesHomeTextile 20182017201620152014% 17-18% 16-17% 15-16% 14-15Month20182017201620152014% 17-18% 16-17% 15-16% 14-15 3838404658-2%-5%-12%-21%Jan9614191456%-58%-27%33% 2236465060-39%-21%-8%-17%Feb-5141315-64%5%-11% -5045586910%-22%-16%Mar-6182016-65%-8%21% -444355613%-20%-11%Apr-991113-5%-18%-16% -464550552%-10%-9%May-7614244%-54%-42% -35414962-15%-16%-21%Jun-681914-18%-60%35% -4331427236%-26%-41%Jul-76181220%-66%54% -4640465114%-12%-11%Aug-106211248%-69%75% -3932386121%-16%-38%Sep-64141434%-67%-5% -423944459%-11%-4%Oct-8714155%-48%-7% -4539415915%-4%-31%Nov-75182635%-72%-33% -565658651%-3%-12%Dec-106152965%-59%-50% 605224995767205%-13%-20%Total986104194205-18%-46%-5% 60758696118-20%-13%-10%-19%YTD9614191456%-58%-27%33% 300322499204091867422253462857612660707147071553 1.99%2.32%2.44%3.08%3.23%0.19%0.15%0.16%0.27%0.29% Imports - Home Textile Exports - Home Textile Total ExportsTotal Imports % Sector to Total Exports% Sector to Total Imports
- 44. (44)Exports by End of Feb - 2018Imports by End of Jan - 2018 شاتواملفرTextiles Top 10 Countries - Sector Exports (Jan Feb ) 2018 20172016201520142013Top 10 Countries - Sector Imports(Jan) 201820172016201520142013 USA18.01148.01149.85165.50173.13175.58CHINA1.4512.3126.7078.4699.0754.07 GERMANY6.6347.7439.0942.6068.2867.29TURKEY5.1141.4849.7372.8049.7324.89 ITALY4.8140.5738.1244.3955.9152.74SAUDI ARABIA0.421.270.939.7111.079.51 UK3.9434.0133.8752.8561.9154.17SYRIA0.000.010.030.320.693.70 FRANCE3.2429.7020.7621.0333.1733.56UAE0.656.994.843.274.243.59 SPAIN3.3520.8624.9625.0932.6226.54INDIA0.180.871.686.305.871.72 SAUDI ARABIA1.3716.0020.3528.6027.1232.12ITALY0.172.051.261.359.982.67 NETHERLANDS2.0516.2914.2217.5334.6225.34JORDAN0.054.762.724.200.941.16 CANADA2.2028.5721.6518.9721.0021.58BELGIUM0.064.212.612.402.003.19 SWEDEN0.9311.179.1111.5019.4317.67SPAIN0.011.111.863.083.072.83 % to Total Sector78%75%75%74%73%73%% to Total Sector91%88%89%94%91%90% 522 499 576 720 60 75 86 96 118 - 200 400 600 800 2018 2017 2016 2015 2014 Exports - Home Textile Total Year (Jan Feb ) 86 104 194 205 9 6 14 19 14 - 100 200 300 2018 2017 2016 2015 2014 Imports - Home Textile Total Year (Jan) HomeTextile
- 45. (45)Exports by End of Feb - 2018Imports by End of Jan - 2018 تجميل اترومستحضطبيةصناعاتPharmaceutical &CosmeticsMedicalSector 20182017201620152014% 17-18% 16-17% 15-16% 14-15Month20182017201620152014% 17-18% 16-17% 15-16% 14-15 32303539465%-12%-12%-14%Jan221245226225190-10%8%1%18% 1933414249-41%-21%-2%-14%Feb-2482282311599%-2%46% -39435551-10%-22%7%Mar-249299290238-17%3%22% -42454249-7%6%-15%Apr-225249250206-10%0%21% -36423853-13%9%-28%May-257265269286-3%-1%-6% -34514469-33%17%-37%Jun-188252272256-25%-7%6% -4338384013%1%-5%Jul-2512392632325%-9%13% -41443952-6%12%-25%Aug-223275310262-19%-11%19% -34363651-4%0%-30%Sep-2292142132337%1%-9% -444241405%2%2%Oct-2692672792541%-4%10% -454444541%0%-18%Nov-216251223280-14%13%-20% -53545367-3%3%-22%Dec-2412292832815%-19%1% 51475515511622-8%1%-18%Total2212,8402,9933,1072,877-5%-4%8% 5163768194-19%-17%-7%-14%YTD221245226225190-10%8%1%18% 300322499204091867422253462857612660707147071553 1.70%2.11%2.52%2.74%2.79%4.77%4.93%4.53%4.35%4.02% Exports - Medical SectorImports - Medical Sector Total ExportsTotal Imports % Sector to Total Exports% Sector to Total Imports
- 46. (46)Exports by End of Feb - 2018Imports by End of Jan - 2018 تجميل اترومستحضطبيةصناعاتPharmaceutical &Cosmetics Top 10 Countries - Sector Exports (Jan Feb ) 2018 20172016201520142013Top 10 Countries - Sector Imports(Jan) 201820172016201520142013 SAUDI ARABIA7.2464.0668.4570.8074.3455.05GERMANY35.14743.921,090.851,161.451,091.061,091.11 SUDAN2.9349.5144.5153.3755.0961.80SWITZERLAND47.28426.39406.00351.58329.48271.10 IRAQ4.1229.7350.1238.5751.0869.36FRANCE17.29266.06296.36280.27229.30182.26 YEMEN3.9653.1549.3919.6853.0049.15USA20.45228.16228.56205.85228.85213.15 UAE3.8030.2034.9735.2934.4725.63CHINA15.04152.63150.18148.63118.61105.60 JORDAN1.8918.0026.5725.5023.5322.10UK5.17142.1480.64142.51131.1282.53 GERMANY2.5221.8922.2723.0520.7619.13ITALY6.99136.2495.56101.7475.1269.97 ROMANIA2.5820.4318.5716.7117.3317.97SAUDI ARABIA2.9735.1154.6682.54100.13105.93 TURKEY1.0916.1510.9315.6421.9625.34NETHERLANDS4.5465.0783.1173.4272.4354.40 LEBANON1.8812.8917.1521.8325.4923.54DENMARK5.9341.4641.9257.5369.9458.89 % to Total Sector63%67%67%63%61%63%% to Total Sector73%79%84%84%85%84% 475 515 511 622 51 63 76 81 94 - 200 400 600 800 2018 2017 2016 2015 2014 Exports - Medical Sector Total Year (Jan Feb ) 2,840 2,993 3,107 2,877 221 245 226 225 190 - 1,000 2,000 3,000 4,000 2018 2017 2016 2015 2014 Imports - Medical Sector Total Year (Jan) MedicalSector
- 47. (47)Exports by End of Feb - 2018Imports by End of Jan - 2018 والحرفيةاليدويةالصناعاتHandicraft Handicrafts 20182017201620152014% 17-18% 16-17% 15-16% 14-15Month20182017201620152014% 17-18% 16-17% 15-16% 14-15 141219233616%-38%-17%-38%Jan292326191823%-10%38%2% 13122529456%-51%-13%-36%Feb-19292117-34%39%25% -17273838-37%-29%0%Mar-24333023-27%8%32% -19223026-15%-26%15%Apr-191822156%-19%47% -19232743-19%-12%-38%May-2118242419%-27%0% -14192533-23%-25%-26%Jun-17182925-5%-40%17% -1815343019%-56%11%Jul-2620262131%-23%26% -1715284019%-48%-30%Aug-2521322820%-34%13% -1511274132%-58%-34%Sep-2018232710%-21%-13% -19202634-8%-21%-24%Oct-232224243%-7%0% -181722416%-24%-47%Nov-2521272623%-24%5% -2317354133%-52%-15%Dec-2820343036%-39%14% 27202230342449-12%-33%-24%Total292722643122783%-15%12% 272444518111%-45%-14%-37%YTD292326191823%-10%38%2% 300322499204091867422253462857612660707147071553 0.89%0.90%1.13%1.83%2.02%0.62%0.47%0.40%0.44%0.39% % Sector to Total Exports% Sector to Total Imports Total ExportsTotal Imports Imports - Handicrafts Exports - Handicrafts
- 48. (48)Exports by End of Feb - 2018Imports by End of Jan - 2018 والحرفيةاليدويةالصناعاتHandicraft Top 10 Countries - Sector Exports (Jan Feb ) 2018 20172016201520142013Top 10 Countries - Sector Imports(Jan) 201820172016201520142013 USA0.083.6031.2188.1388.0785.90CHINA11.77116.09127.49151.25130.85111.33 CHINA0.011.361.9611.6325.1239.91TURKEY2.3525.0118.0725.5422.5819.96 UAE0.7012.569.9014.6831.3139.07MALAYSIA1.9026.1316.6129.9418.3420.69 TURKEY2.9228.6420.8129.6736.3131.94INDONESIA0.012.094.764.8616.3516.96 SAUDI ARABIA1.049.7519.7429.4725.9722.28UAE2.4719.4811.667.878.4512.09 ITALY0.333.626.2911.2136.1626.35ITALY1.0812.5014.4812.349.779.10 SUDAN3.0219.1014.5320.0014.9111.74GERMANY0.287.1410.8011.416.375.67 GERMANY2.3014.0912.499.7715.579.64BELGIUM0.423.986.004.846.964.69 SYRIA1.457.292.504.9811.709.97USA0.233.334.746.656.455.11 FRANCE0.212.243.8011.3719.6311.61INDIA0.834.756.366.136.513.46 % to Total Sector45%51%54%68%68%67%% to Total Sector74%81%84%84%84%84% 202 230 342 449 27 24 44 51 81 - 200 400 600 2018 2017 2016 2015 2014 Exports - Handicrafts Total Year (Jan Feb ) 272 264 312 278 29 23 26 19 18 - 100 200 300 400 2018 2017 2016 2015 2014 Imports - Handicrafts Total Year (Jan) Handicrafts
- 49. (49)Exports by End of Feb - 2018Imports by End of Jan - 2018 األثاثFurnitureFurniture 20182017201620152014% 17-18% 16-17% 15-16% 14-15Month20182017201620152014% 17-18% 16-17% 15-16% 14-15 2534263027-26%35%-14%9%Jan14111213117214026%-15%-23%23% 1927302830-30%-10%8%-7%Feb-97164120142-41%38%-16% -31333429-7%-1%16%Mar-155181160156-14%13%3% -30303233-2%-5%-3%Apr-82168143131-51%17%10% -33363338-10%9%-12%May-111182168232-39%9%-28% -24373329-35%12%12%Jun-116149216223-22%-31%-3% -2421242914%-14%-18%Jul-139151193175-8%-22%10% -28342829-17%23%-3%Aug-137166211213-18%-21%-1% -14232632-41%-11%-17%Sep-119122159166-3%-23%-4% -26262018-1%31%11%Oct-148152159173-3%-4%-8% -29362729-20%35%-9%Nov-15310919319141%-44%1% -32393531-17%13%11%Dec-14011716416319%-28%1% 44332372348354-11%7%-2%Total1411,5081,7932,0592,105-16%-13%-2% 4461565757-28%10%-3%1%YTD14111213117214026%-15%-23%23% 300322499204091867422253462857612660707147071553 1.48%1.48%1.82%1.87%1.59%3.05%2.62%2.71%2.88%2.94% Imports - Furniture Exports - Furniture Total ExportsTotal Imports % Sector to Total Exports% Sector to Total Imports
- 50. (50)Exports by End of Feb - 2018Imports by End of Jan - 2018 األثاثFurniture Top 10 Countries - Sector Exports (Jan Feb ) 2018 20172016201520142013Top 10 Countries - Sector Imports(Jan) 201820172016201520142013 SAUDI ARABIA8.7369.81104.14121.52125.11114.86RUSSIA23.04360.22481.00524.48491.48363.41 UAE5.9246.7455.7652.7746.2544.22SWEDEN37.57254.52228.34283.68408.36253.94 IRAQ7.7742.7632.8925.9222.7627.09FINLAND24.42227.47274.05270.33298.62227.89 JORDAN3.3724.6633.1421.5921.6820.60CHINA14.09167.66223.59257.81232.16212.94 QATAR0.4110.9625.2528.5727.3225.36ROMANIA5.3165.8797.83153.17114.57107.85 OMAN4.7421.0518.2316.4114.4610.52CROATIA4.8276.9377.6398.6076.8861.80 LEBANON2.4615.7915.3910.6710.7111.54GERMANY3.0033.4845.5736.1776.2544.06 SUDAN3.1331.1319.599.656.446.66LATVIA2.7227.7539.0046.4961.5237.86 MOROCCO0.967.086.197.568.438.69MALAYSIA0.9118.6831.1466.8248.2348.71 ITALY0.595.175.144.575.497.16USA1.8338.0249.6254.8149.0635.81 % to Total Sector86%83%85%86%82%79%% to Total Sector83%84%86%87%88%89% 332 372 348 354 44 61 56 57 57 - 100 200 300 400 2018 2017 2016 2015 2014 Exports - Furniture Total Year (Jan Feb ) 1,508 1,793 2,059 2,105 141 112 131 172 140 - 1,000 2,000 3,000 2018 2017 2016 2015 2014 Imports - Furniture Total Year (Jan) Furniture
- 51. (51)Exports by End of Feb - 2018Imports by End of Jan - 2018 الجلدية املنتجاتLeatherProductsLeatherProducts 20182017201620152014% 17-18% 16-17% 15-16% 14-15Month20182017201620152014% 17-18% 16-17% 15-16% 14-15 981215189%-28%-22%-15%Jan131020121123%-47%63%13% 59121521-51%-20%-21%-29%Feb-10242013-56%18%56% -13151719-14%-11%-14%Mar-11313813-65%-17%188% -131213207%-9%-33%Apr-11131711-15%-22%48% -8111321-31%-9%-41%May-14152114-8%-27%49% -119161715%-40%-10%Jun-11253220-57%-24%60% -9101116-14%-5%-34%Jul-15162822-7%-42%29% -10121116-21%11%-32%Aug-16163415-1%-53%132% -891524-10%-42%-36%Sep-12152818-19%-47%57% -9812108%-34%24%Oct-171633177%-52%91% -9918164%-51%16%Nov-11132316-14%-41%42% -111014159%-29%-11%Dec-1311261614%-58%66% 14118129169214-9%-24%-21%Total13152215312185-29%-31%68% 1418233038-23%-24%-21%-23%YTD131020121123%-47%63%13% 300322499204091867422253462857612660707147071553 0.46%0.52%0.63%0.91%0.96%0.27%0.26%0.33%0.44%0.26% Exports - Leather ProductsImports - Leather Products Total ExportsTotal Imports % Sector to Total Exports% Sector to Total Imports
- 52. (52)Exports by End of Feb - 2018Imports by End of Jan - 2018 الجلدية املنتجاتLeatherProducts 118 129 169 214 14 18 23 30 38 - 100 200 300 2018 2017 2016 2015 2014 Exports - Leather Products Total Year (Jan Feb ) 152 215 312 185 13 10 20 12 11 - 100 200 300 400 2018 2017 2016 2015 2014 Imports - Leather Products Total Year (Jan) LeatherProducts Top 10 Countries - Sector Exports (Jan Feb ) 2018 20172016201520142013Top 10 Countries - Sector Imports(Jan) 201820172016201520142013 PORTUGAL3.5633.7241.8447.7839.5032.62CHINA9.02108.82153.31236.21131.69119.45 ITALY3.8122.0123.9028.0148.5143.10ITALY0.529.6310.2611.879.607.75 SPAIN2.6121.2821.0226.9043.9736.81SPAIN0.092.2210.9210.646.974.08 INDIA1.399.707.5213.9016.4810.94GERMANY0.282.286.406.775.614.11 CHINA0.3710.256.5313.5317.1819.35VIET NAM0.604.876.265.633.943.40 TURKEY0.603.885.085.3711.4211.86INDONESIA0.182.953.305.384.253.65 HONG KONG0.463.136.255.646.697.43USA0.032.041.051.802.162.56 VIET NAM0.133.602.825.222.563.10TURKEY0.433.503.995.181.902.50 UK0.000.080.722.763.553.74UK0.010.982.223.483.242.09 GREECE0.292.132.201.700.950.36LEBANON0.221.805.983.861.520.41 % to Total Sector96%93%91%89%89%90%% to Total Sector90%92%95%93%92%92%
- 53. (53)Exports by End of Feb - 2018Imports by End of Jan - 2018 الفنيةواملصنفات الكتبPrinted Materials & MediaMedia 20182017201620152014% 17-18% 16-17% 15-16% 14-15Month20182017201620152014% 17-18% 16-17% 15-16% 14-15 11511-12%-84%530%-3%Jan4488612%-54%-9%48% 01321-39%-80%43%60%Feb-2652-66%11%133% -1321-64%70%79%Mar-2453-59%-9%39% -1121-6%-20%105%Apr-2353-26%-40%83% -1211-67%171%-24%May-2633-72%95%5% -0116-57%5%-86%Jun-3346-7%-31%-26% -11113%0%-40%Jul-410137-53%-28%90% -2111200%-30%-6%Aug-9101414-14%-24%0% -0143-27%-85%43%Sep-781111-15%-23%2% -113114%-64%158%Oct-5778-33%5%-10% -0121-16%-74%66%Nov-2364-32%-46%31% -111114%-58%100%Dec-3465-26%-41%14% 110191918-48%-1%5%Total444728771-39%-17%22% 11832-23%-83%186%34%YTD4488612%-54%-9%48% 300322499204091867422253462857612660707147071553 0.04%0.04%0.09%0.10%0.08%0.09%0.08%0.11%0.12%0.10% Imports - Media Exports - Media Total Imports % Sector to Total Exports% Sector to Total Imports Total Exports
- 54. (54)Exports by End of Feb - 2018Imports by End of Jan - 2018 الفنيةواملصنفات الكتبPrinted Materials & Media Top 10 Countries - Sector Exports (Jan Feb ) 2018 20172016201520142013Top 10 Countries - Sector Imports(Jan) 201820172016201520142013 LIBYA-1.657.227.848.2211.51UK0.9511.9330.7645.5431.1528.04 ALGERIA0.040.962.853.642.594.56USA0.335.159.289.278.288.99 SAUDI ARABIA0.451.151.451.871.161.76GERMANY0.044.986.917.797.548.85 NETHERLANDS0.050.011.940.170.121.65CHINA0.414.263.553.652.5910.60 SUDAN0.020.820.711.150.580.65FRANCE0.052.172.522.463.075.14 UK0.000.110.220.160.170.87LEBANON0.841.912.052.531.882.12 NIGERIA0.050.210.280.290.900.71GREECE0.051.602.502.732.952.03 UAE0.040.440.530.390.340.39ITALY0.201.261.351.992.171.51 USA0.000.110.290.360.500.34UAE0.061.033.031.561.731.49 JORDAN0.010.540.340.360.320.27KOREA SOUTH0.032.621.572.271.271.12 % to Total Sector63%60%82%83%81%87%% to Total Sector74%84%88%92%88%88% 10 19 19 18 1 1 8 3 2 - 10 20 30 2018 2017 2016 2015 2014 Exports - Media Total Year (Jan Feb ) 44 72 87 71 4 4 8 8 6 - 50 100 2018 2017 2016 2015 2014 Imports - Media Total Year (Jan) Media
- 55. Exports & Imports Sub-sectors (May SpanovermorethanoneCouncil)
- 56. (56)Exports by End of Feb - 2018Imports by End of Jan - 2018 Sectors - Buildings & Metalic Ind. Misc. Metals0.397.426.789.2510.2552.908.29104.43130.06122.47100.7088.33 Aluminiums74.18474.22385.78454.80563.20695.2021.64308.94377.32420.54348.97387.30 Sanitary-ware15.61135.44118.81139.59153.52104.804.5733.2123.9737.3425.9729.83 Cement12.1996.7762.8270.43113.59149.760.568.427.29125.72435.45136.73 Insulating Materials7.1023.1719.8324.1541.6946.631.8815.9916.6420.2922.5821.42 Steel Bridges, Tanks, Nails & Tableware20.87145.24192.11286.39266.18317.22115.311,670.091,747.171,799.551,822.071,429.79 Iron & Steel83.27869.96440.83294.85685.341,035.91308.733,257.253,657.704,050.214,557.703,863.24 Jewels419.052,092.402,576.91637.84661.59929.252.26184.8682.50185.57930.331,458.78 Metal Ashes (Raw & Concentrates)0.9114.1015.1511.5439.2329.3048.59860.82443.27300.03525.86702.88 Marble & Granite24.73187.17223.71246.25320.68352.048.2354.2463.9757.7352.8642.21 lead & it's products3.0010.6816.0012.349.815.670.6122.9330.0426.0221.6427.65 Glass & Glass Products38.16341.61240.29214.94246.14234.7312.77101.8891.84124.18104.0191.40 Zinc & Zinc Products0.202.321.841.362.834.767.7978.7856.3154.1554.7049.08 Ceramics & Tiles15.41158.74122.40177.86275.24360.693.6348.2462.5289.2179.4358.01 Tableware, Knives & Cutting tools4.6155.7354.0857.9043.9155.8912.35118.34122.87124.28130.80124.79 Tin & Tin Products--0.00-0.000.010.995.304.114.734.774.52 Magnesium, Manganese & it's Products0.000.000.001.854.981.411.819.125.242.623.615.58 Other Furnitures2.3718.6814.7612.5516.8821.2416.99173.82127.80145.76177.91198.69 Quarry Stones & Metals19.08236.60252.34269.29260.62326.8224.68128.80105.63126.95141.34133.16 Pipes0.6710.7117.2422.5217.6222.9080.38990.09966.37810.72741.27917.39 Copper & Copper Products26.00239.47164.42196.27264.80297.5829.40706.60784.86873.81958.411,036.99 Nickel & Nickel Products1.3117.7317.5530.0844.3061.220.636.005.457.184.254.45 201520142013 ExportsImports (Jan Feb ) 2018 (Jan) 2018 20172016 20172016201520142013 BuildingMaterials - GeneralSub-sectors
- 57. (57)Exports by End of Feb - 2018Imports by End of Jan - 2018 Sectors - Chemicals & Fertilizer Inks and paints16.09137.63126.08133.03152.81150.3522.59296.45300.77306.99326.01314.73 Batteries215.501,756.371,609.101,755.701,970.721,214.14354.744,463.644,680.634,867.704,928.384,005.87 Charcoal32.83340.15308.61361.52587.43834.7288.531,143.431,430.661,857.452,102.852,283.92 Organic Chemicals70.32290.33119.8057.22290.67365.0490.931,200.361,472.521,422.301,529.231,319.90 Inorganic Chemicals59.08376.04223.94287.05426.54508.6921.03353.82247.69283.45321.83301.24 Misc. Chemicals37.13143.33133.26175.72258.08231.2470.83961.60901.58944.81852.41797.22 Paper Products65.65528.99451.96415.67478.64476.3798.471,167.121,243.121,340.301,291.901,315.98 Detergents37.13323.85287.87210.13238.34223.5827.28245.16254.62331.45347.40351.13 Adhesives8.0148.3142.7348.6068.0048.648.62113.73123.28131.56141.19123.58 Films Raw Materials-0.120.270.700.250.182.5434.3945.7849.8550.1045.43 Fertilizers116.431,092.12818.14377.70659.70983.1214.89128.07129.94204.29176.84160.17 Glass48.98431.35326.66314.99337.56317.3218.24152.75145.70184.77160.82152.73 Carbon Products0.000.170.080.050.040.0118.31234.98188.72195.54192.90171.87 Plastics174.721,541.331,172.771,268.341,636.821,380.82269.413,159.243,249.453,618.193,551.503,237.48 Rubbers13.3684.9982.35104.43109.44110.7765.84778.49922.78909.80997.67950.62 Imports (Jan Feb ) 2018 20172016201520142013 (Jan) 2018 20172016201520142013 Exports Chemicals & Fertilizers - GeneralSub-sectors
- 58. (58)Exports by End of Feb - 2018Imports by End of Jan - 2018 Sectors - Eng. & Elec. Electric Appliances93.47772.02669.43707.43715.45125.52115.621,170.241,207.171,546.581,649.611,069.88 Home Appliances28.46343.70271.25309.72443.65355.3156.80806.91854.68977.78961.64969.59 Tableware & Kitchen Tools0.376.727.2112.1412.9917.770.314.135.5011.0811.2112.33 Carpentry Tools0.021.120.821.680.941.529.9498.1896.0697.64103.9685.50 Weapons-0.210.011.450.790.3022.185.752.8749.5642.2225.20 Agricultural Equipments0.094.000.982.974.642.1126.09268.57390.15478.45465.51412.92 Lifftings and Drilling Machines0.4111.477.307.487.4318.76119.541,554.222,076.211,965.161,795.021,763.21 Electrical & Electronic Industries17.35166.35144.30200.40183.79177.19190.072,726.293,023.292,968.452,921.852,408.62 Pumps, Compressors & Genetrators1.9516.9018.3622.1719.7126.6672.731,408.661,568.101,120.511,234.571,372.29 Ships and Boats0.090.890.871.280.531.1223.7941.031,359.27445.6451.3050.95 Blades4.4050.6450.8953.7040.7651.122.0821.1526.3124.6725.5433.64 Other Industries6.5648.1353.7561.6873.1969.7482.521,113.061,315.651,336.661,268.341,103.22 Fire Extinguishers0.331.941.8610.492.021.914.5355.1563.8172.9950.5344.16 Railway Locomotives & Train Cars-0.050.120.150.171.311.3211.6179.59172.6743.6036.40 Cables60.17519.31443.81496.01768.06781.9825.90354.79386.06319.06298.05317.06 Door Locks0.367.066.558.759.5852.277.2384.87106.0396.8381.4571.13 Aircraft& Parts-0.00-0.08---0.000.821.3763.6335.02 Metals7.7640.6923.9825.2328.9724.1235.94751.47773.97925.33980.46989.54 Auto Components86.81698.15720.40752.53801.68764.88122.401,433.841,903.572,051.981,934.171,570.82 Metal Forming Tools0.398.976.6621.6816.4020.22103.261,281.331,404.771,472.311,487.581,517.84 Means of Transportation2.2584.60129.2680.69100.94138.80193.192,084.653,585.464,379.513,674.691,855.60 20142013 20142013 (Jan) 2018 201720162015 ExportsImports (Jan Feb ) 2018 201720162015 Eng.& Electronics - GeneralSub-sectors
- 59. (59)Exports by End of Feb - 2018Imports by End of Jan - 2018 Sectors - Food Other Cheeses0.166.454.465.044.565.521.7616.8521.7822.5424.4022.70 Grated Cheeses0.827.327.214.507.323.420.205.325.796.566.194.63 Fish3.3430.7432.9026.2230.0922.129.0081.3794.1287.6993.72134.36 Animals Food0.9577.4880.7868.22111.8797.7049.94863.391,366.031,171.901,120.04876.71 Dairy Products3.9029.6624.0021.6430.5633.8111.9897.13141.21197.42204.57147.64 Seeds & Oleaginous Fruits8.7181.0692.43106.78110.8680.250.466.378.097.805.945.65 Dried Onion2.9535.6833.0036.6434.7626.01-0.361.180.580.490.55 Preserved Onion-0.26-0.080.120.07------ Potato9.7882.7670.2380.7593.9586.560.424.207.009.064.564.00 Coffee2.7819.1018.9518.3316.0823.8310.81121.73112.59111.2686.56104.86 Spices0.382.462.681.681.991.831.7056.2466.3165.3553.9350.25 Birds' eggs0.100.261.451.441.200.94--1.341.362.171.47 Tobacco & its Substitutes1.6517.7320.1934.12105.72126.8010.1095.18159.01274.52190.58196.25 White Cheese8.8376.9778.7391.57104.25102.530.080.992.522.883.561.74 Roumi Cheese2.8711.0111.638.548.064.161.9515.4918.5423.3128.3621.77 Cooked Cheese25.36167.63158.33221.09242.68246.961.0021.8526.7423.8422.1920.45 Soups2.4819.5428.0431.2330.1336.800.090.141.210.180.150.22 White Chocolate2.4120.7844.1518.4421.0125.110.836.287.9318.6915.5713.02 Artichoke2.9236.1738.5631.5827.6731.42--0.080.060.10- Dried Vegetables1.2812.6812.6110.8810.089.430.181.011.211.591.691.11 Frozen Vegetables15.98107.81109.51112.53108.50137.280.242.514.124.955.434.18 Yeast6.4056.4437.8939.5538.8427.291.006.8810.6912.9010.068.57 Pickles0.010.040.220.570.190.470.020.060.310.110.030.02 Olive Oil3.0310.9711.557.435.066.400.582.643.055.836.477.64 Olive13.7394.1199.9669.5986.9668.560.120.510.340.990.960.77 201520142013 ExportsImports (Jan Feb ) 2018 20172016201520142013 (Jan) 2018 20172016 ProcessedFood- GeneralSub-sectors
- 60. (60)Exports by End of Feb - 2018Imports by End of Jan - 2018 Sectors - Food Non-olive Oils6.9270.6859.6357.4873.8375.7695.041,127.231,110.28913.121,259.231,365.21 Aromatic Oils34.17430.29307.92278.90335.48262.337.78101.99113.7398.6990.7894.95 Sugar Products12.30136.16280.55142.88177.67217.691.0418.0834.26122.1491.21145.67 Tea0.677.4219.0219.0824.7123.2535.69273.17316.88290.47355.73297.24 Fats4.2763.4046.7441.7249.28128.752.3123.0527.8520.7024.7119.96 Chocolates (non-white)15.4496.4299.95111.17141.1884.832.2925.5039.2745.4338.2035.88 Shellac16.4020.7289.92120.9666.2672.071.198.5910.8210.6410.9313.28 Tahina and Halawa0.634.174.614.155.063.13-0.140.050.090.050.06 Black Honey (Moulase)2.2521.0421.5821.9323.3030.660.02-0.300.000.060.00 Natural Honey0.313.564.013.683.213.240.010.430.600.420.260.14 Juices & Concentrates10.6487.7874.7484.45101.6189.710.599.9857.6270.5560.0646.19 Bones0.171.601.772.680.970.33------ Strawberry14.8466.8647.7445.3247.5927.03-0.680.670.370.470.58 Dried Fruits17.0242.4046.2738.3053.7743.362.0714.8730.4833.9028.2230.08 Frozen Fruits0.241.932.794.843.431.910.161.131.271.102.291.92 Cocoa & Cocoa Products2.7133.7848.3245.1042.1547.317.1476.0596.5893.5488.9787.53 Meat& Offal0.715.346.561.922.591.55114.581,545.911,778.302,027.891,660.261,167.91 Cereals' Products12.3482.6486.5381.0773.9984.198.8099.45172.95216.60197.00173.23 Vegetables' Products8.3166.8658.2860.2355.9948.992.5812.5024.3528.9721.6727.49 Misc Food Products9.2990.16106.69111.27120.34106.1611.98178.45220.46228.96206.95131.68 Fruits' Products5.1244.5429.2328.4026.7631.410.7411.9110.5222.9020.3414.60 MeatProducts0.894.271.2613.206.274.7512.3987.52210.83205.76188.22175.86 Jam2.4727.2128.2629.2948.0431.930.187.1011.8210.379.204.68 Alcoholics & Vinegar1.2934.348.877.546.9213.292.9328.4729.3346.7659.0585.62 Guts & Intestines2.0122.9819.6222.5120.0413.232.8435.6229.6229.4141.1823.39 Pasta7.0052.5539.1966.0248.5859.120.010.601.403.913.482.73 Nuts-0.241.210.902.970.773.5031.4851.6856.7653.1145.04 Salt3.8014.8310.6512.578.9213.780.010.120.160.751.341.01 Millings Products18.07122.1598.29107.4465.2556.101.8321.1327.8122.7817.6812.38 Coloring Materials0.010.100.050.080.340.200.628.1011.739.118.858.03 Albumen Materials1.047.575.725.5020.527.262.5026.6227.7931.3436.2534.91 201520142013 (Jan Feb ) 2018 20172016201520142013 (Jan) 2018 20172016 ExportsImports ProcessedFood- GeneralSub-sectors
- 61. (61)Exports by End of Feb - 2018Imports by End of Jan - 2018 Sectors - Agro (Detailed) Other Agricultural8.1979.5875.3246.9555.8452.2619.45138.1397.9098.0067.47130.05 Rice--30.1077.0629.84213.292.1850.7245.2626.4223.5211.40 Grains0.281.412.471.861.511.02134.341,785.941,875.181,834.742,031.752,579.74 Onion and Garlic18.81232.46226.82277.63174.75211.240.084.693.677.8611.725.41 Potato35.23273.06179.18239.02332.83211.715.3785.4099.1577.28111.33126.12 Vegetables26.58145.93162.19174.05185.78177.480.090.260.592.212.051.57 CutFlowers12.6046.9641.9434.5940.7234.350.101.741.121.061.371.50 Fruites23.93368.50374.31376.37371.97376.7517.91254.55457.87513.57353.25247.86 Peanuts & Legumes26.39163.04163.84214.36345.67217.0825.38339.82456.54468.87453.04613.74 Citrus160.24597.34558.16521.29485.05528.840.010.030.040.020.120.24 Medicinal & Aromatics5.8057.5259.5155.9054.1153.793.9038.5043.5251.4140.9547.90 Palms15.7733.5240.0233.9649.6233.960.283.525.1212.369.416.42 ExportsImports (Jan Feb ) 2018 20172016201520142013 (Jan) 2018 20172016201520142013 Agro(FreshProduce)- GeneralSub-sectors
- 62. (62)Exports by End of Feb - 2018Imports by End of Jan - 2018 RMG - Manufacturing Code Accessories-0.160.020.020.110.270.673.085.958.885.374.66 Woven105.52982.30883.42901.34908.80926.1728.08332.52607.771,050.34865.93404.99 Knits63.71469.43390.41484.78522.18503.348.9581.26104.89130.6868.1655.23 RMG - Dress Code Sport'sWear33.40226.79193.93101.3594.58110.080.687.4010.5223.0417.6212.08 Kids Wear1.2515.6216.3020.0527.3130.078.3094.04198.31265.76172.0440.69 Accessories0.819.605.144.275.244.883.6629.1039.0066.1456.0124.40 Others RMG18.66255.14193.92251.57265.34242.964.144.505.698.7920.9017.32 Underwear & Nightwear4.0839.9034.1630.5039.8949.721.1519.44105.61274.61202.9035.43 Formal42.47356.38434.86484.70454.94478.2111.00207.15290.81461.39413.47287.25 Casual68.56548.45395.54493.71543.79513.868.7655.2468.6990.1956.5147.71 ExportsImports ExportsImports (Jan Feb ) 2018 20172016201520142013 (Jan) 2018 201720162015 (Jan) 2018 201720162015 (Jan Feb ) 2018 201720162015 20142013 2014201320142013 Ready-madeGarments (RMG)- GeneralSub-sectors
- 63. (63)Exports by End of Feb - 2018Imports by End of Jan - 2018 Sectors - Weaving & Spinning Filler, felt, for Aminsojat11.7494.9948.8943.7639.714.6710.10153.15160.16143.98133.76131.20 Woven fabrics1.5023.8370.53188.93242.97205.039.1896.8987.0087.9195.4366.66 Knitted or crocheted fabrics5.5344.1832.132.000.650.5719.36192.66210.69194.46117.03130.04 Man-made fibers10.4286.0379.2676.91102.57113.3552.34726.41558.46622.68588.51492.52 Other vegetable textile fibers4.1618.9019.1418.9220.2216.331.7328.1225.2529.4228.5931.44 Natural silk0.081.100.931.141.712.060.017.180.120.220.390.28 Cotton Sewing42.81376.42370.42389.24386.32399.5327.48487.17484.06553.51505.17514.81 Synthetic Fibres15.5196.1473.6692.7594.85106.5294.51940.03881.31966.58916.80908.00 Animal Wool & Dander6.1965.3160.2855.7056.9245.005.8851.1270.3175.2954.0465.31 Tissues0.010.261.4722.8023.4718.043.0637.9946.6250.9954.0457.13 20152014 ExportsImports (Jan Feb ) 2018 201720162013 (Jan) 2018 20172016201520142013 Textile- GeneralSub-sectors
- 64. (64)Exports by End of Feb - 2018Imports by End of Jan - 2018 Sectors - Homewear Blankets-0.310.660.551.831.930.041.041.1027.6639.1924.35 Bed Table Linens10.4573.2645.9141.9444.7486.251.5711.4223.4244.6053.0528.78 Sacks Bags Tents and Other Textiles5.4330.5729.3435.7843.6138.291.7023.1122.6121.8630.6919.86 Curtains Drapes & Furnishing Articles3.4323.9521.7431.7235.7836.210.446.3112.2012.1314.455.31 Carpets Rugs Fioor Covering-Knotted &Woven29.80306.28287.83328.06399.85400.015.5340.5141.3077.8362.1738.53 Carpets Rugs Fioor Covering-Hand Made2.1811.7010.5312.6512.619.200.096.877.8813.387.656.32 Mattresses-0.020.200.790.190.000.030.381.130.810.641.00 Terry Towels12.47101.85128.63153.18213.52155.870.191.772.464.825.121.36 (Jan) 2018 20172016 (Jan Feb ) 2018 20172016201520142013 ExportsImports 201520142013 HomeTextile- GeneralSub-sectors
- 65. (65)Exports by End of Feb - 2018Imports by End of Jan - 2018 Sectors - Pharma Misc. Medicines22.77232.81229.62210.15295.74288.47161.921,863.741,938.201,985.201,876.711,708.75 Cosmetics73.31728.45599.56591.46702.33631.0328.15386.30393.85466.30410.75463.86 Medical Supplies61.13539.91533.92577.14639.81666.3897.571,425.151,559.681,553.321,447.961,300.01 2016201520142013 (Jan) 2018 2017201620152014 ExportsImports (Jan Feb ) 2018 20172013 MedicalSector- GeneralSub-sectors
- 66. (66)Exports by End of Feb - 2018Imports by End of Jan - 2018 Sectors - Furniture Wooden Furniture41.06285.41331.37314.42308.07311.426.6394.28148.23161.30139.97107.24 Other Furnitures0.010.300.330.310.100.020.517.679.319.937.777.11 Metalic Furniture1.6519.4813.4514.6113.0613.772.5629.4836.3247.2530.1924.00 Bambo Furniture0.010.090.000.100.050.02------ Plastic Furniture0.090.821.450.280.380.430.263.986.5710.039.436.95 Wood0.7420.1220.1714.3418.3517.95108.22997.781,154.021,353.121,493.341,076.35 Corks-0.160.390.350.770.260.080.700.680.840.861.02 Hings & Fittings0.081.281.320.872.032.325.1152.8866.6655.7847.8640.55 Wooden Products0.694.593.593.5111.106.1018.22328.48380.77430.23383.15309.12 ExportsImports (Jan Feb ) 2018 20172016201520142013 (Jan) 2018 20172016201520142013 Furniture - GeneralSub-sectors
- 67. (67)Exports by End of Feb - 2018Imports by End of Jan - 2018 Sectors - Leather Shoes1.134.775.949.1412.2710.718.6998.62136.41213.60111.44105.27 Clothing - and leather products0.041.350.840.982.953.573.3147.1267.5185.6865.2452.76 Other Leather-0.010.030.010.050.550.000.640.680.710.550.33 Leather tanning12.58111.44122.52158.98198.62174.260.595.6010.7011.978.034.91 ExportsImports (Jan Feb ) 2018 20172016201520142013 (Jan) 2018 20172016201520142013 LeatherProducts - GeneralSub-sectors
- 68. ArabRepublicof Egypt العربيةمصرجمهورية داتروالوااترالصاد علىللرقابةالعامةالهيئة ـديرـقوالت ـكرشالـرــفوا ـعم Thank You …