Download to read offline
![Drawpacks Business Diagrams Drawpack.com offers these premium Business Diagrams for students and professionals around the globe for their personal use for free. Please enjoy these Business Diagrams. You can send these slides to your personal contacts who might be interested in Business Diagrams. For further information about our service please contact us: [email_address] Please find our membership offer on http:// www.drawpack.com](https://image.slidesharecdn.com/efficiencyratioiidiagram-110308025347-phpapp01/85/Efficiency-ratio-ii-diagram-2-320.jpg)

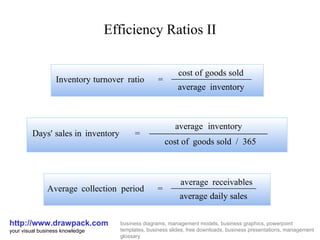
The document outlines key efficiency ratios used in business, such as days' sales in inventory and inventory turnover ratio, to aid in financial analysis. It promotes Drawpack's free business diagrams and presentations that are available for students and professionals. Additionally, it provides contact information and mentions a membership offer on their website.


![Eines tic per a l emprenedor i la pime turistica.ppt [modo de compatibilidad]](https://cdn.slidesharecdn.com/ss_thumbnails/einesticperalemprenedorilapimeturistica-150417073526-conversion-gate01-thumbnail.jpg?width=640&height=640&fit=bounds)


