Downloaded 22 times
![8
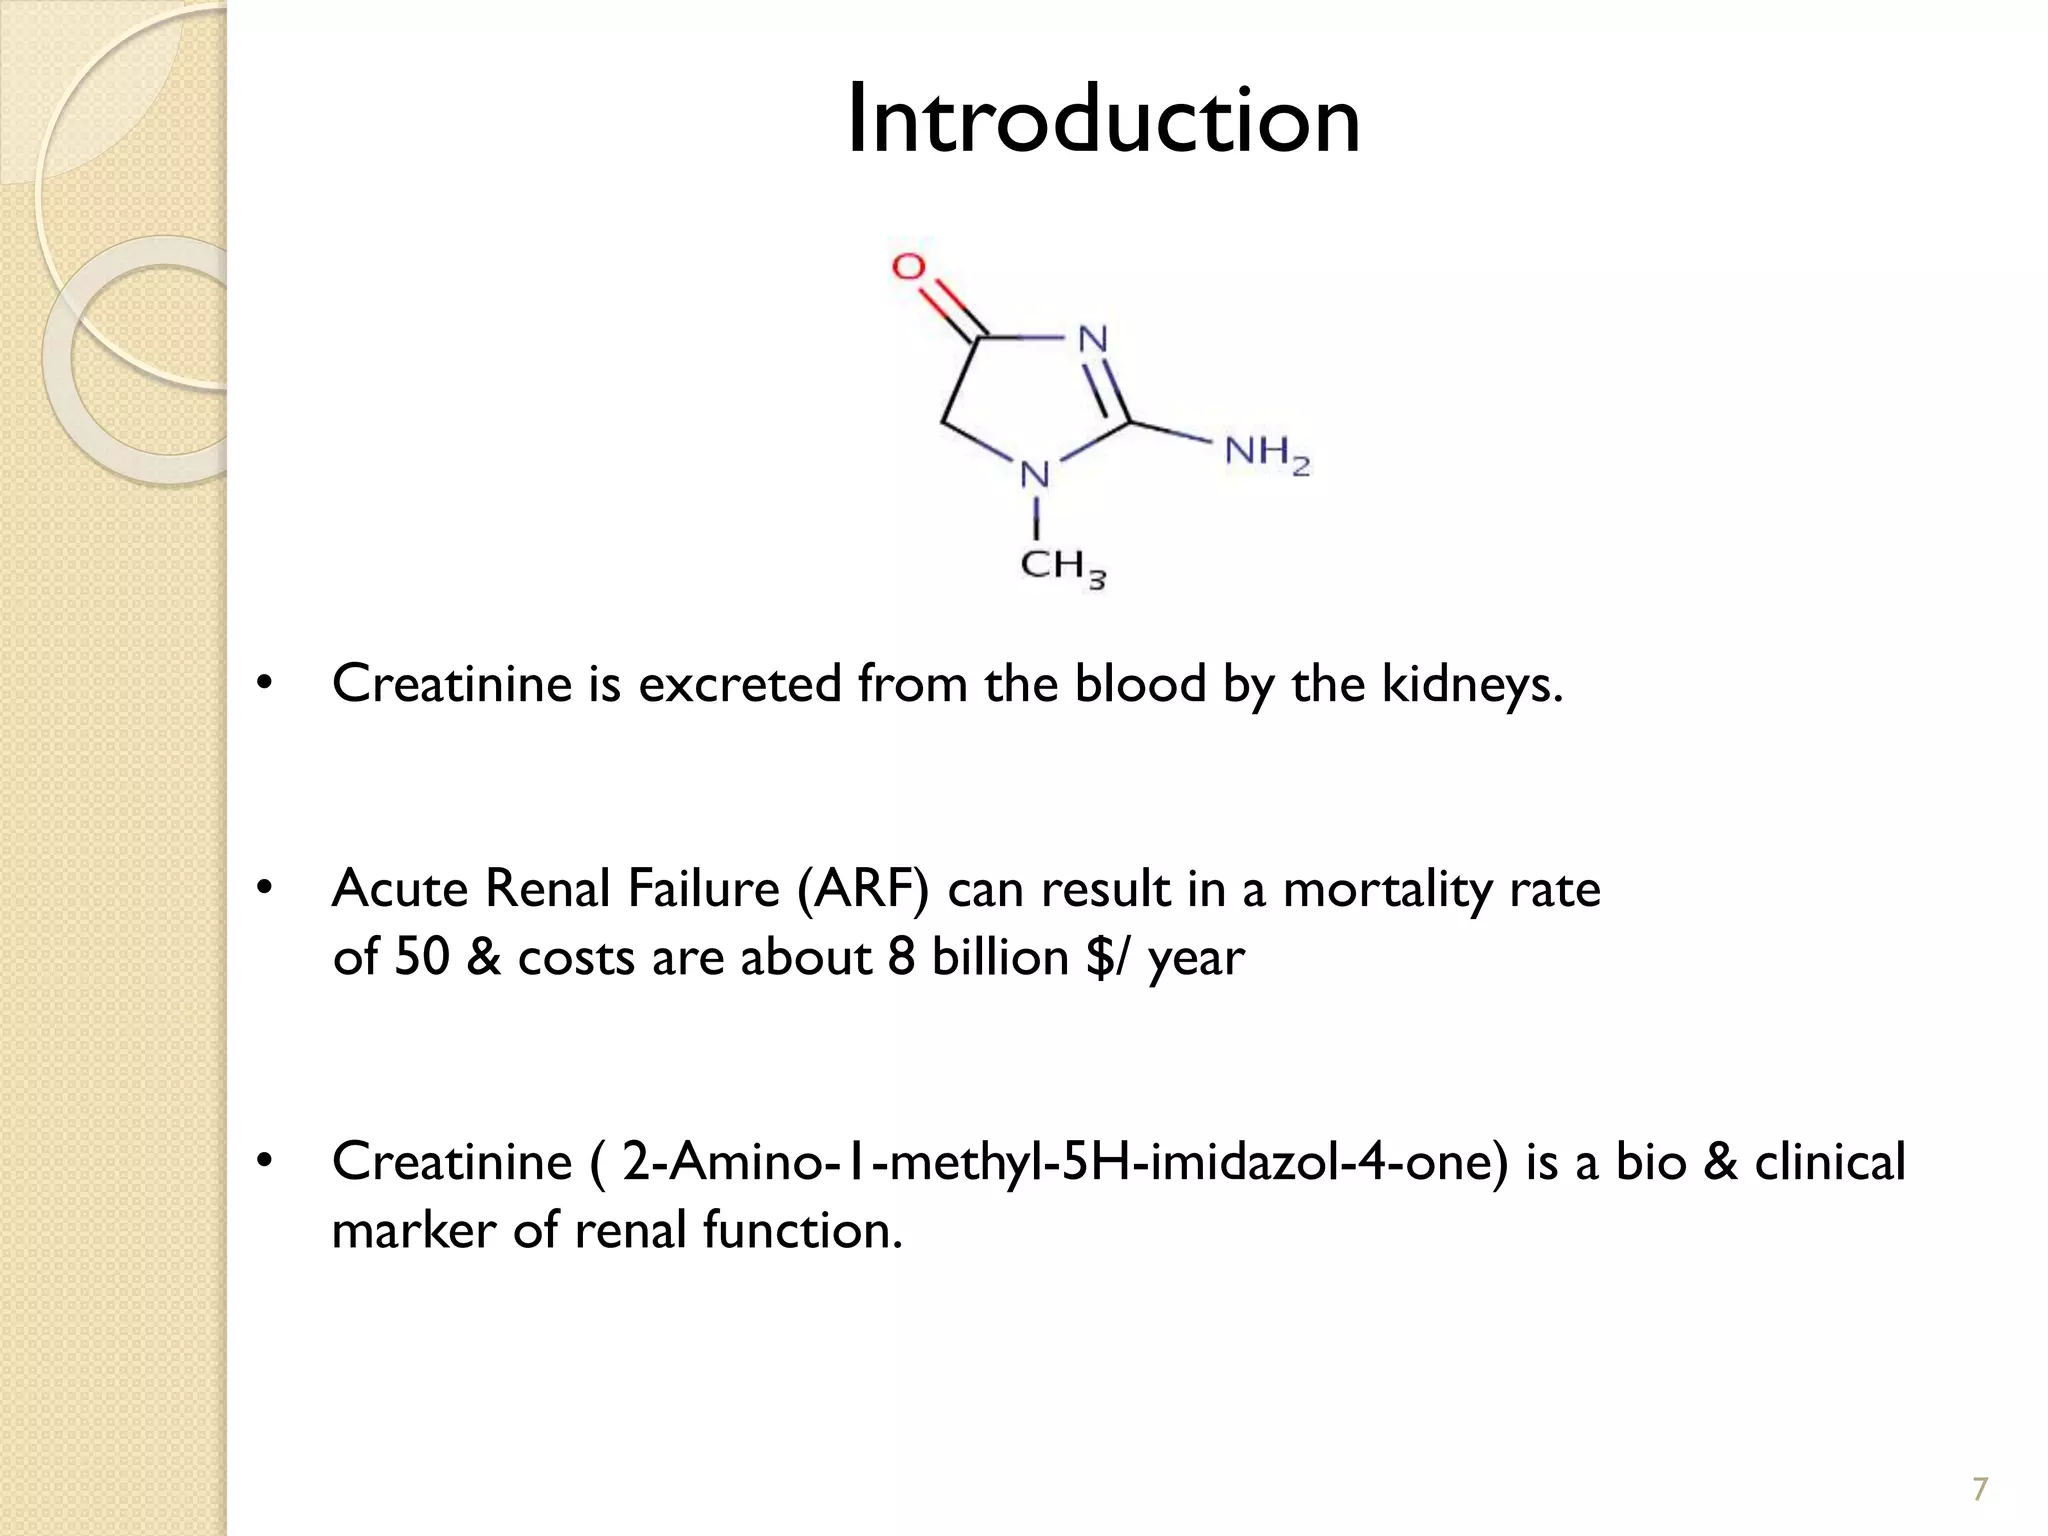
Preparation of Standard Solution and
Spiked Sample
10.0 mg of
Creatinine
Dissolved in
H2O (100 mL)
Stored in brown
vials (20mL) in dark
(4◦C.)
10.0 mg of
Creatinine -d3
Dissolved in
H2O (100 mL)
Stored in brown
vials (20mL) in
dark (4 ◦C.)
Preparation of Creatinine (100 mg/L)
Preparation of Creatinine -d3 (100 mg/L)
A series of Creatinine standards (0–10 mg/L) were prepared by diluting the
Creatinine stock solution with H2O by keeping [Creatinine -d3]-100 μg/L](https://image.slidesharecdn.com/seminar-140409232148-phpapp01/75/EESI-8-2048.jpg)
![9
Preparation of Spiked Urine Sample
Raw urine
sample
Diluted by 1:500
with ultrapure H2O
Urine samples were
spiked with Creatinine
and Creatinine-d3
• [Creatinine] in spiked urine is 1.5–3 times > Creatinie in unspiked urine
based on standard addition method
• Urine donators were 6 healthy males & females
[Creatinine] mg/L
[Creatinine-d3] mg/L
0.5 1 1.5 2 4
11 1 11](https://image.slidesharecdn.com/seminar-140409232148-phpapp01/75/EESI-9-2048.jpg)
![EESI–MS/MS (+Ve Mode) spectrum of Creatinine protonated molecular ion at m/z
114 obtainedby analyzing a Creatinine standard solution (100 g/L) (NCE = 25% @
AQ = 0.30)
The isolation width -2.0Da
Activation time-30ms
m/z range -15–200
Maximum ion injection time- 200ms
Instrument was checked by-100 g/L of Creatinine standard solution
6 Independent Analysis for
each sample
12
[M+H]+
[CH3NCH3]+
[M+H−CO]+
EESI-MS/MS Spectrum](https://image.slidesharecdn.com/seminar-140409232148-phpapp01/75/EESI-12-2048.jpg)
![15
Optimization of MS/MS analysis
Conditions
AQValue NCE Peak Behaviour
0.1 & 0.2 NCE - 0-100% [M+H]+ (m/z 114)
0.25 & 0.30 NCE ≥ 20% [CH3NCH3]+ (m/z 44), [M+H−CO]+ (m/z 86)
0.35 - 0.6 NCE ≥ 20% Only the peak at m/z 86
≥ 0.65 NCE ≥ 20% No peaks at m/z 44 & m/z 86
0.25-0.35 NCE = 25% Intensity of m/z 86 increased by a factor 6
The peak (m/z 86) was selected for optimizing analytical parameters
Lowest m/z = [Parent Mass]×[AQ]
0.908](https://image.slidesharecdn.com/seminar-140409232148-phpapp01/75/EESI-15-2048.jpg)
![Quantification of Urinary Creatinine
• Creatinine-d3 was the isotopic internal standard to correct the variations
in [Creatinie]
• Creatinine-d3 was quantified by - [M+H−CO]+ (m/z 89)
• The intensity ratio of Creatinine and Creatinine -d3 was plotted as a
function of [Creatinine ]in the standard solutions
16
Dependence of Creatinine signal
intensity on [Creatinine] in ultrapure
water
Quantification of [Creatinine]in urine by
using the standard addition method](https://image.slidesharecdn.com/seminar-140409232148-phpapp01/75/EESI-16-2048.jpg)
![17
• The RSDValues……
• The % Recovery was calculated by using equation below
[Creatinine]Spec : 367mg/L
[Creatinine]MS/MS : 417mg/L
R(%) :114%
Quantification of Urinary Creatinine](https://image.slidesharecdn.com/seminar-140409232148-phpapp01/75/EESI-17-2048.jpg)
![The Results and Discussion
A typical EESI-MS spectrum (-Ve Mode) of EDTA-Pb(II) complexes.
24
[EDTA+208Pb-4H]2-
-CH2COO](https://image.slidesharecdn.com/seminar-140409232148-phpapp01/75/EESI-24-2048.jpg)
![Qualitative characterization of EDTA signals observed in the EESI-MS/MS
(a) Deprotonated EDTA of m/z 291
(b) [EDTA+Na-2H]- ions of m/z 313
(c) [EDTA+2Na-3H]- ions of m/z 335 25
[EDTA-H]-
[EDTA+Na-2H]-
[EDTA+2Na-3H]-
-H2O
-CO2
-CO2, H2O, CO
-H2O
-CO2
-Na,CO2, H2O
-H2O
-H2O
a)
b)
c)](https://image.slidesharecdn.com/seminar-140409232148-phpapp01/75/EESI-25-2048.jpg)
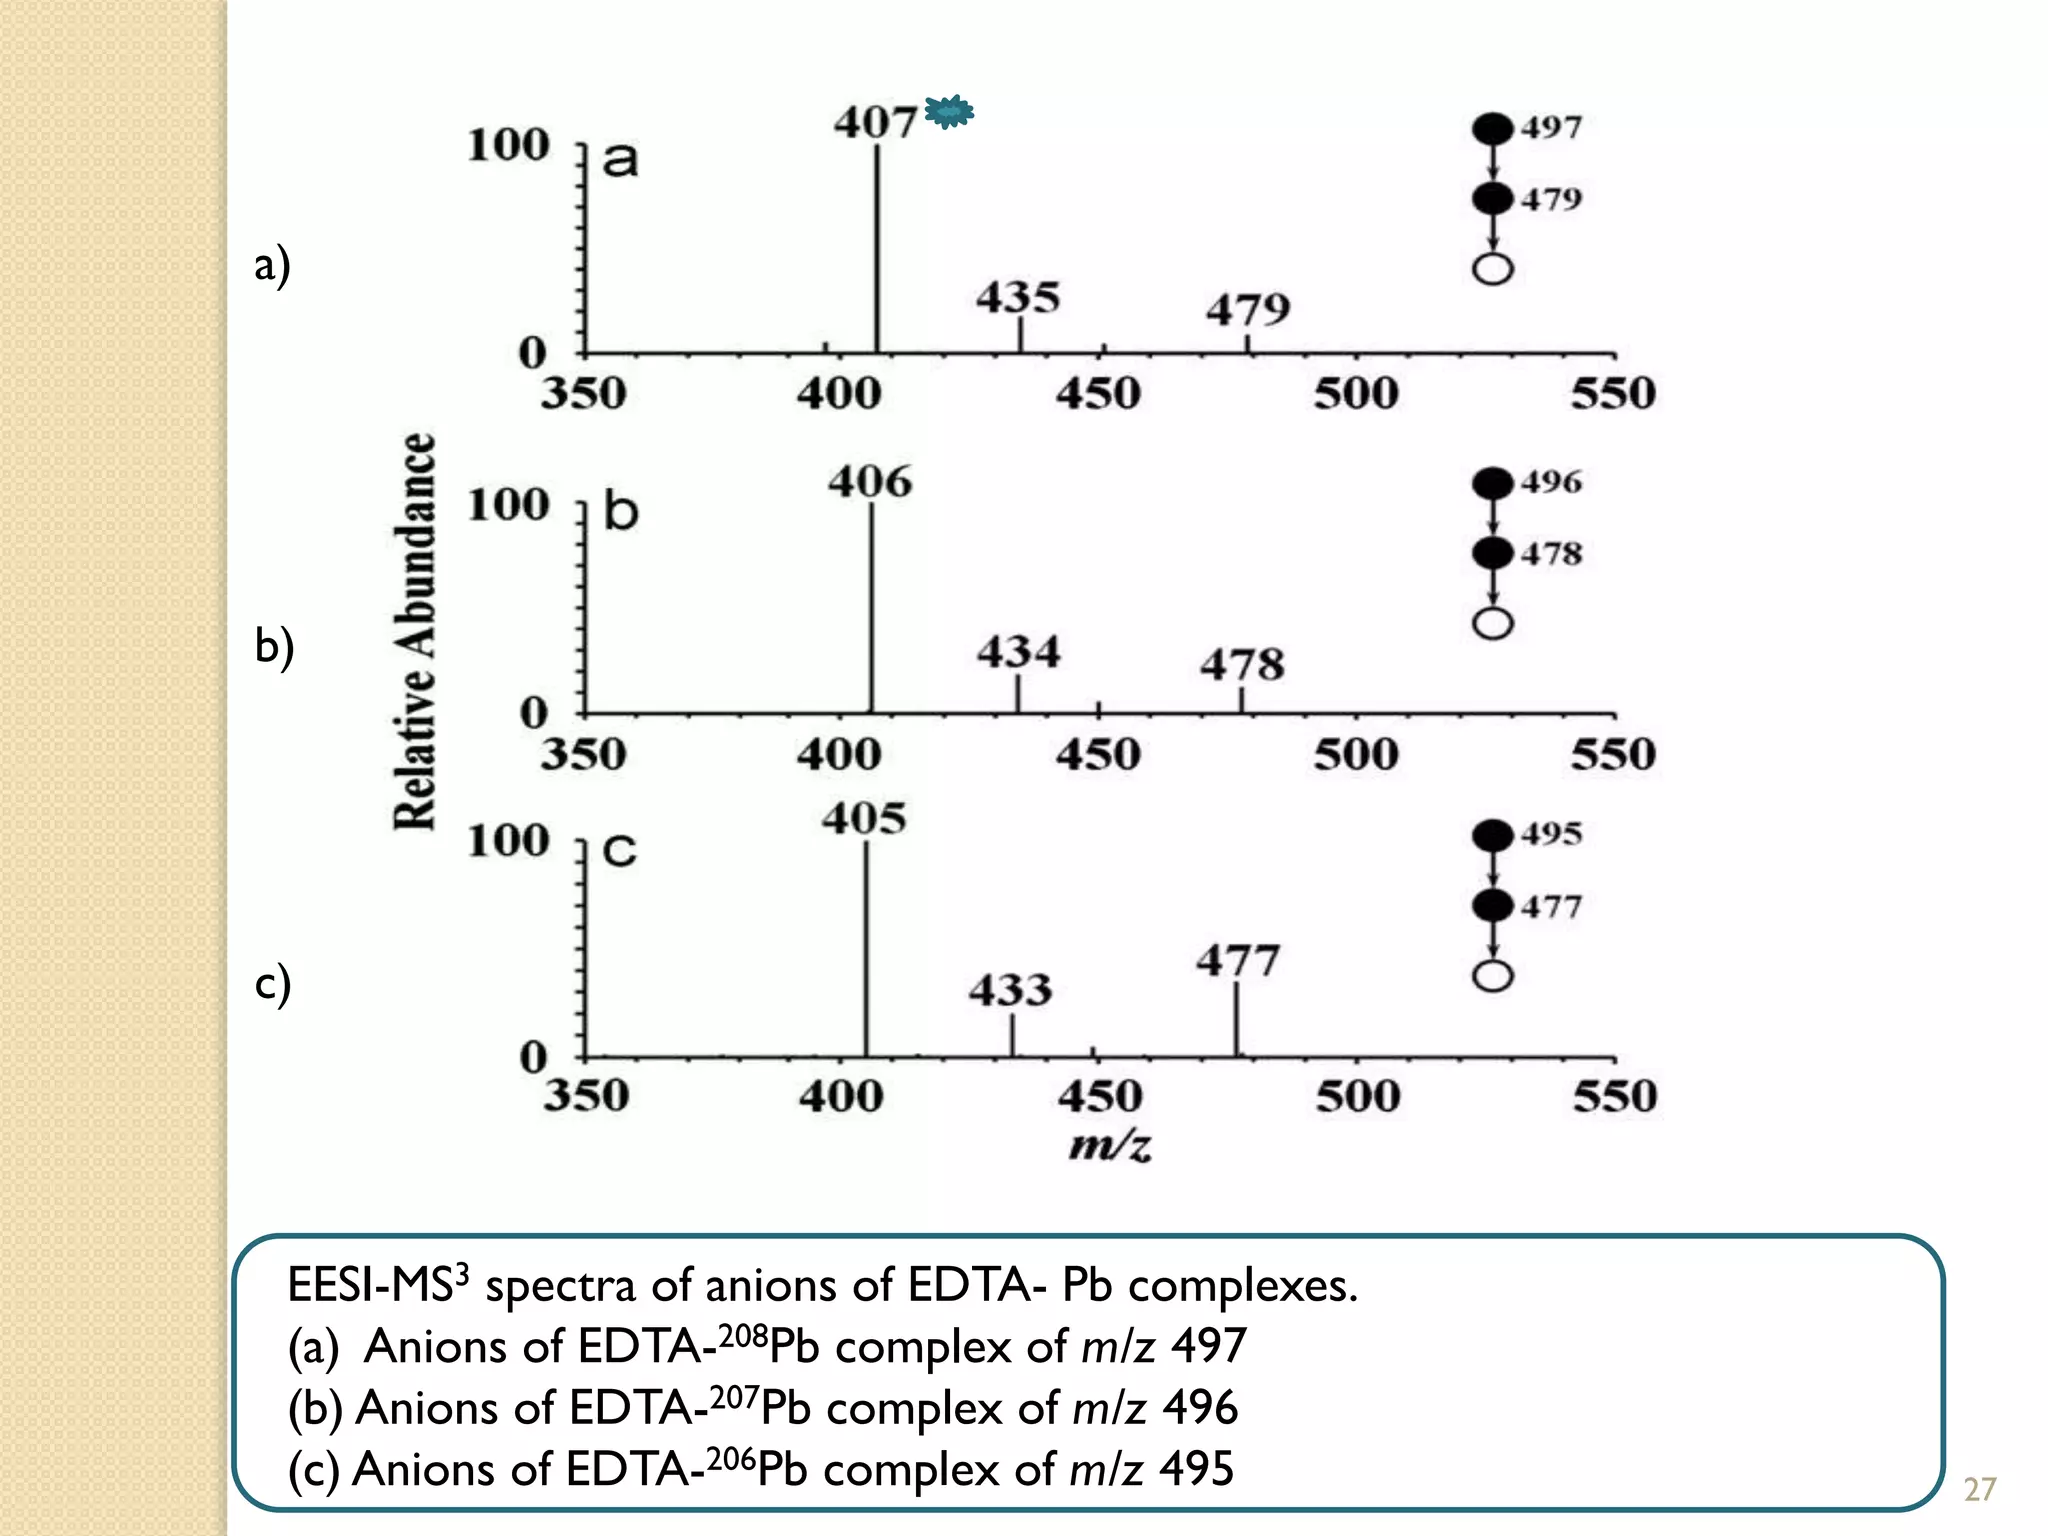
![EESI-MS/MS spectra of anions of EDTA-Pb (II) complexes.
(a) Anions of EDTA-208Pb complex of m/z 497
(b) Anions of EDTA-207Pb complex of m/z 496
(c) Anions of EDTA-206Pb complex of m/z 495
26
[EDTA+208Pb-3H]-
-H2O
-2CO
-2CO2
-CO
-CO2
[EDTA+207Pb-3H]-
[EDTA+206Pb-3H]-
a)
b)
c)](https://image.slidesharecdn.com/seminar-140409232148-phpapp01/75/EESI-26-2048.jpg)
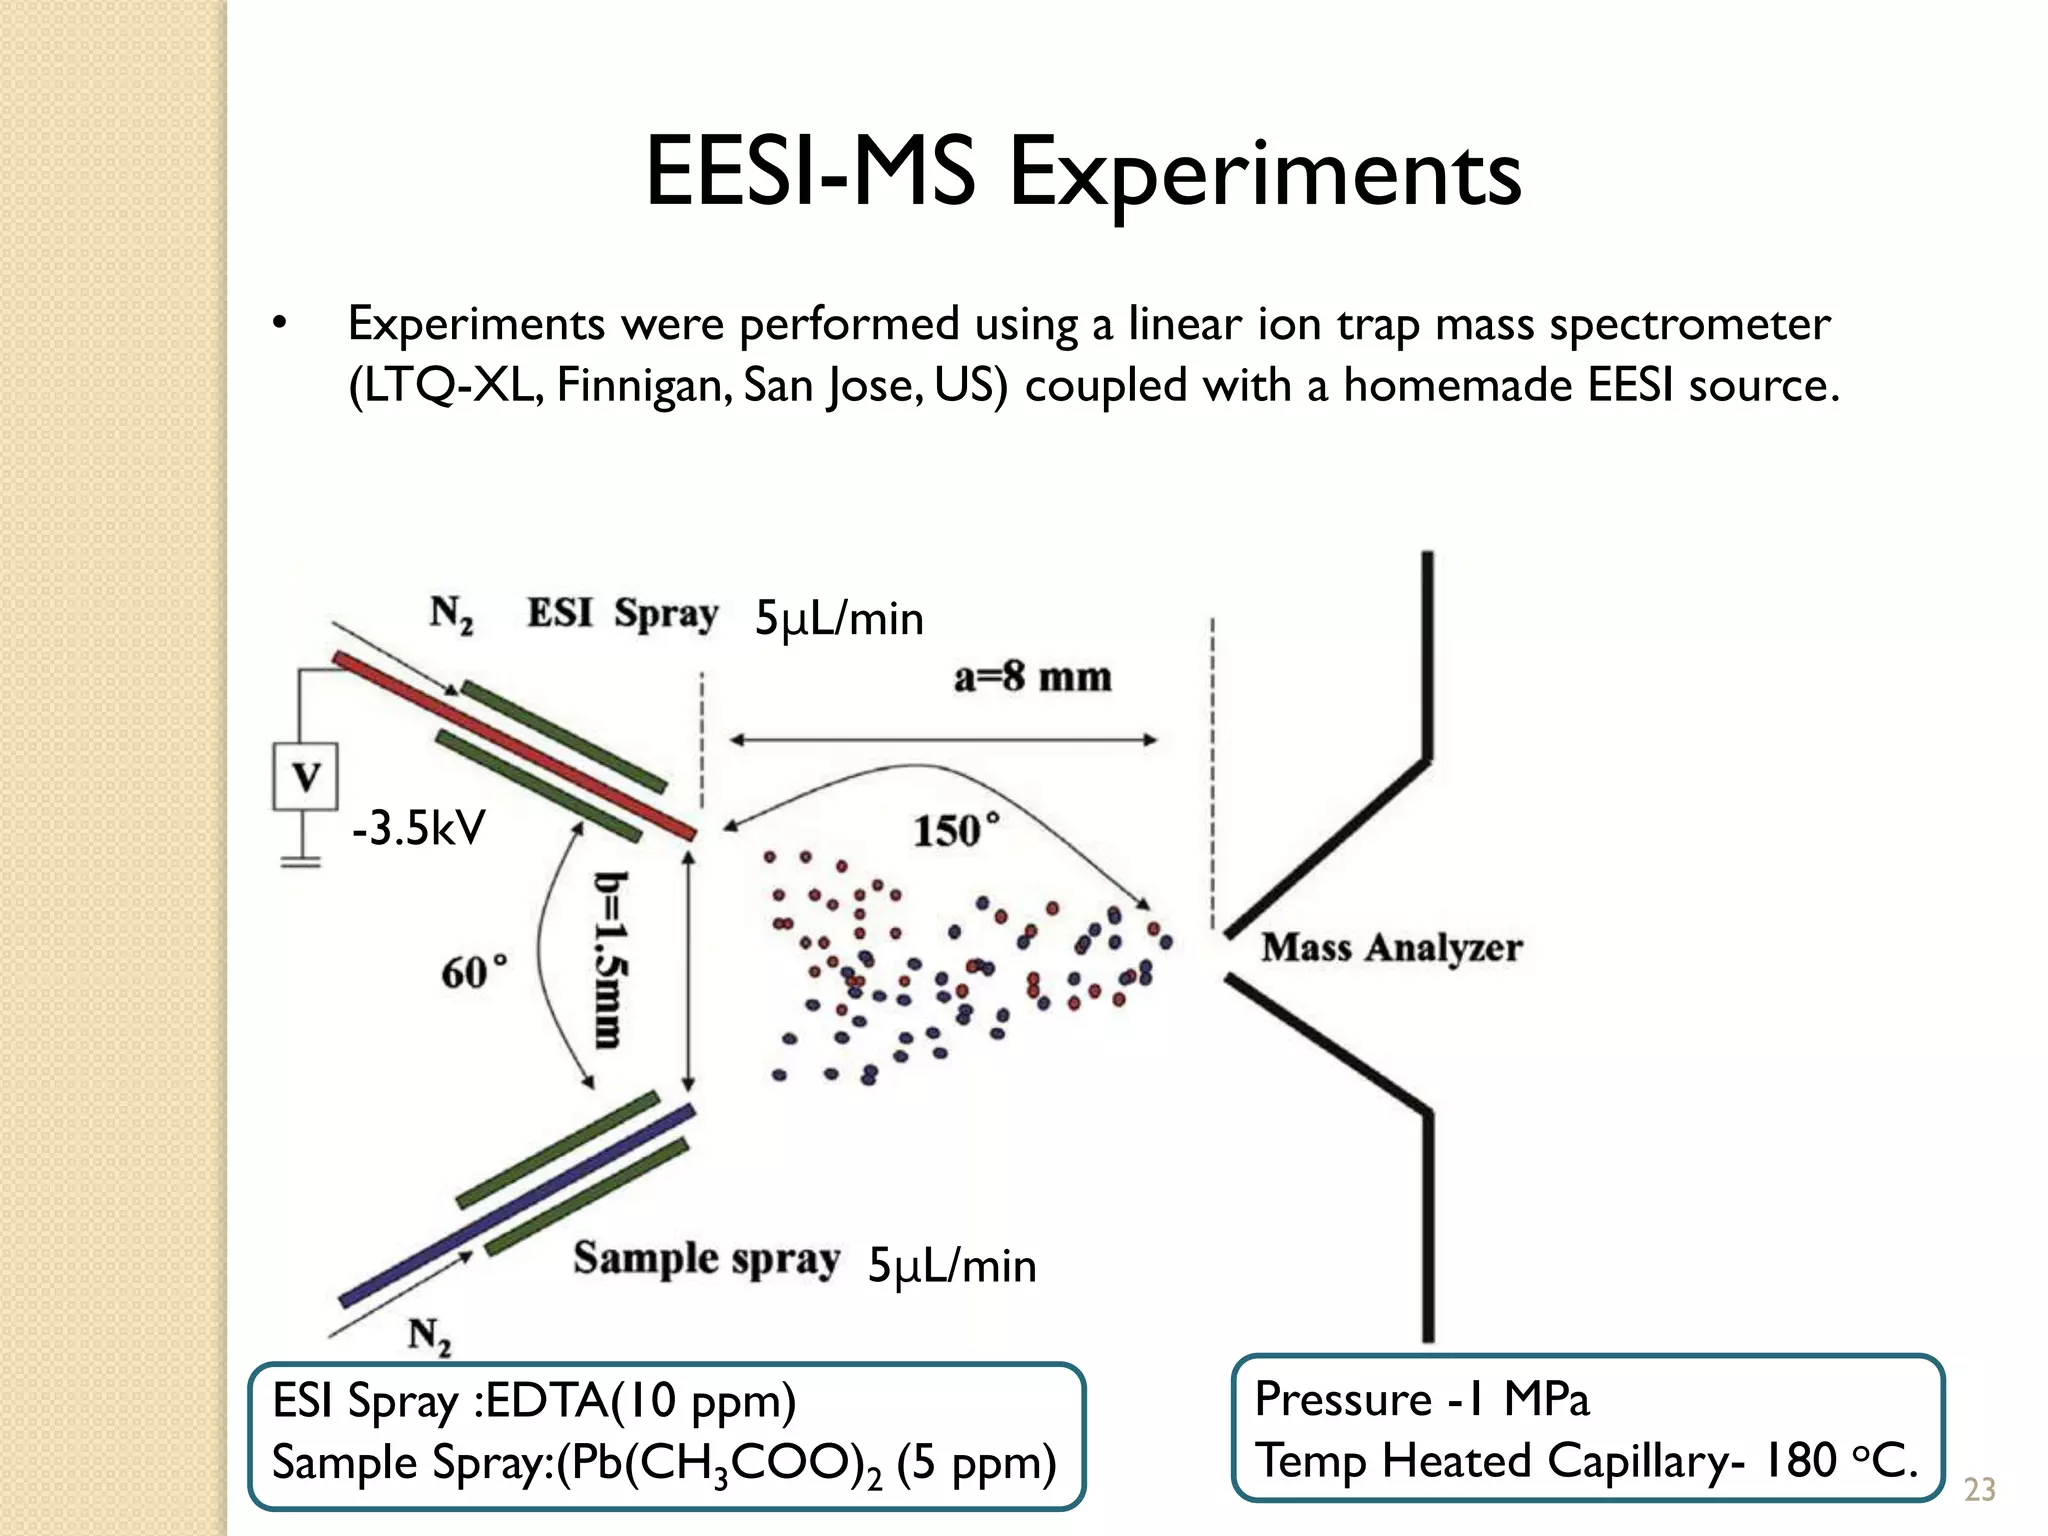
![Direct and Semi-Quantitative
Measurement Using EESI
• Pb (II) quantification was based on fragments at m/z 407 in the EESI-MS3
experiments of [EDTA+208Pb-3H]- ions, which were generated from the online
ion /molecule reaction in the EESI source
• The quantitative performance of EESI-MS3 was better than that of EESI-MS2 in
this study
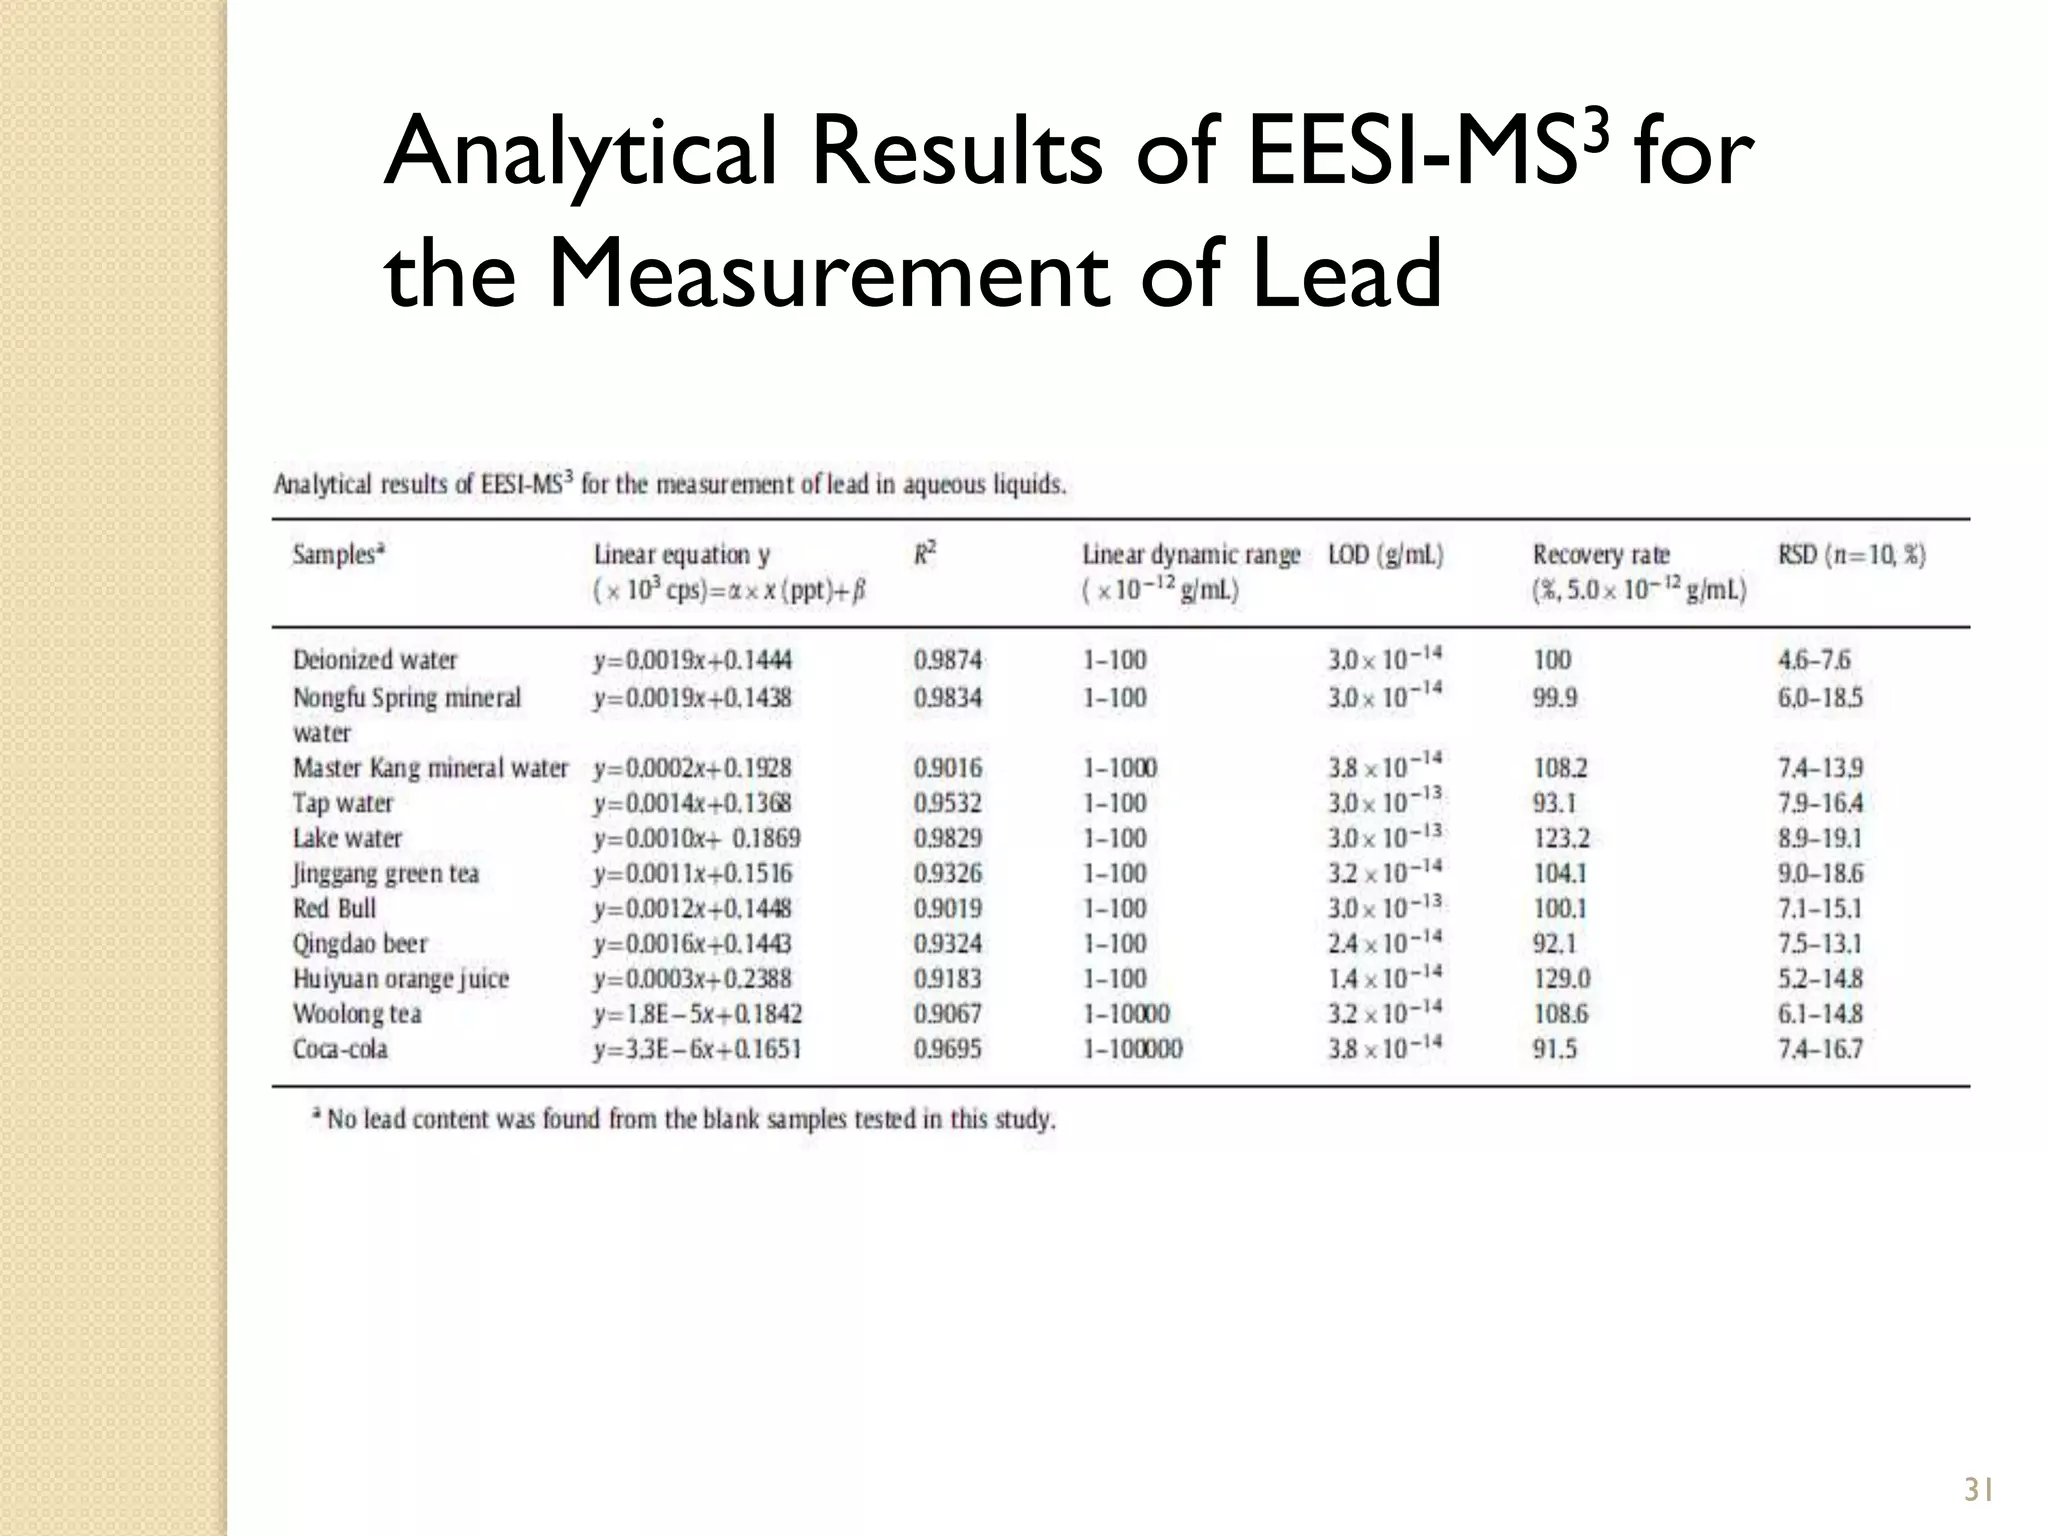
• Semi-quantitative measurement of lead was performed using several water-
based samples
• Calibration curve had a linear signal response range of 1–100 ppt concentration
range
• Pure deionized water was spiked with Pb(CH3COO)2 to obtain a
concentration of 5x10-12 g/mL with recovery rate of 100%
28](https://image.slidesharecdn.com/seminar-140409232148-phpapp01/75/EESI-28-2048.jpg)


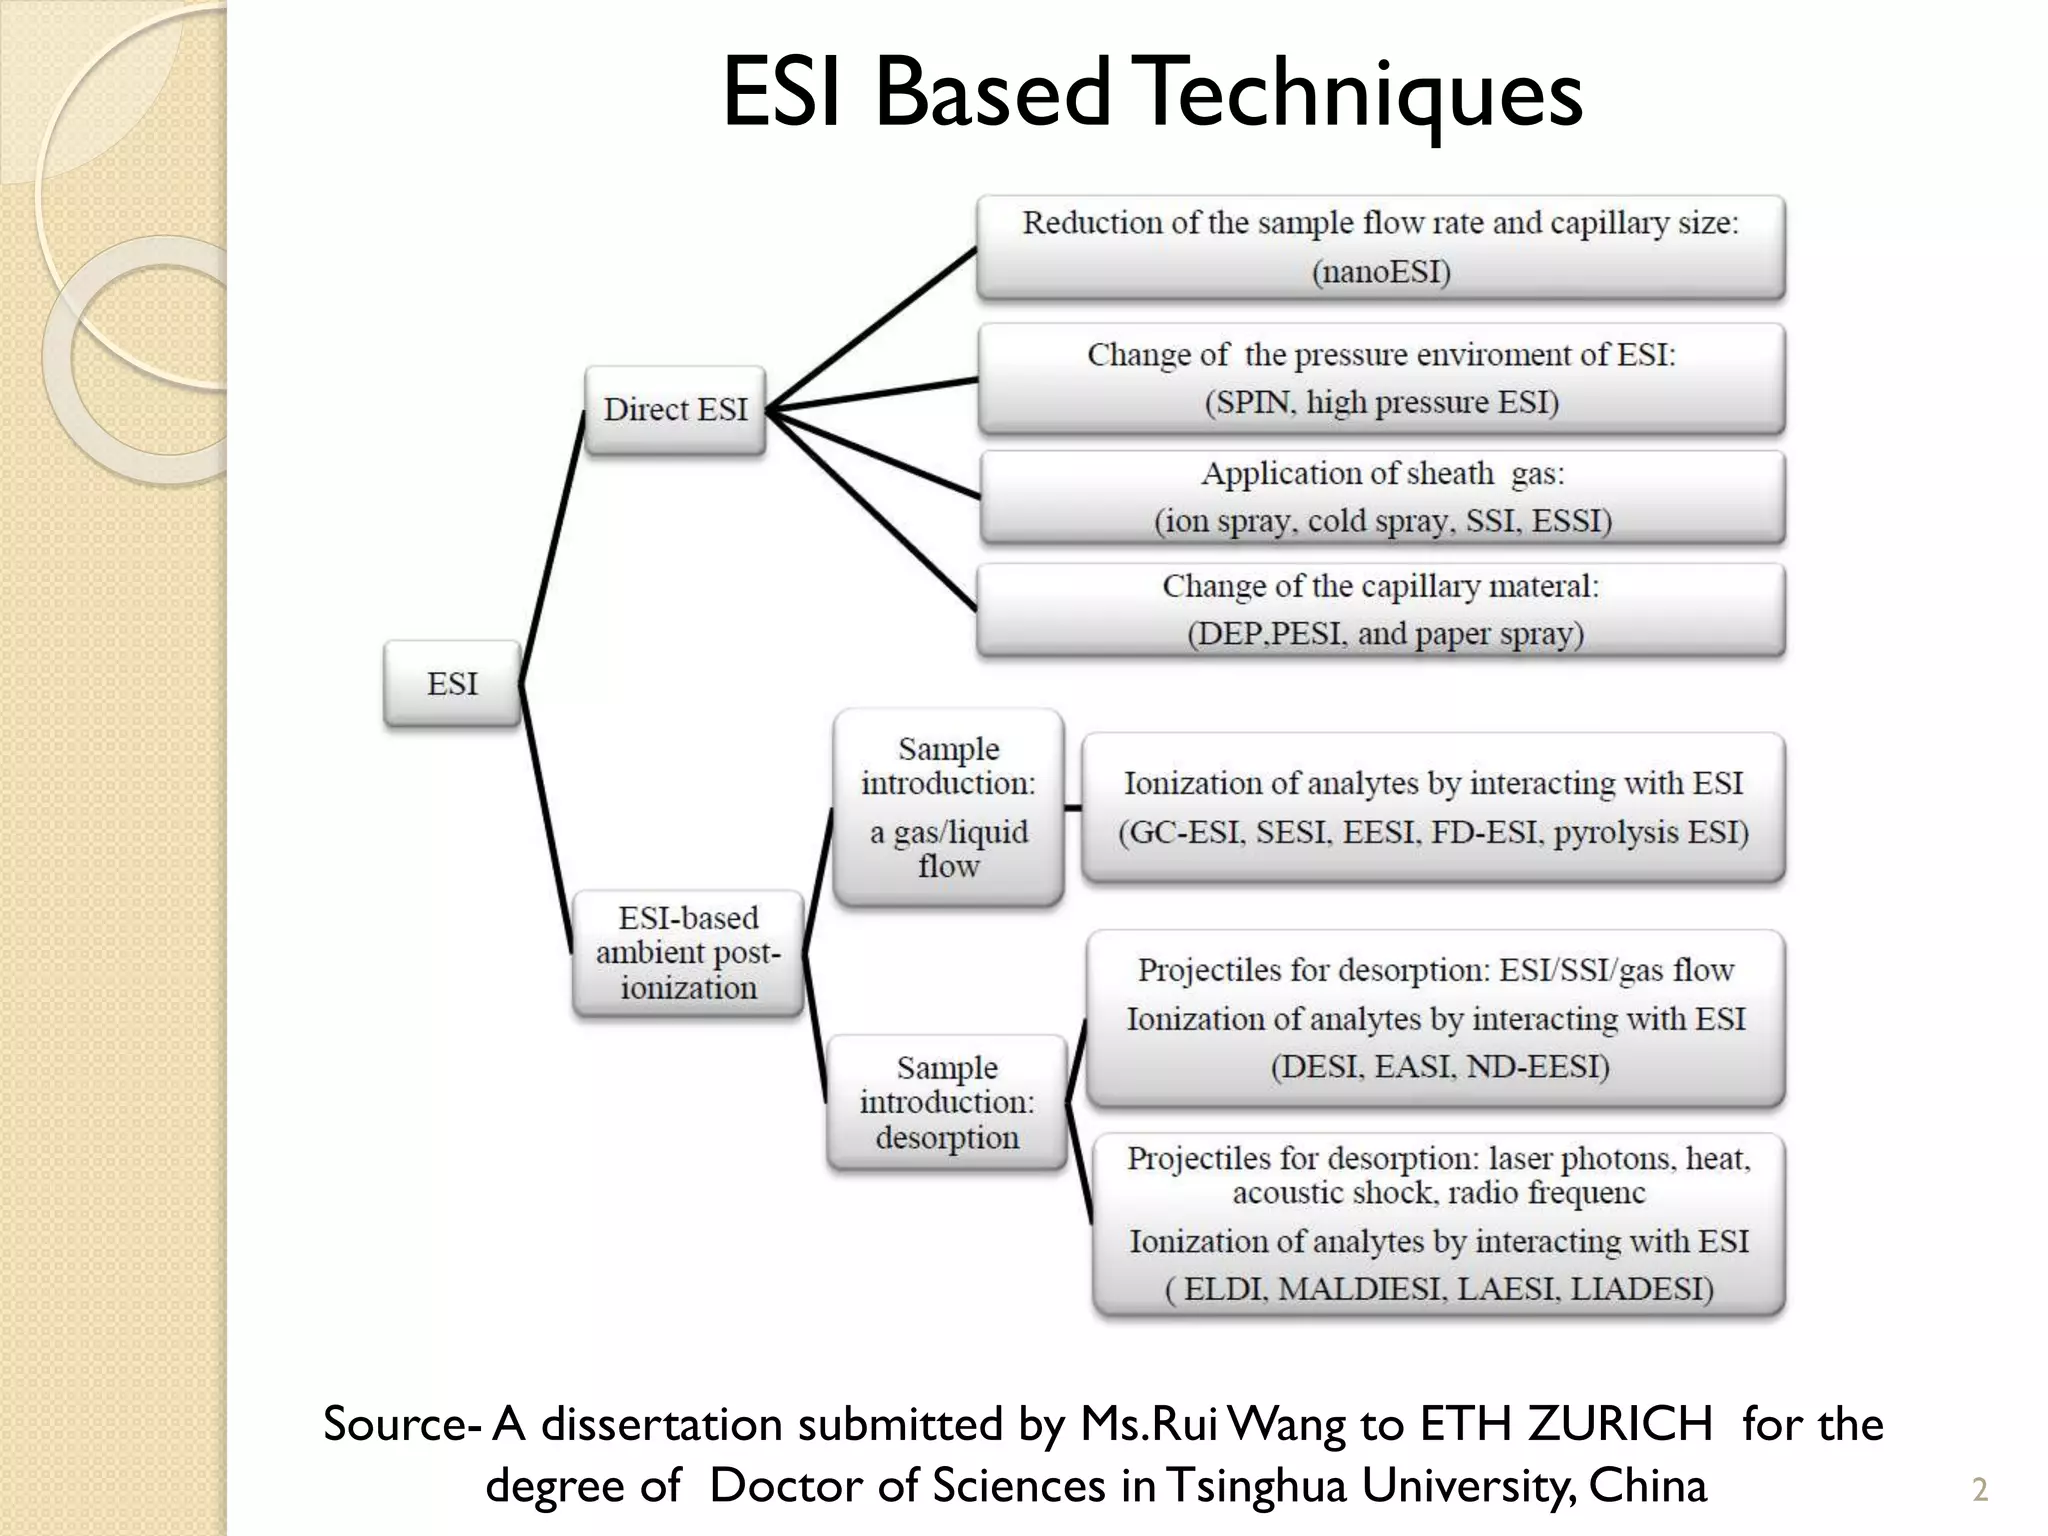
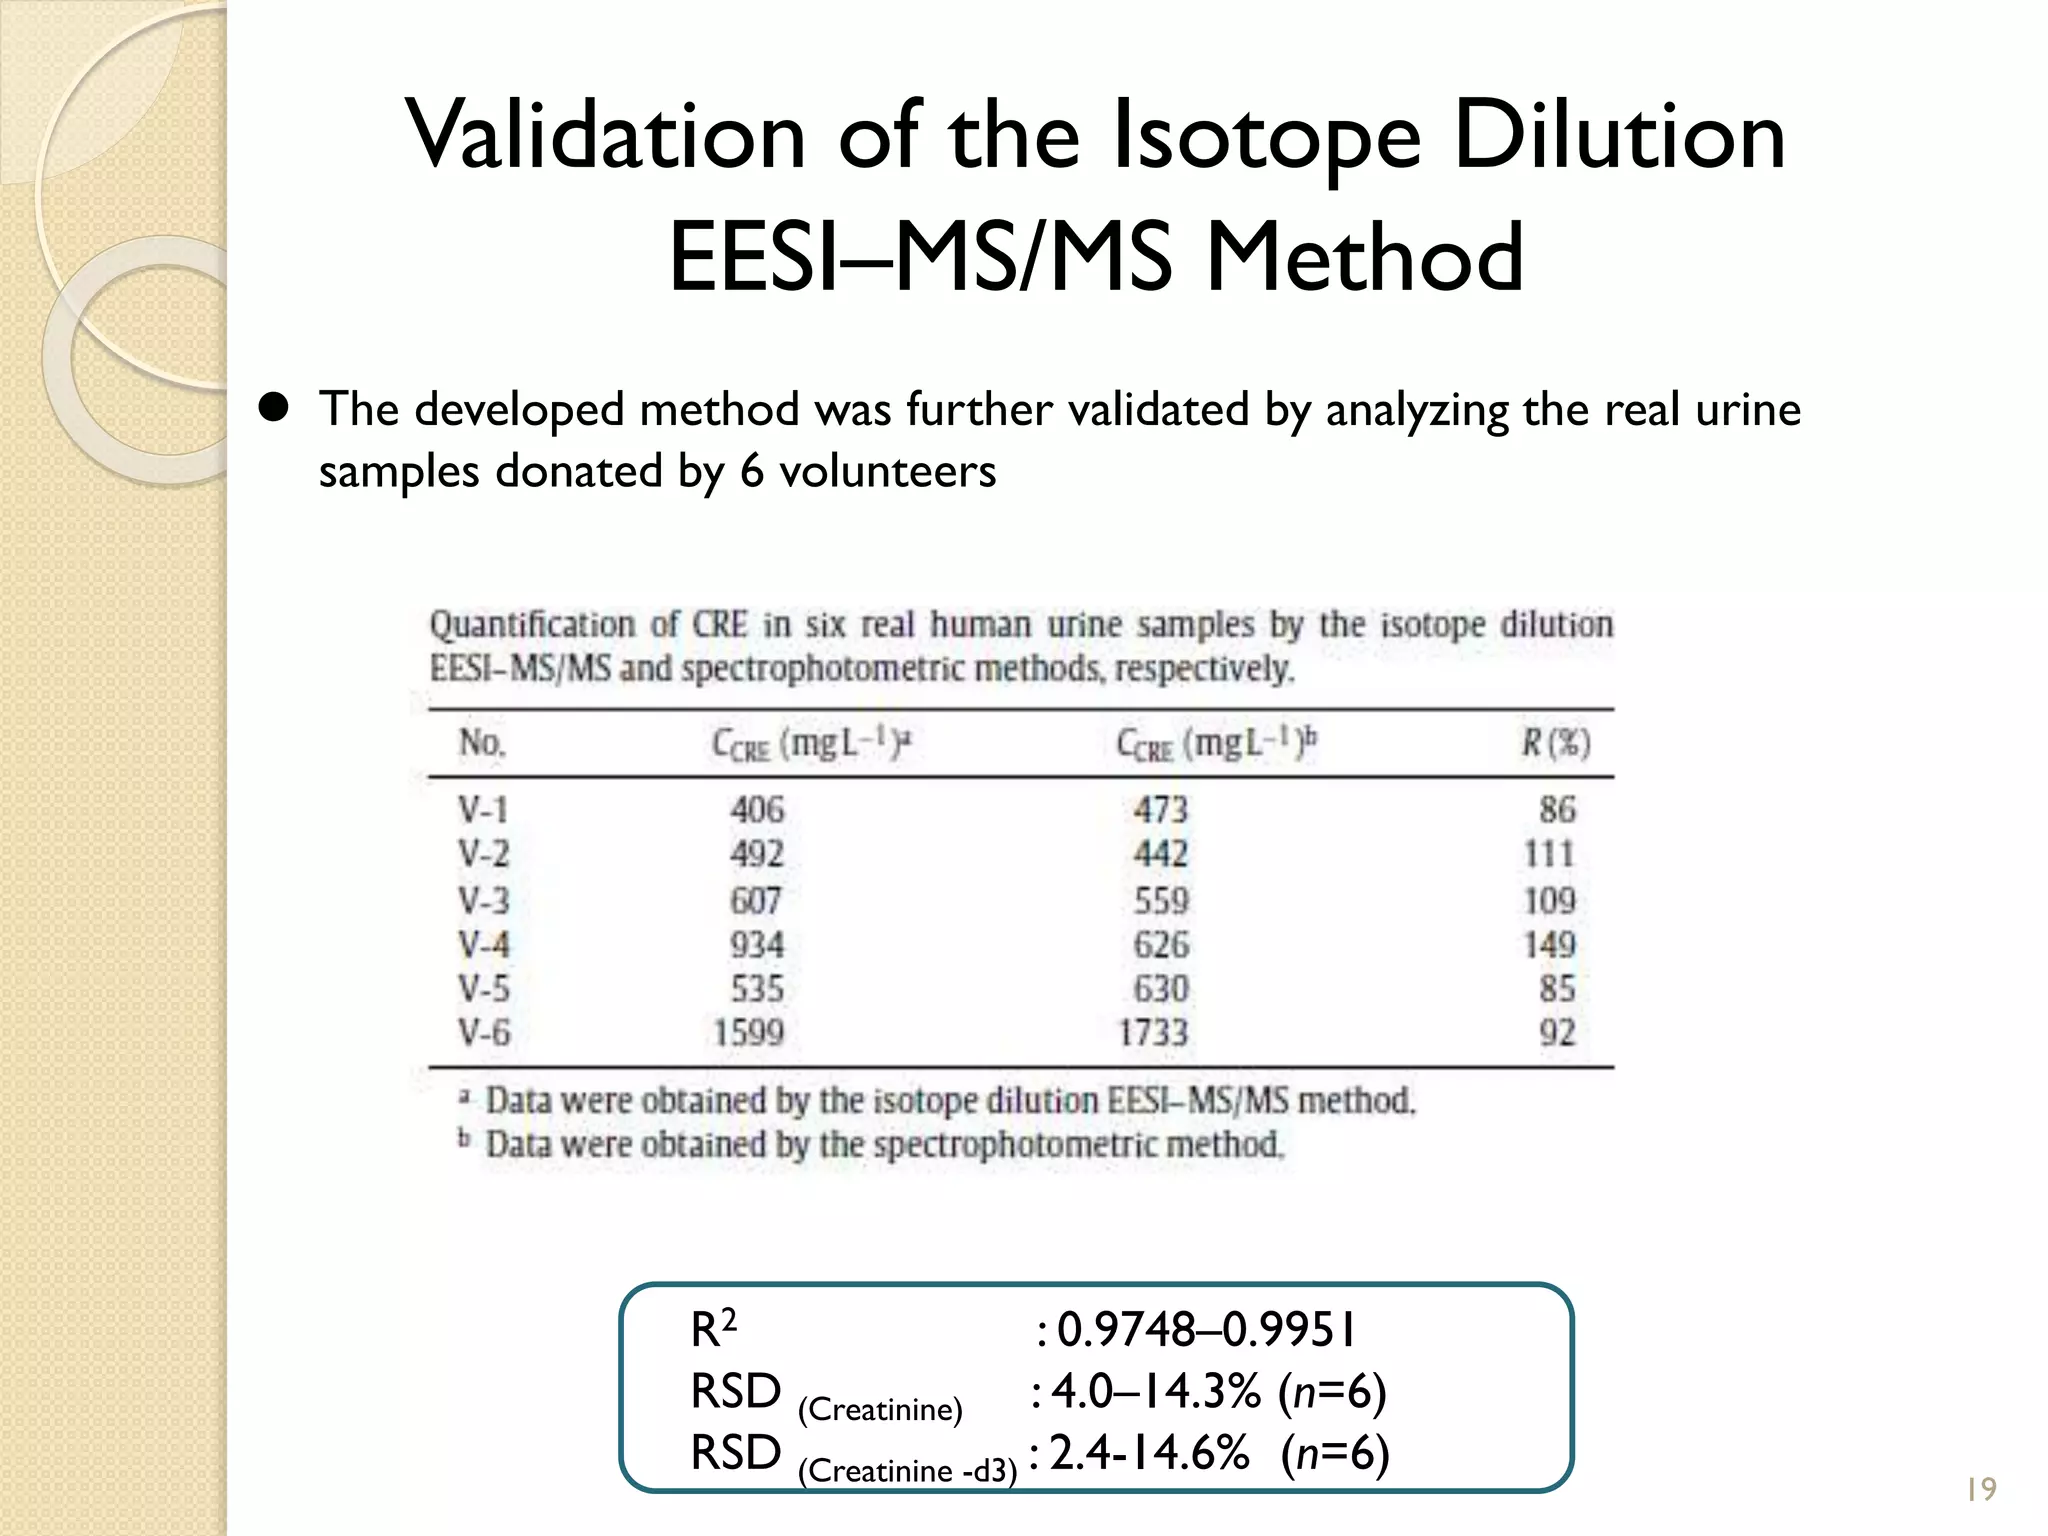
1. The document describes two applications of extractive electrospray ionization tandem mass spectrometry (EESI-MS/MS). 2. The first application is the direct quantification of creatinine in urine samples. Creatinine-d3 was used as an internal standard to quantify creatinine levels with high accuracy and precision in less than 0.3 minutes. 3. The second application is the rapid detection of trace levels of lead in various water-based samples without any sample pretreatment. Semi-quantitative analysis of lead was performed with good linearity and recovery rates between 1-100 ppt.


