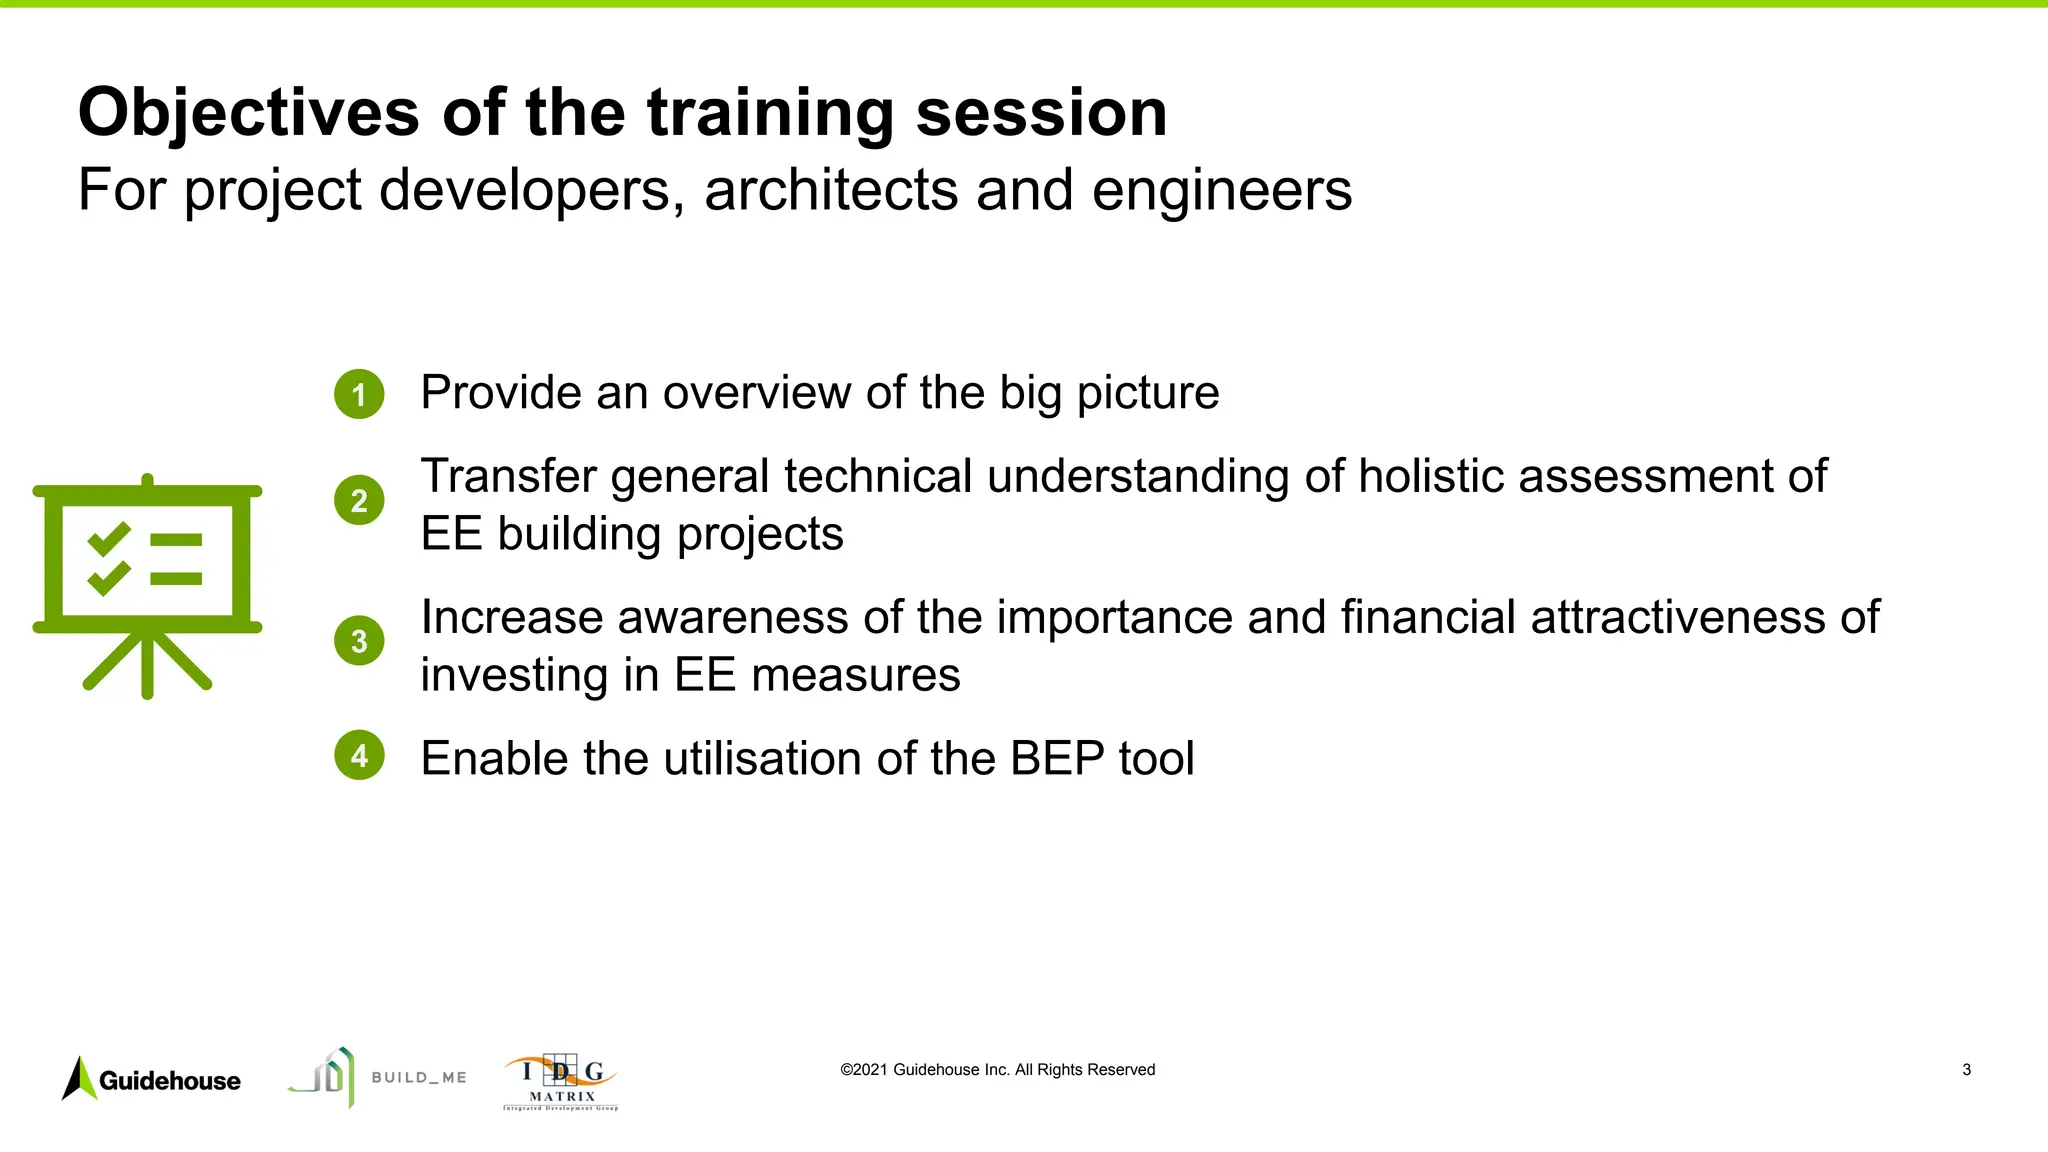
The training session on climate-friendly buildings aimed to provide project developers, architects, and engineers with an overview of energy-efficient (EE) projects, including technical and financial aspects, as well as the use of the Building Efficiency Performance (BEP) tool. Key topics covered included the significance of low energy buildings, energy consumption statistics in Egypt, definitions related to building energy levels, and various sustainable certification schemes. The participants were also introduced to policy instruments for promoting energy efficiency, emphasizing the importance of holistic planning and innovative design to create low-energy buildings.


![©2021 Guidehouse Inc. All Rights Reserved 56
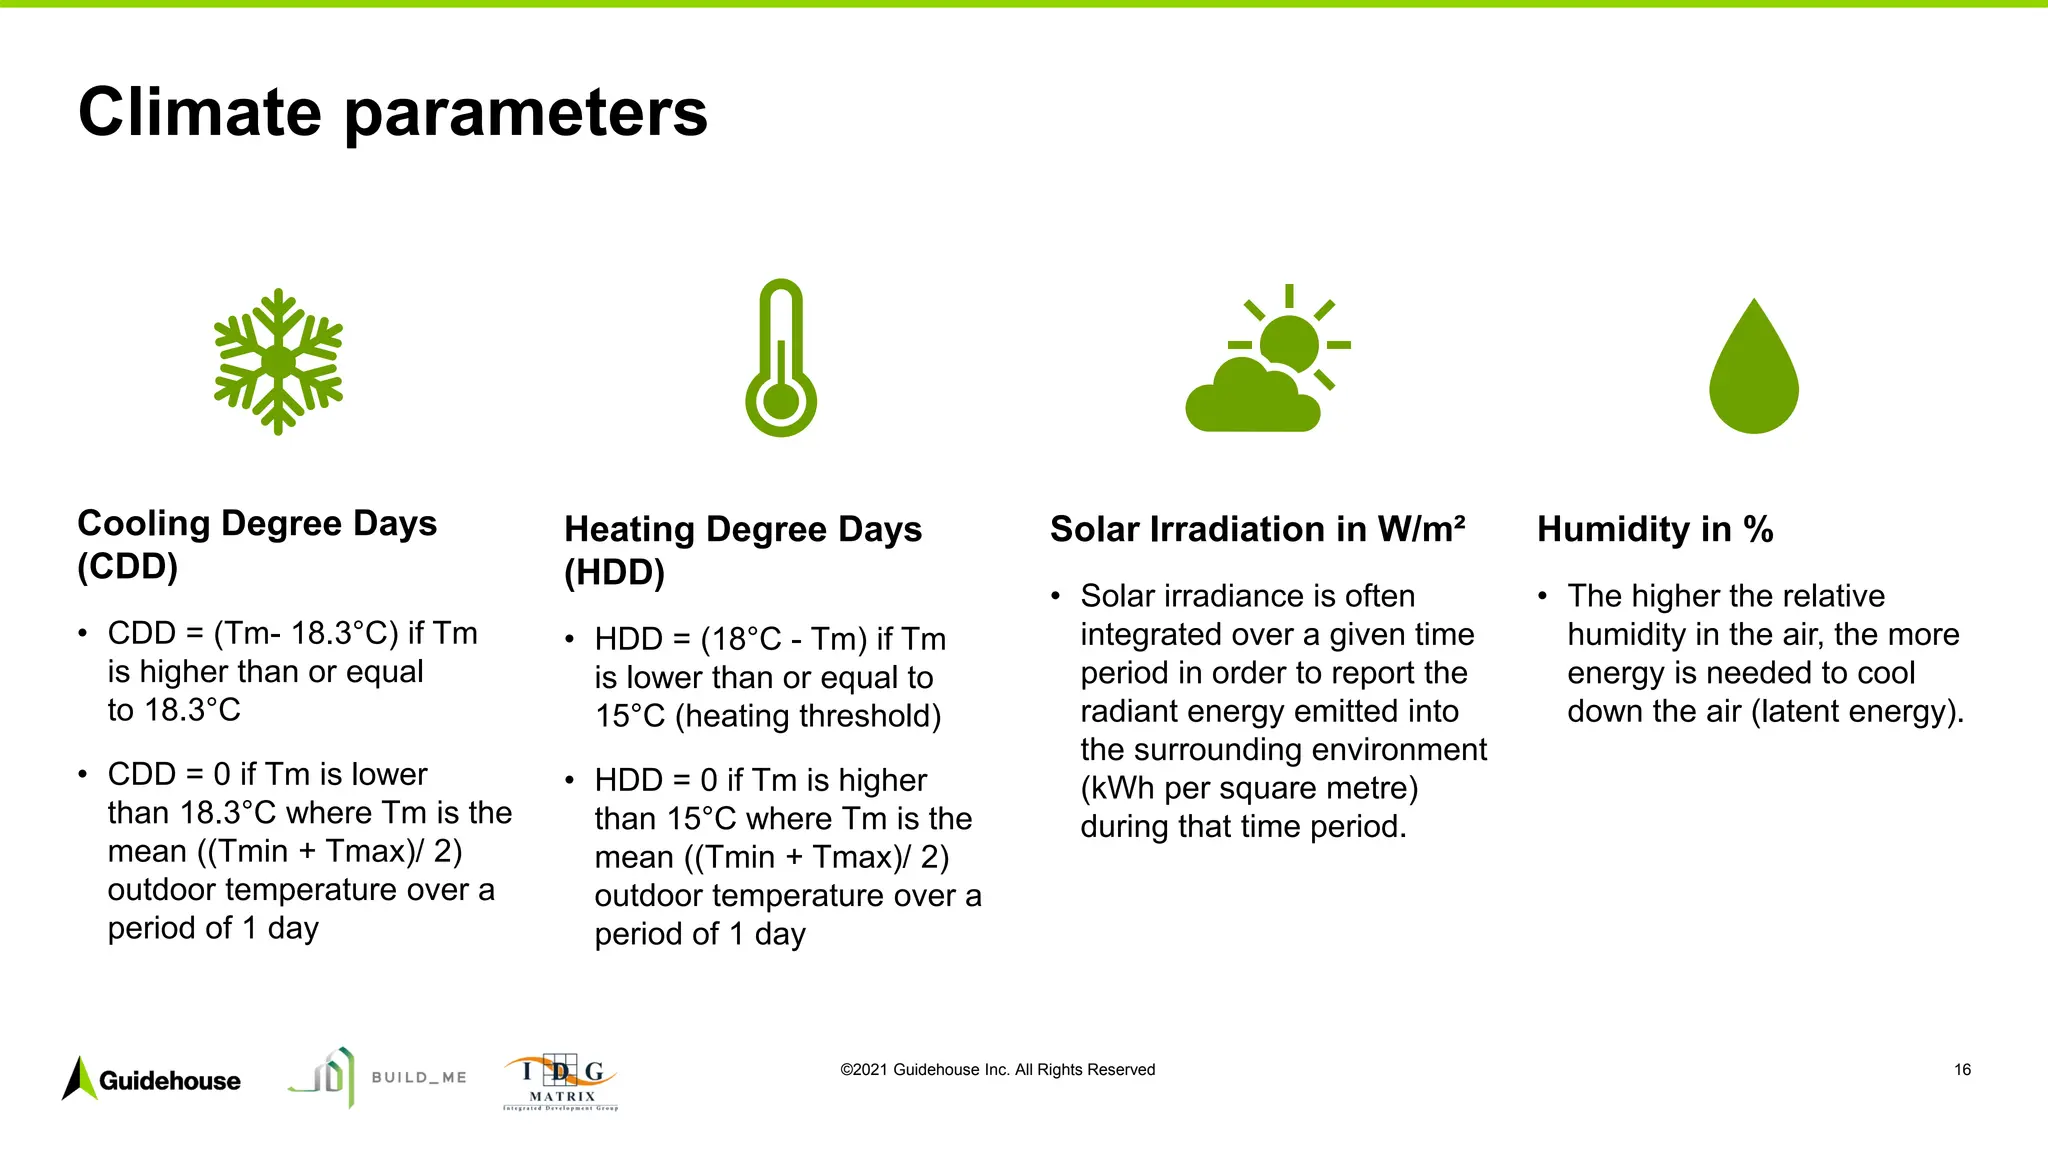
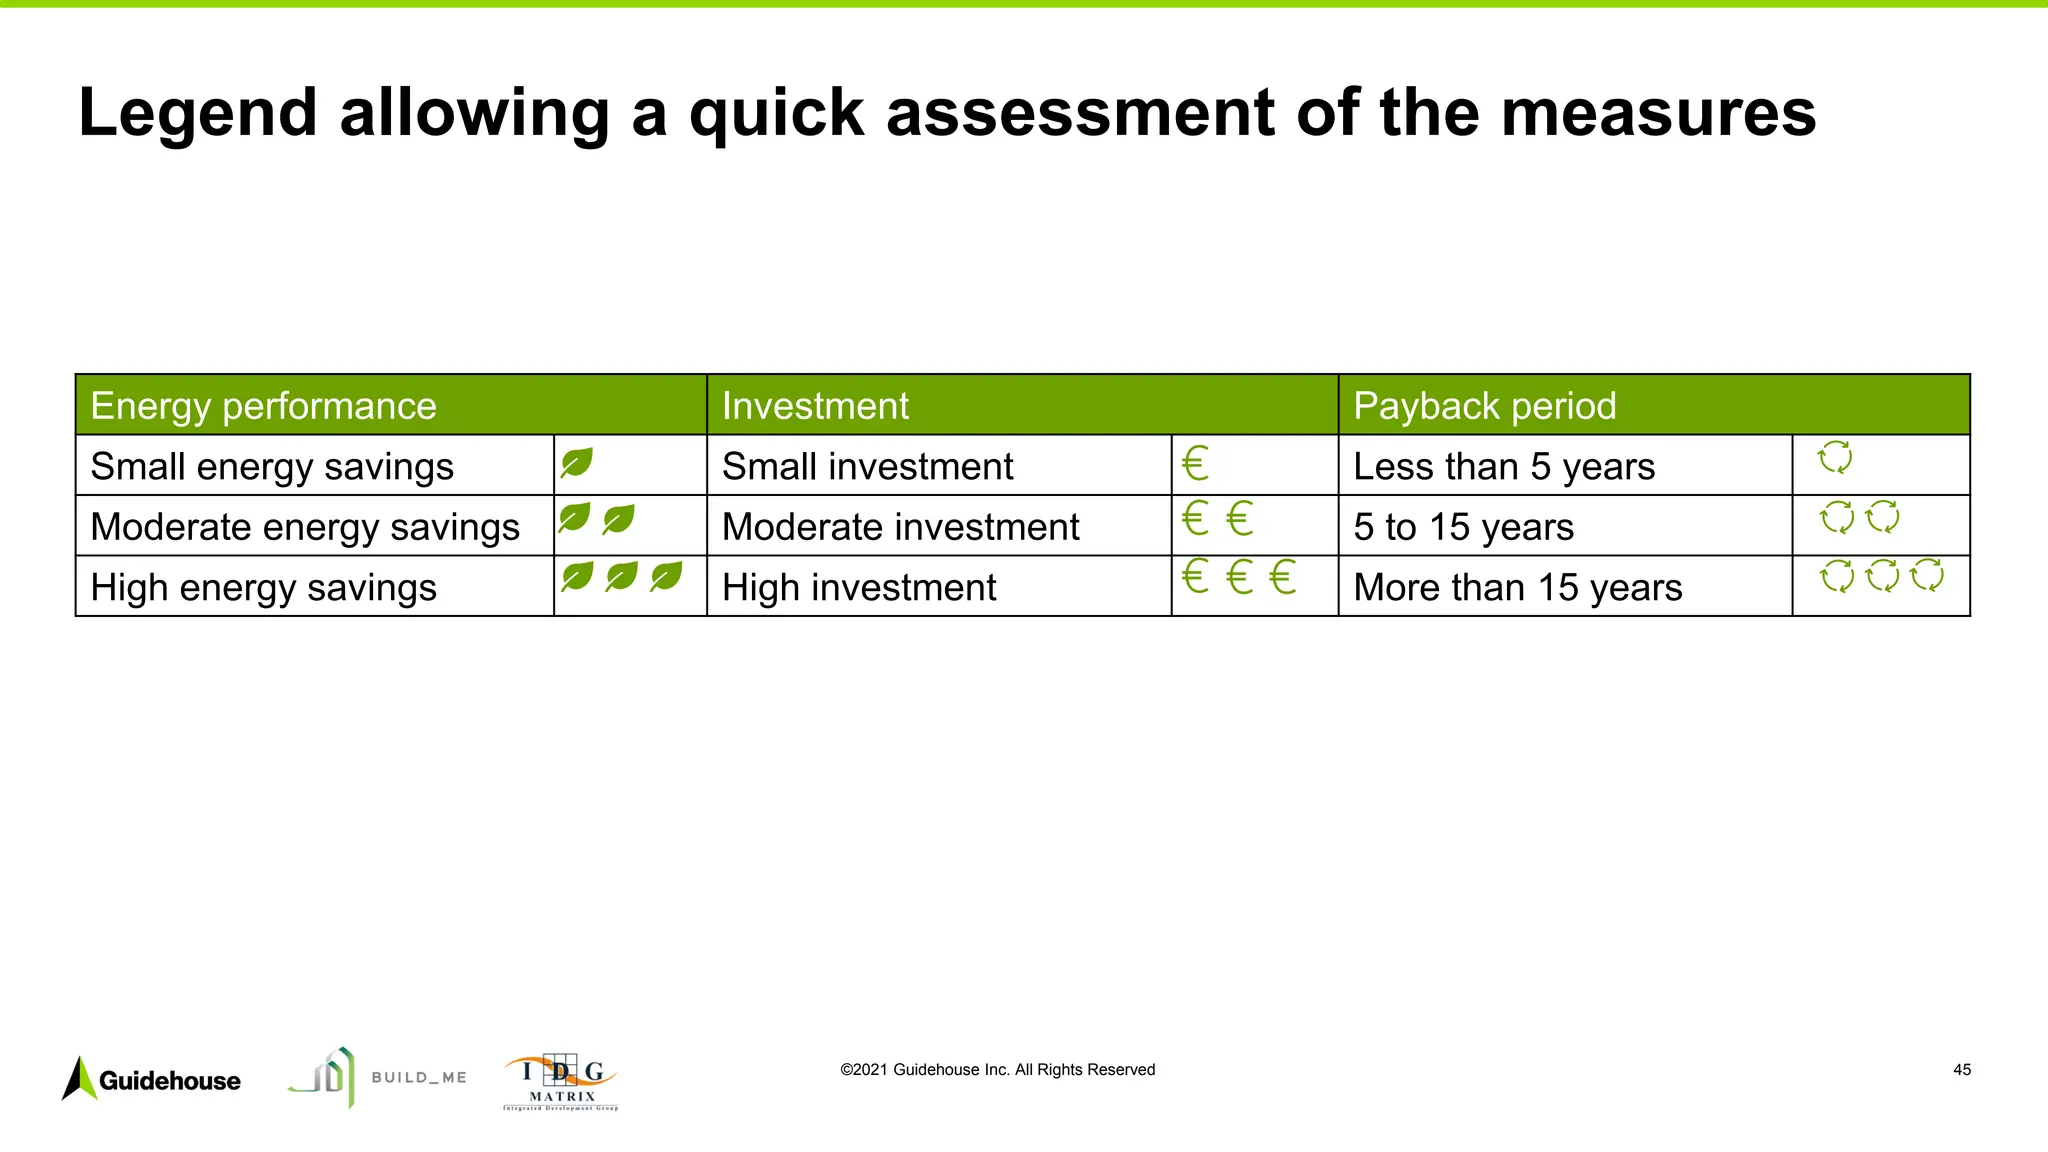
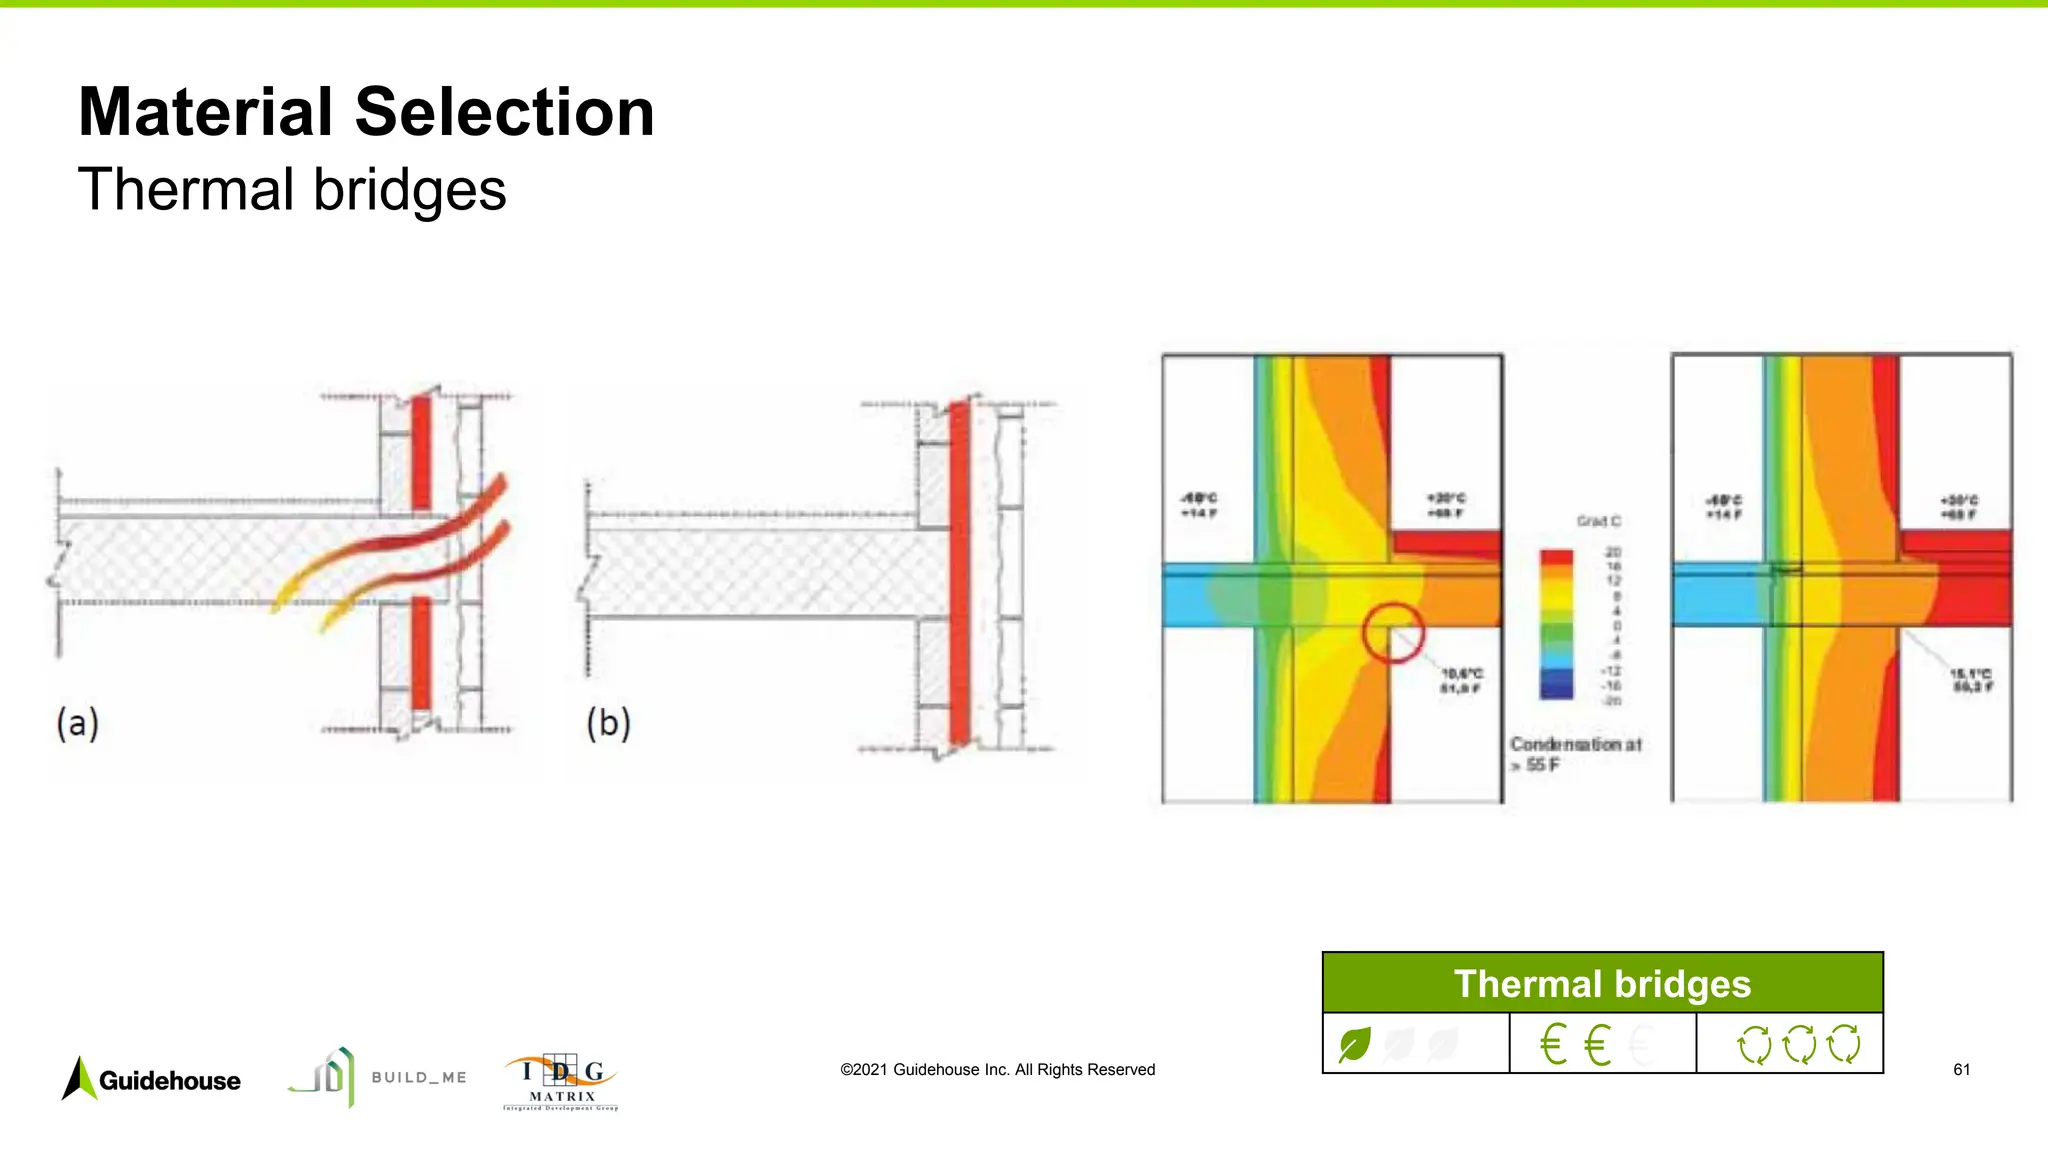
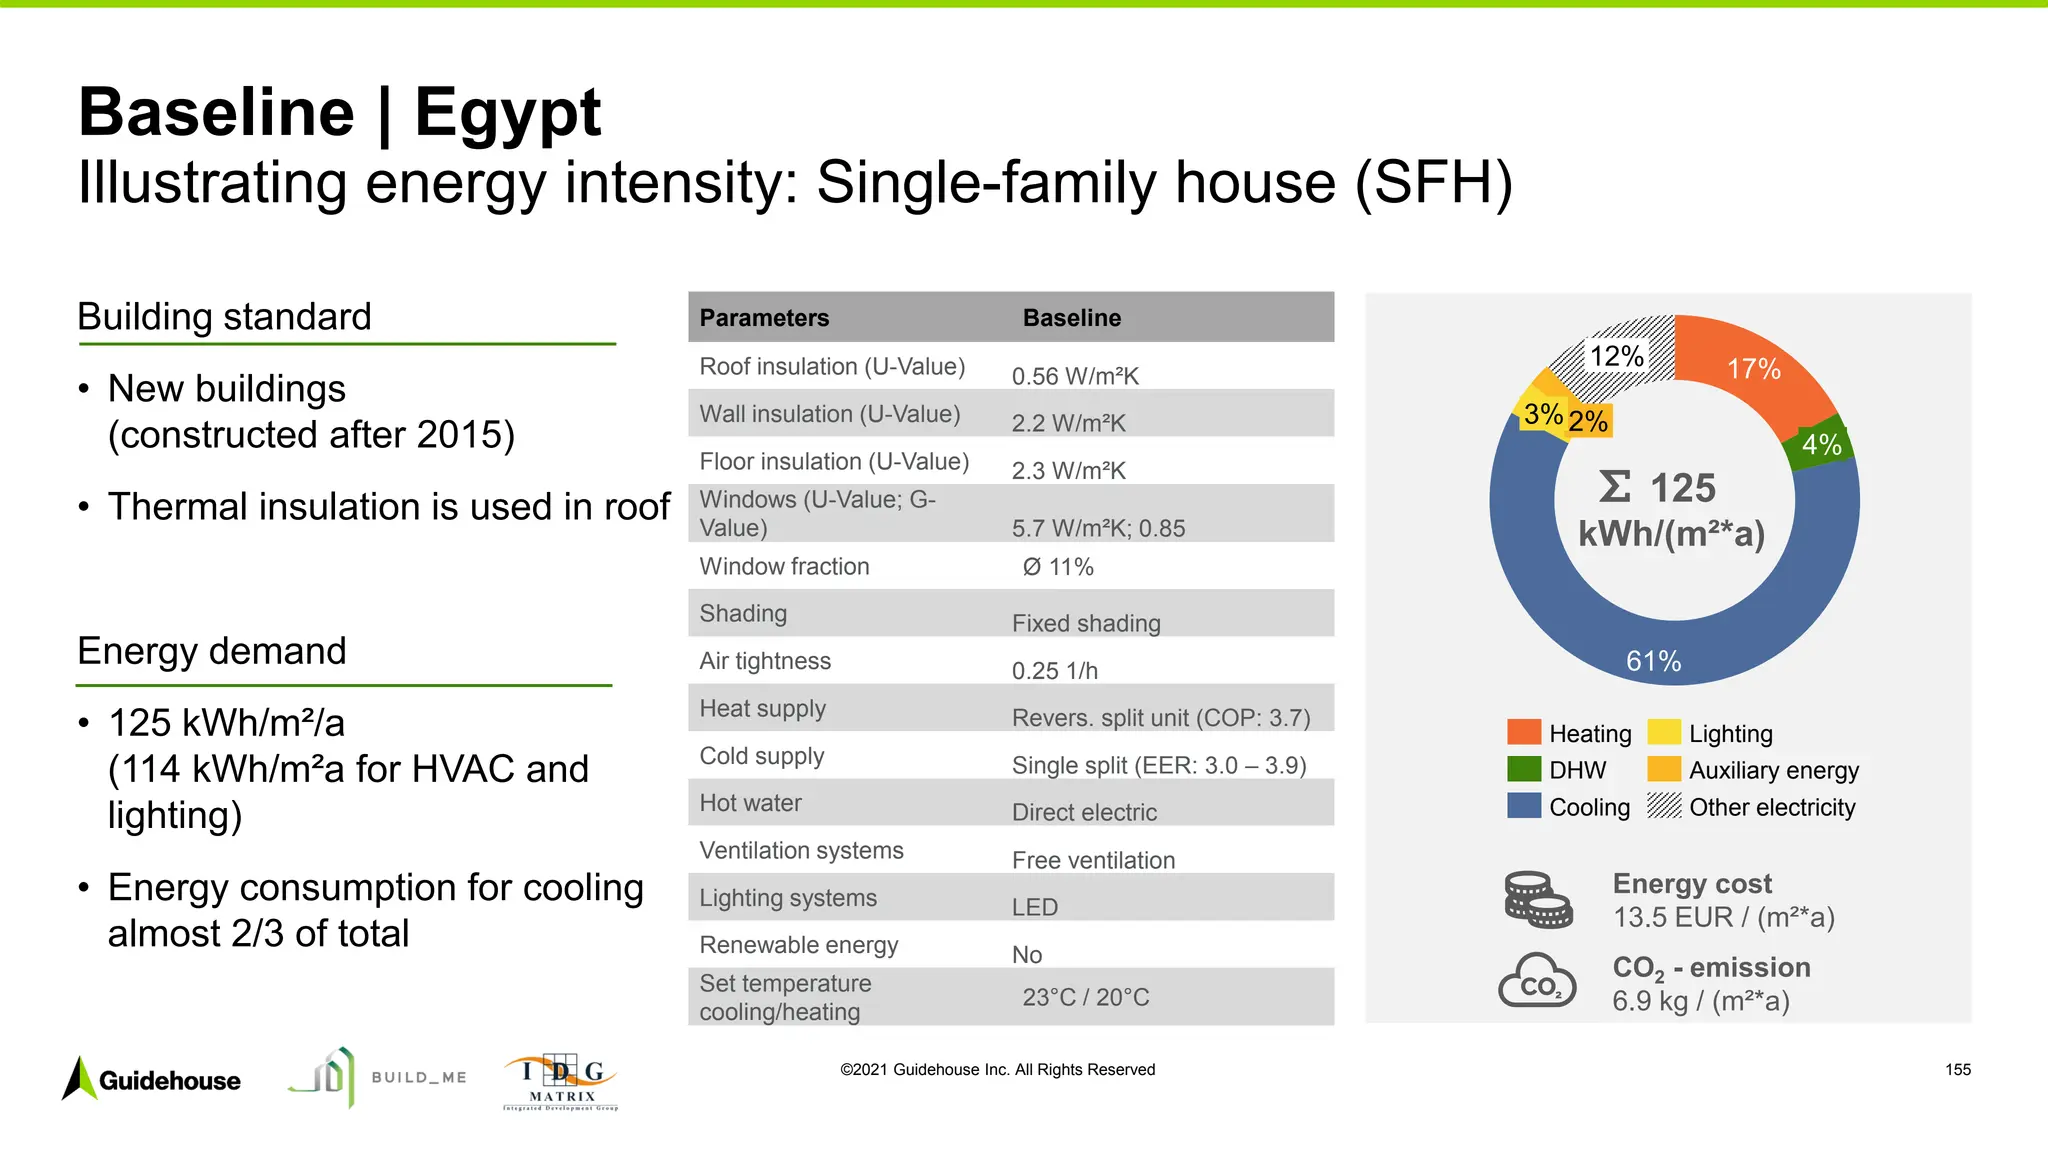
Window Wall Ratio [WWR]
Natural Lighting
Windows and their ratio
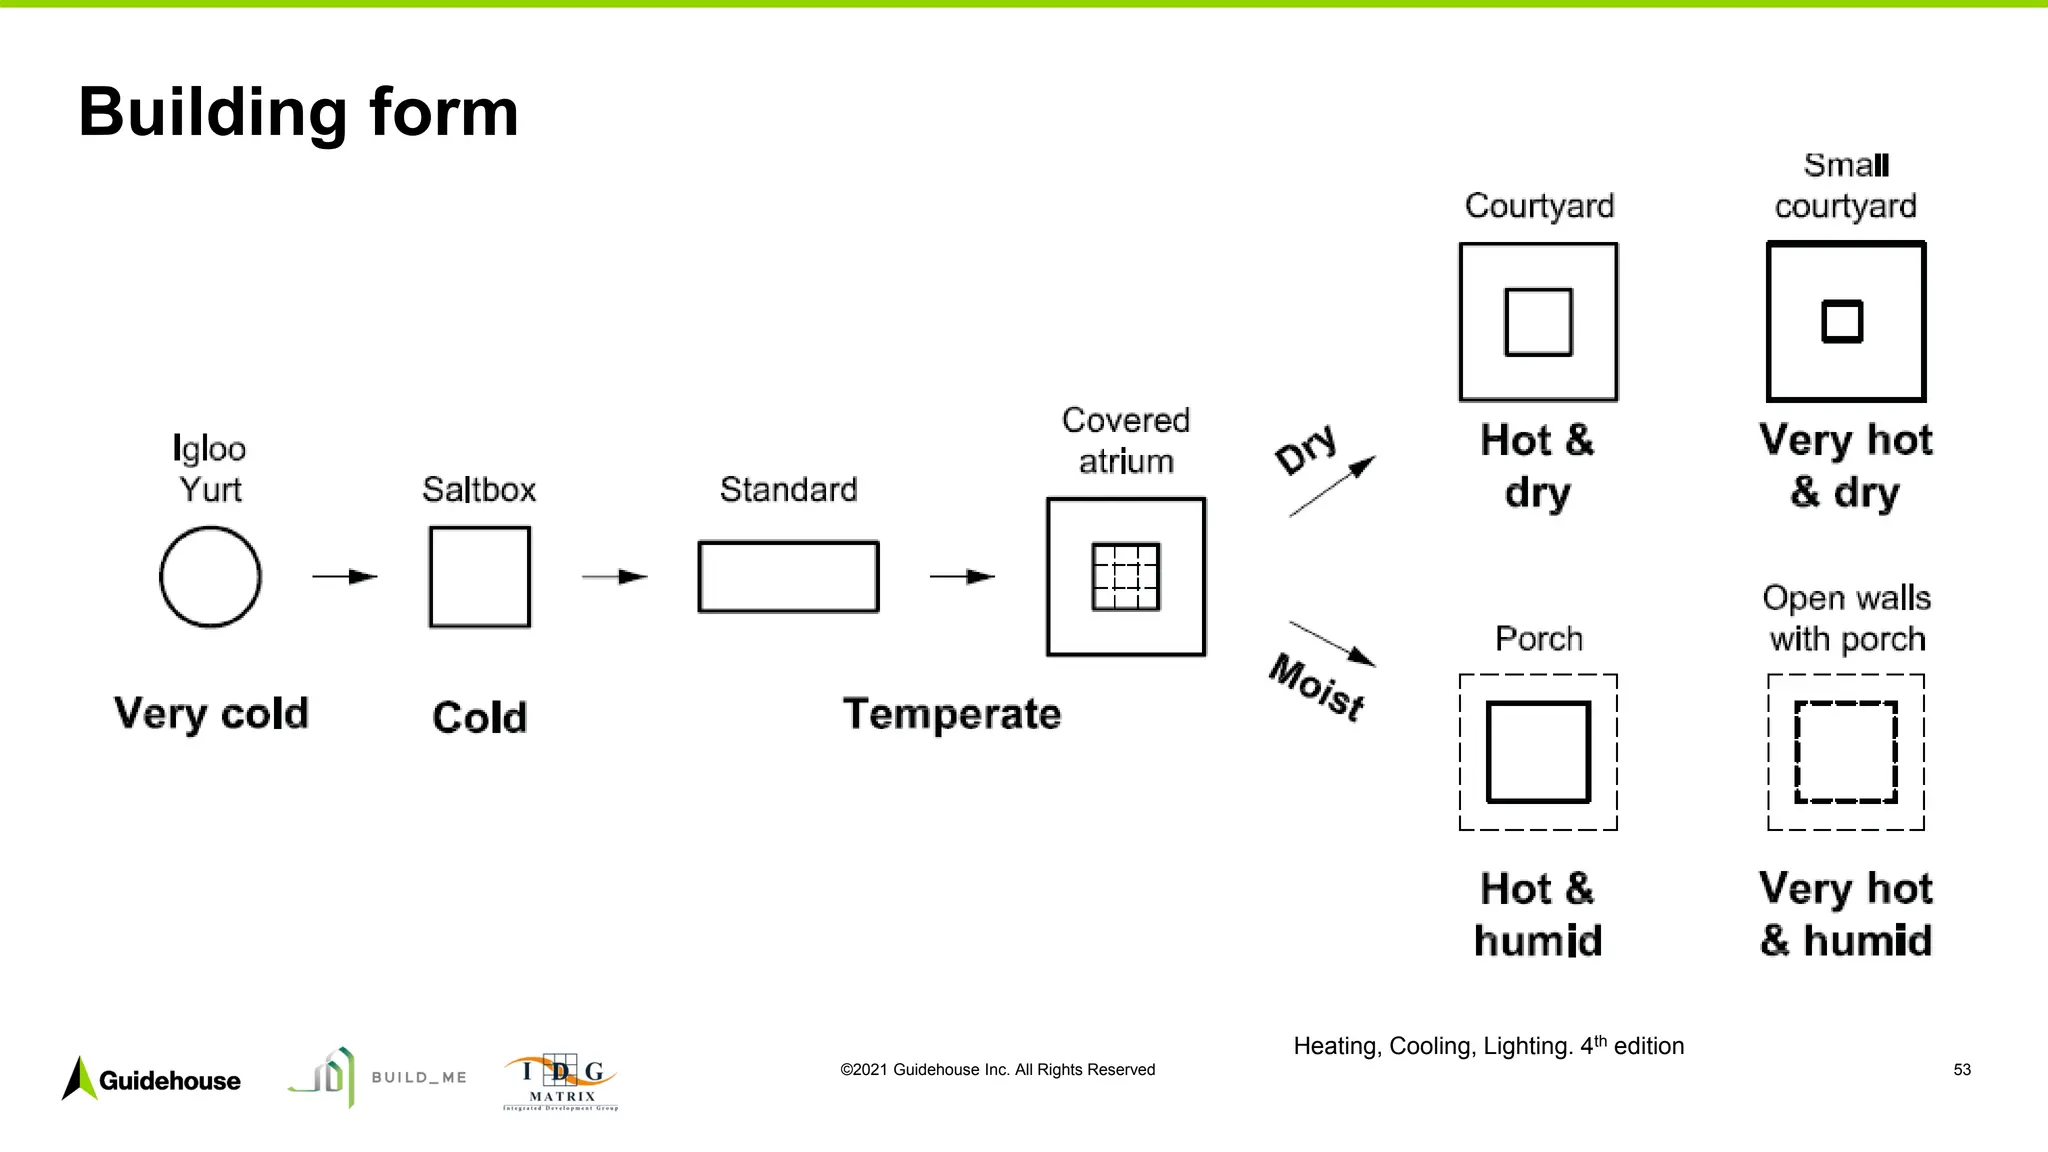
Heating, Cooling, Lighting. 4th edition
Energy Efficient Building Guidelines for MENA region](https://image.slidesharecdn.com/eebuildingguidelineformenaregion-241123132054-1979597a/75/EE-Building-Guideline-for-MENA-Region-pdf-56-2048.jpg)


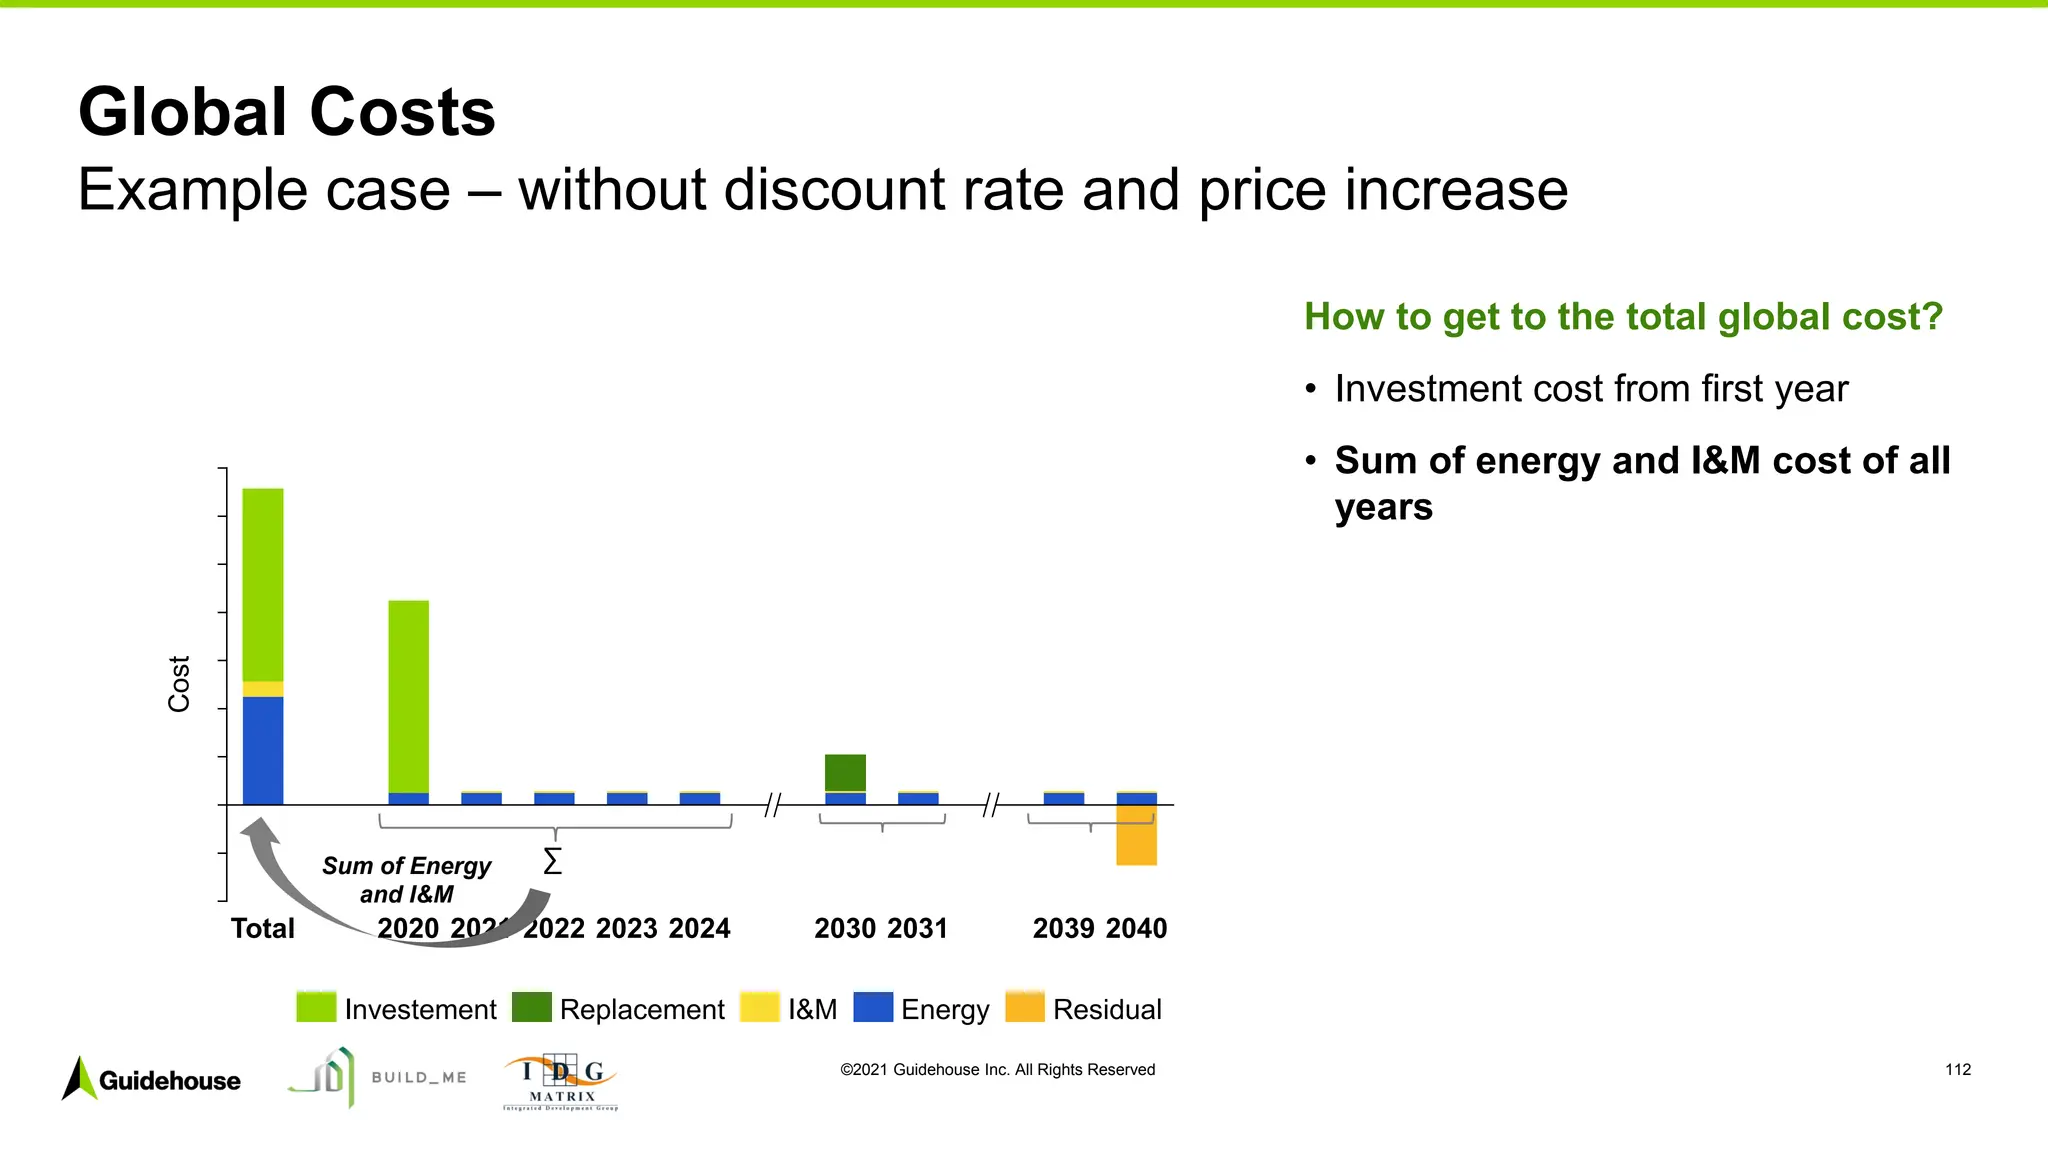


![©2021 Guidehouse Inc. All Rights Reserved 119
Total
cost
of
cooling
system
[EUR]
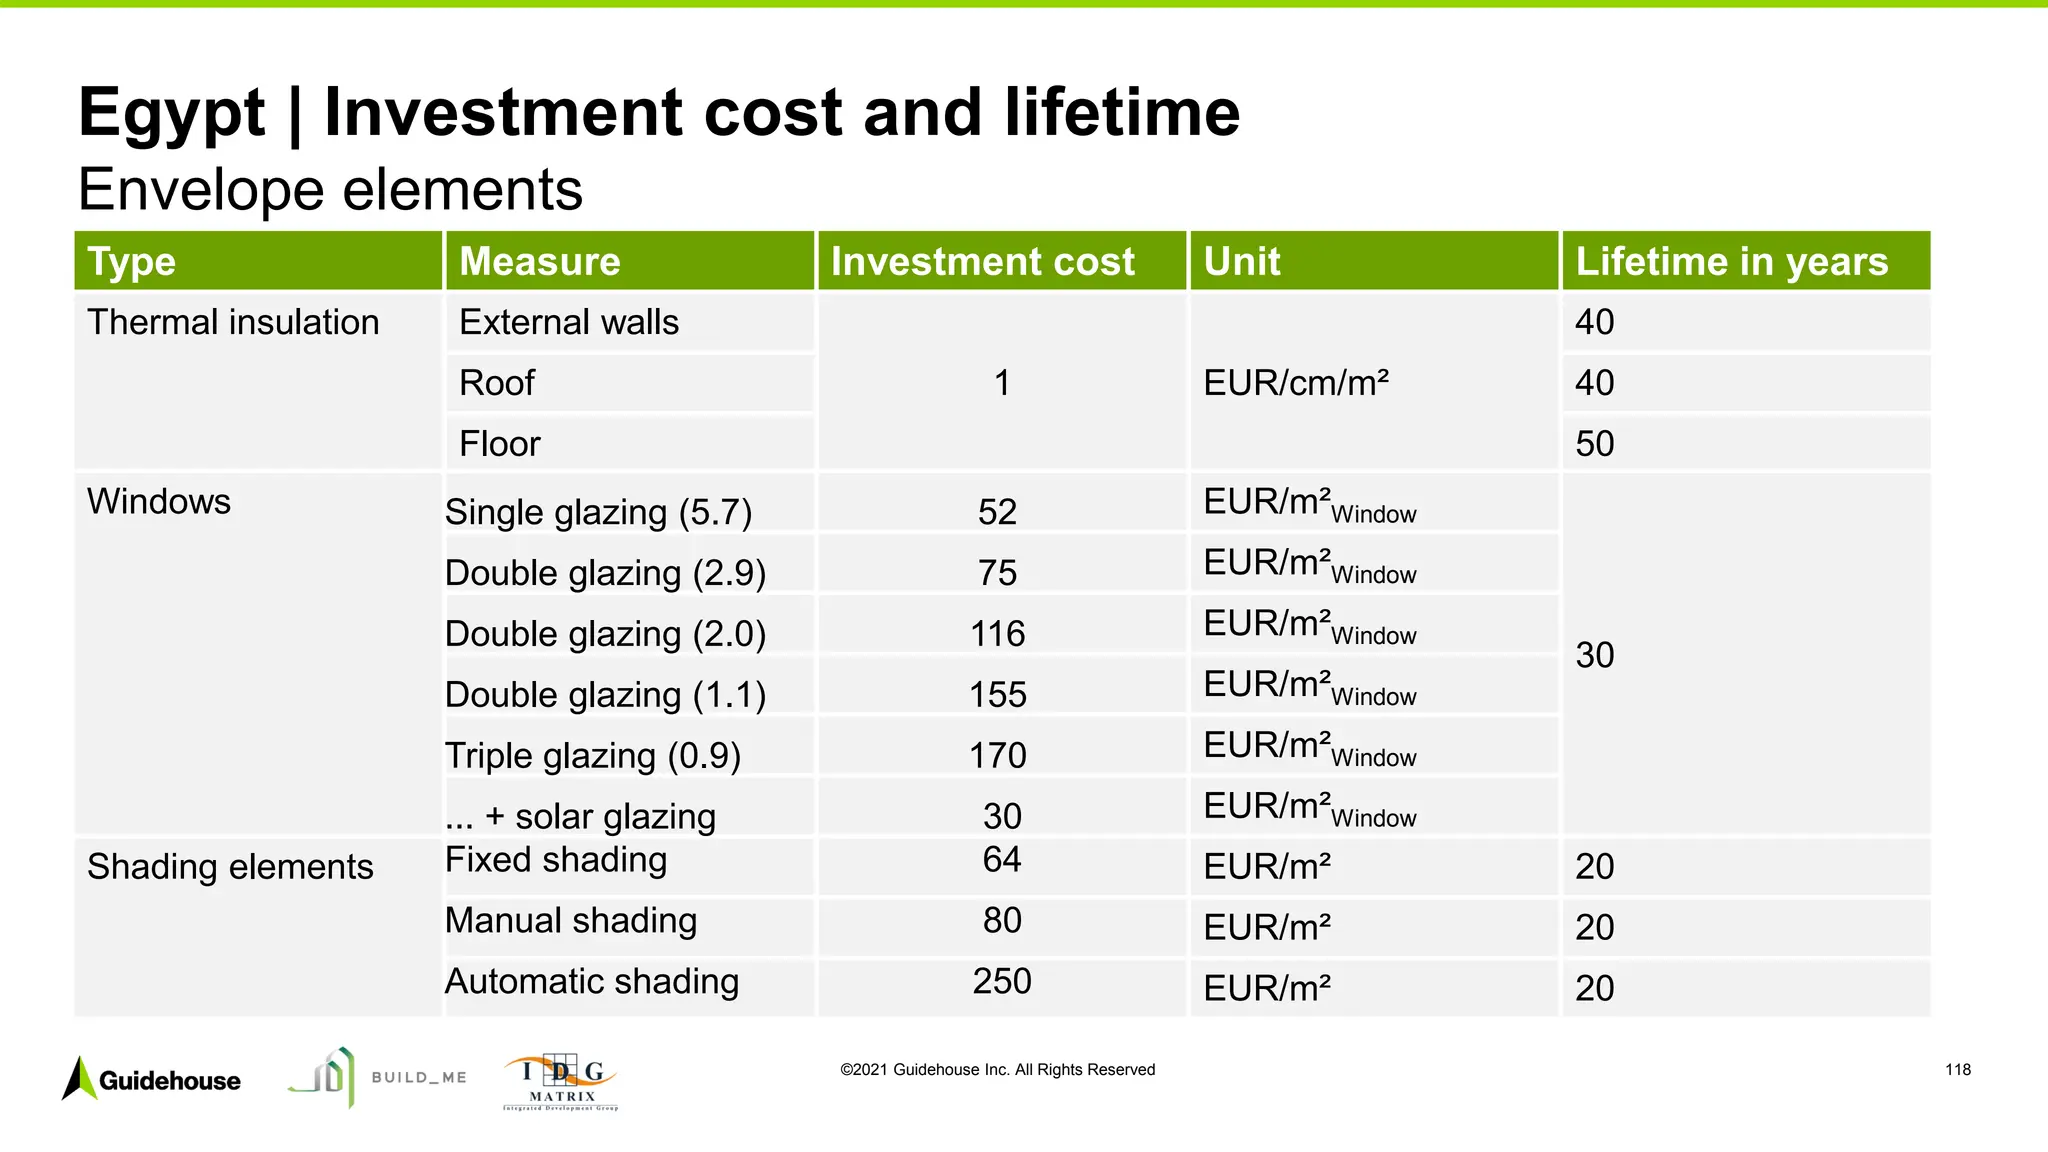
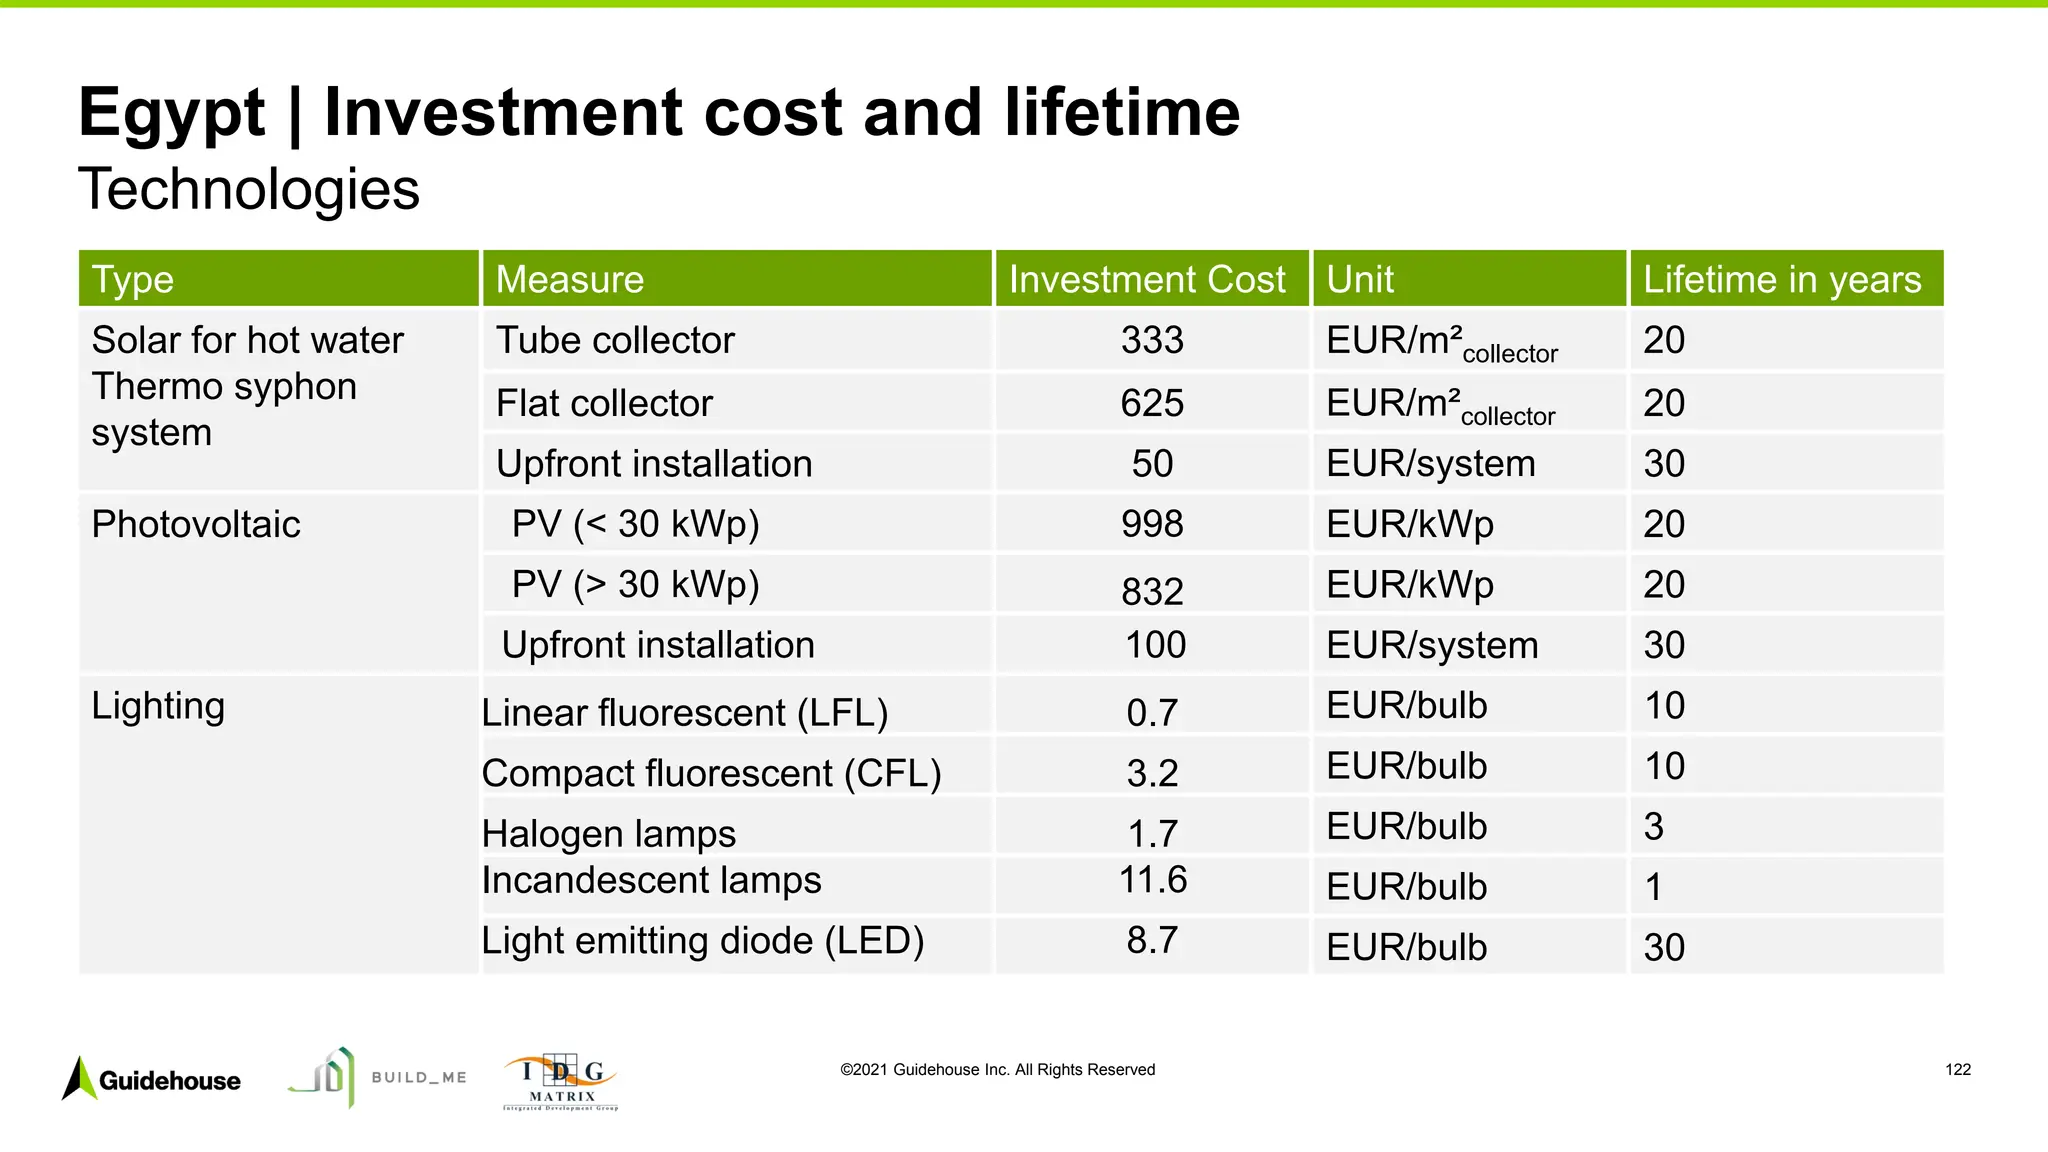
Egypt | Investment cost and lifetime
HVAC systems - cooling
0
1.000
2.000
3.000
4.000
5.000
6.000
7.000
8.000
15
10
0 5 20
Movable system
Mounted single-split
VRF
Multi-split
Central system | Surface
Central system | Fan coil
Central system | Air vent
0
10.000
20.000
30.000
40.000
50.000
60.000
70.000
80.000
90.000
100.000
70
20 30 60
40 90
50 80 100
Cooling systems 1 – 20 kW Cooling systems 20 - 100 kW
Total
cost
of
cooling
system
[EUR]](https://image.slidesharecdn.com/eebuildingguidelineformenaregion-241123132054-1979597a/75/EE-Building-Guideline-for-MENA-Region-pdf-119-2048.jpg)
![©2021 Guidehouse Inc. All Rights Reserved 120
Egypt | Investment cost and lifetime
HVAC systems - Heating
0
200
400
600
800
1.000
1.200
1.400
1.600
1.800
10
0 5 20
15
Total
cost
of
cooling
system
[EUR]
Power [kW]
Portable kerosene heater Oil condensing
Portable LPG (gas) heater Oil non-condensing
Gas condensing
Gas non-condensing
0
1.000
2.000
3.000
4.000
5.000
6.000
7.000
8.000
9.000
50
20 90
40
30 80
60 70 100
Power [kW]
Total
cost
of
cooling
system
[EUR]
Heating systems 1 – 20 kW Heating systems 20 - 100 kW](https://image.slidesharecdn.com/eebuildingguidelineformenaregion-241123132054-1979597a/75/EE-Building-Guideline-for-MENA-Region-pdf-120-2048.jpg)
![©2021 Guidehouse Inc. All Rights Reserved 121
Egypt | Investment cost and lifetime
HVAC systems – Hot water
0
20
40
60
80
100
120
140
160
180
200
220
0 2 4 6 8
Total
cost
of
cooling
system
[EUR]
Power [kW]
0
50
100
150
200
250
300
350
400
450
500
550
5.0 10.0 15.0 20.0
Power [kW]
Total
cost
of
cooling
system
[EUR]
DHW systems 1 – 7.5 kW DHW systems 7.5 - 20 kW
Dedicated gas heater
Dedicated electric heater
Combi system (add. cost to space heating boiler)](https://image.slidesharecdn.com/eebuildingguidelineformenaregion-241123132054-1979597a/75/EE-Building-Guideline-for-MENA-Region-pdf-121-2048.jpg)

![©2021 Guidehouse Inc. All Rights Reserved 124
Approach and methodology
Steps towards a low energy building
1
Final
recommendations
Comparison with
baseline
Energy efficiency
recommendations
Development
▪ Estimate the baseline consumption
▪ Estimate the consumption of current
design
▪ Comparison
▪ Building envelope
▪ HVAC I efficiencies
▪ Renewables
▪ Other measures
▪ Optimized as result
▪ Discussion with developers
▪ Local and market inputs
▪ Costs and ROI
▪ Final loop discussing feasibility of
measures
▪ Adapt selected measures and
finalize calculation including
payback, investment and lifetime
2 3 4
0
10
20
30
40
50
60
70
80
BaU Current
Energy
Demand
[kWh/(m²a)]
Space heating Space cooling
Lighting Auxiliary energy
Ventilation
0
10
20
30
40
50
60
70
80
BaU Current
Energy
Demand
[kWh/(m²a)]
Space heating Space cooling
Lighting Auxiliary energy
Ventilation
Building
Envelope
HVAC Building
Systems
Renewables
0
5
10
15
20
25
Final
energy
demand
[kWh/m²a]
Space heating Space cooling Lighting
Auxiliary energy Ventilation
585
352
208
-100
0
100
200
300
400
500
600
700
BaU Current Optimized
Specific
Cost
[EUR/m²]
Investment Replacement
Residual Values Energy Cost
I & M Specific global costs
1](https://image.slidesharecdn.com/eebuildingguidelineformenaregion-241123132054-1979597a/75/EE-Building-Guideline-for-MENA-Region-pdf-124-2048.jpg)

![©2021 Guidehouse Inc. All Rights Reserved 126
Case Study Egypt I Multi-family house in Alexandria
External wall | Analysis of energy and global cost savings
Final energy demand Global cost
BaU: U-Value = 2.1 W/m²K
Single wall (25 cm bricks)
Var 1: U-Value = 1.11 W/m²K
Double wall with air gap 5 cm
Var 2: U-Value = 0.73 W/m²K
Double wall 2cm air gap, 3cm insulation
Var 3: U-Value = 0.53 W/m²K
Double wall 2cm air gap, 5cm insulation
Var 4: U-Value = 0.38 W/m²K
Double wall 2cm air gap, 8cm insulation
Result: Var 4 with 8 cm
insulation is the most cost
effective measure.
Current plan**
10 10 10 10 10
10 10 10 10 10
64
46 41 39 38
21
13
10 9 8
0
10
20
30
40
50
60
70
80
90
100
110
120
4
2
Energy
demand
[kWh/(m²a)]
4
3
BaU - 2.1* Var 1
- 0.73
4
2
Var 2
- 0.53
4
72
2
77
Var 3
- 0.43
4
2
Var 4
- 0.38
112
85
75
-36%
Auxiliary energy
Space heating
Space cooling
DHW
Lighting HH Electricity
5 5 4 4 4
156
118 108 104 100
35
35
30 30 30
90
92
85 87 90
-22 -22 -19 -19 -20
-50
0
50
100
150
200
250
300
Var 2
- 0.53
Var 1
- 0.73
Cost
[EUR/m²]
BaU - 2.1* Var 3
- 0.43
Var 4
- 0.38
264
228
208 204
206
-23%
Replacement
Investment
Energy Cost
Residual Values I & M
**Current plan is actually even worse than BaU
*Baseline is 2.4, BaU as measure 2.1](https://image.slidesharecdn.com/eebuildingguidelineformenaregion-241123132054-1979597a/75/EE-Building-Guideline-for-MENA-Region-pdf-126-2048.jpg)
![©2021 Guidehouse Inc. All Rights Reserved 127
Case Study Egypt I Multi-family house in Alexandria
Windows | Analysis of energy and global cost savings
Final energy demand Global cost
BaU – Single glazing
U value 5.7 W/m²K
G-Value 0.85
Double glazing (Var 1)
U value 2.9 W/m²K
G-Value 0.7
Double glazing low E
U value 1.3 W/m²K,
G-Value 0.7
Triple glazing
U value 1.3 W/m²K,
G-Value 0.7
Var 1 (double glazing) is the
more cost-effective case, with
improved but not best window.
10 10 10 10
10 10 10 10
64
54 51 45
21
16
12
11
0
10
20
30
40
50
60
70
80
90
100
110
120
Double
glazing
(3.0, 0.7)
4
2
2
Energy
demand
[kWh/(m²a)]
4
4
3
Single glazing
(5.7, 0.85)
2
Double
glazing low
E (1.3, 0.65)
4
83
Triple glazing
(0.9, 0.5)
112
96
89
-15%
Space heating
Lighting
Space cooling
Auxiliary energy
DHW
HH Electricity
156
134 123 115
35
35
35 35
91
105 128 134
-22 -24 -27 -28
-50
0
50
100
150
200
250
300
Double
glazing
(3.0, 0.7)
Single glazing
(5.7, 0.85)
Triple glazing
(0.9, 0.5)
5
Double
glazing low
E (1.3, 0.65)
Cost
[EUR/m²]
5 5 5
265 255
264 261
-4%
I & M
Replacement
Investment Residual Values
Energy Cost
Current plan](https://image.slidesharecdn.com/eebuildingguidelineformenaregion-241123132054-1979597a/75/EE-Building-Guideline-for-MENA-Region-pdf-127-2048.jpg)
![©2021 Guidehouse Inc. All Rights Reserved 128
BaU
Reversible Split Unit
Real annual EER: 3.4
Var 1 | 2 | 3
Reversible Split Unit with increased
efficiency
Real annual EER: 3.7 | 4.0 | 4.5
Case Study Egypt I Multi-family house in Alexandria
HVAC | Analysis of energy and global cost savings
Final energy demand Global cost
Var 3 (System with best COP)
has the highest efficiency and is
most cost-effective.
*resulting EER over year
10 10 10 10
10 10 10 10
88
64
48
39
21
21
21
21
0
20
40
60
80
100
120
140
3 4
Var 1 -
EER* 3.7
4
Energy
demand
[kWh/(m²a)]
3 4
BaU -
EER* 3.4
4 3
Var 2 -
EER* 4.0
3
Var 3 -
EER* 4.5
137
112
96
87
-36%
Space heating Auxiliary energy
Lighting
DHW
HH Electricity
Space cooling
190
156
134 121
31
35
38 42
84
90
97 103
-22 -25 -28
-50
0
50
100
150
200
250
300
350
-19
Cost
[EUR/m²]
5
4
BaU -
EER* 3.4
Var 1 -
EER* 3.7
5
Var 2 -
EER* 4.0
6
Var 3 -
EER* 4.5
290
264
249 244
-16%
Replacement
Investment Residual Values
Energy Cost
I & M](https://image.slidesharecdn.com/eebuildingguidelineformenaregion-241123132054-1979597a/75/EE-Building-Guideline-for-MENA-Region-pdf-128-2048.jpg)

![©2021 Guidehouse Inc. All Rights Reserved 130
Case Study Egypt I Multi-Family House in Alexandria
Comparative overview of BaU vs. current vs. optimised
Final Energy Demand Global Cost
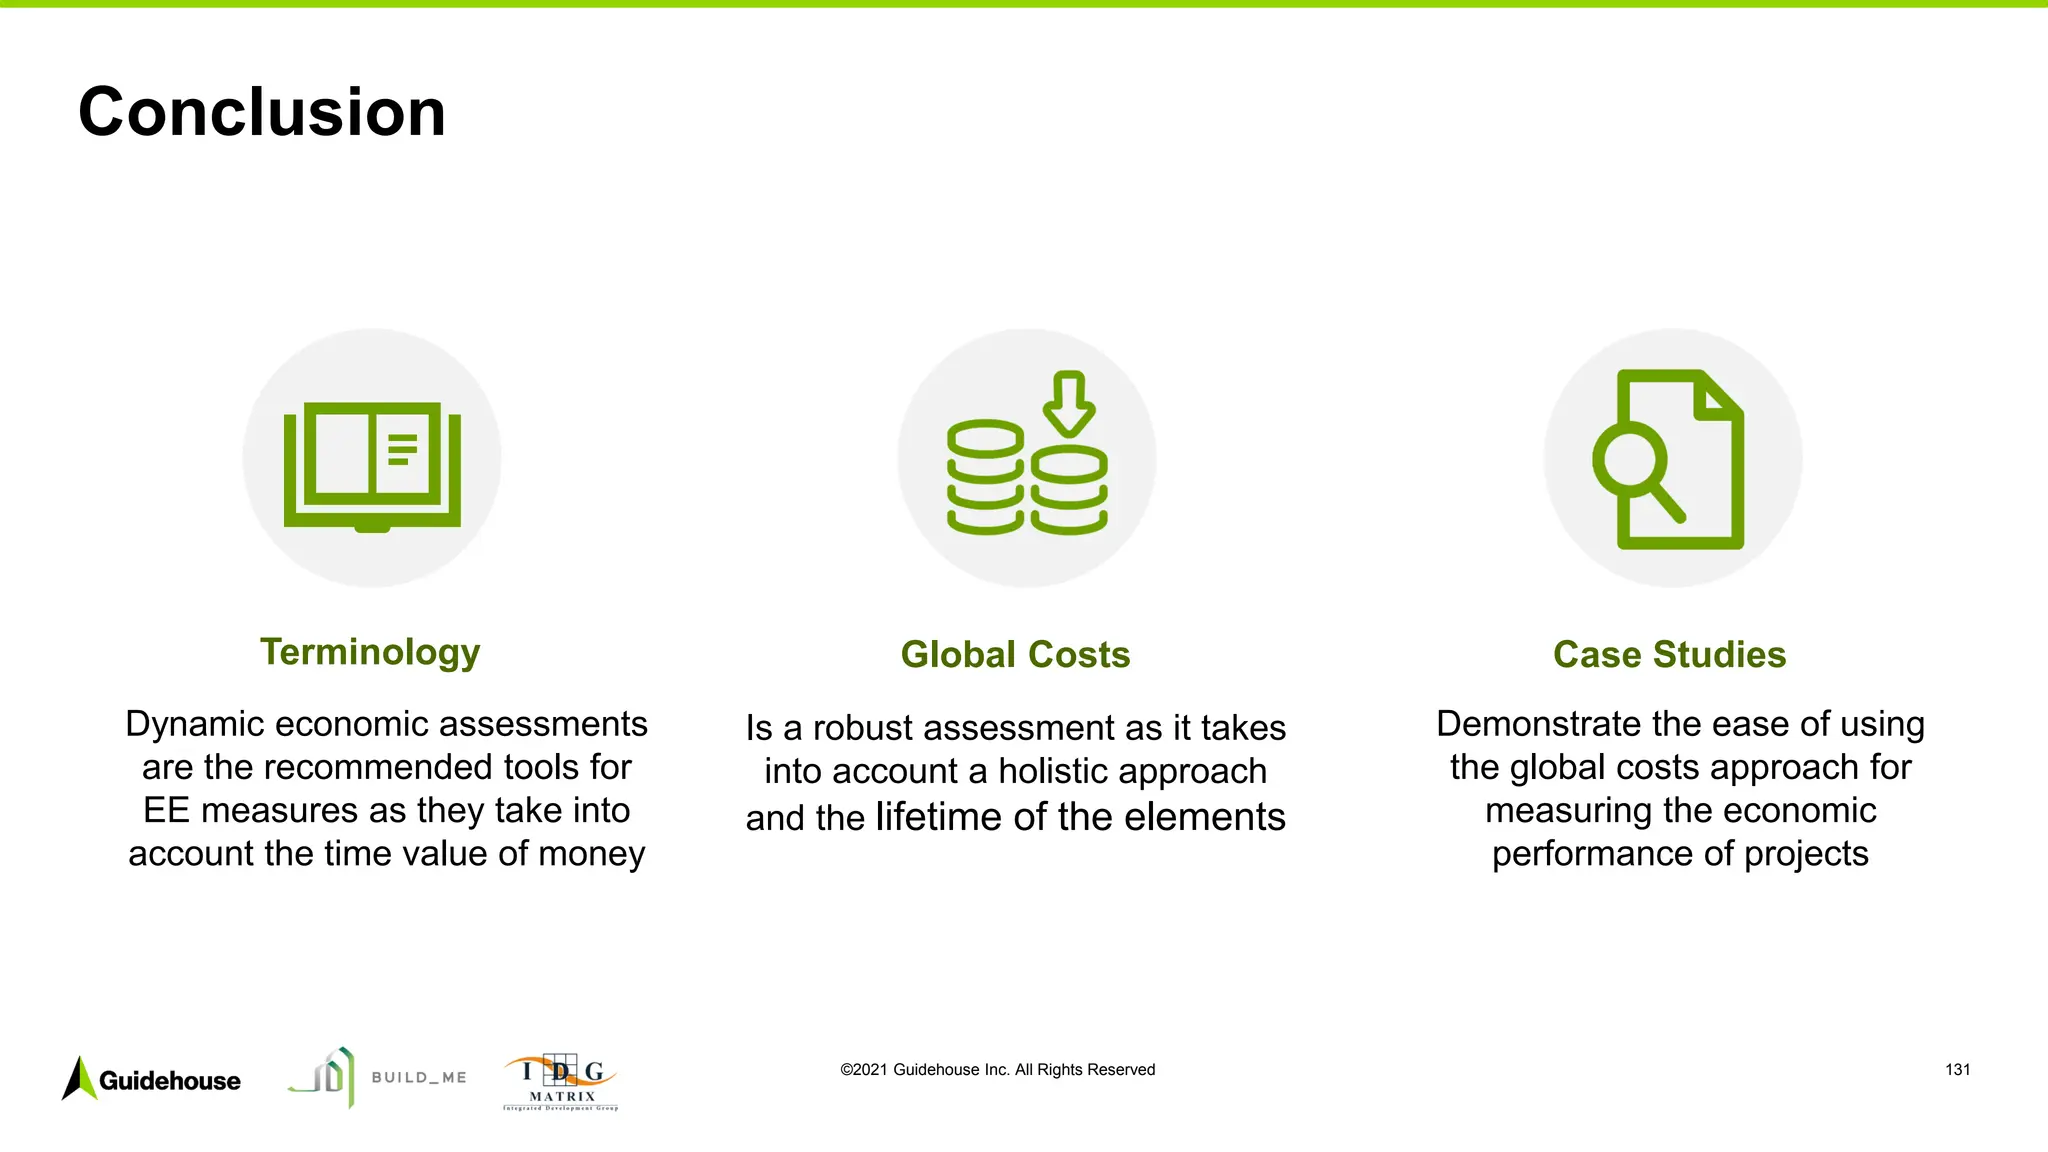
Conclusion
• The suggested measures
and the current situation
lead to a significant
decrease in energy
demand
• The optimized solution,
detected the most cost
effective efficiency
measures
Savings
Energy: - 86%
Cost: - 46%
10 10 10 0
4
10 10
64
53
9
25
-12
-20
0
20
40
60
80
100
120
4
105
3
4
Energy
demand
[kWh/(m²a)]
21
3
16
Baseline
3
Current
1
Optimized
112
0
0
-86%
Lighting
Space heating
Space cooling
DHW Auxiliary energy PV
HH Electricity
156 146
22
35
35
31
91
92
108
-22 -22 -26
-50
0
50
100
150
200
250
300
Cost
[EUR/m²]
Current
5
5
Baseline
7
Optimized
265 256
142
-46%
Residual Values
Investment
Replacement
I & M
Energy Cost](https://image.slidesharecdn.com/eebuildingguidelineformenaregion-241123132054-1979597a/75/EE-Building-Guideline-for-MENA-Region-pdf-130-2048.jpg)


![©2021 Guidehouse Inc. All Rights Reserved 145
Easier access to financing for energy efficient buildings
Approach
How to design
and finance an
energy efficient
project?
€
BEP Tool shows:
✓ [25]% energy saving
in comparison with
baseline
✓ Financing available at
local bank
Project is
realised as
energy efficient
building
Intermediating bank
grants credit based
on trusted
classification
scheme](https://image.slidesharecdn.com/eebuildingguidelineformenaregion-241123132054-1979597a/75/EE-Building-Guideline-for-MENA-Region-pdf-145-2048.jpg)


![©2021 Guidehouse Inc. All Rights Reserved 154
Key takeaways
• Specific final energy demand
ranges between 115 – 220
kWh/(m²a) for buildings
constructed over the past decade
• Space cooling accounts for
largest energy demand
• Space heating is only installed in
less than 50% of the cases
• Note: Other electricity stands for
plug-loads (e.g. fridge, TV, etc.)
and is informational.
Baseline | Egypt
Illustrating energy intensity of select Egyptian building types
0
20
40
60
80
100
120
140
160
180
200
220
Office
Final
energy
[kWh/(m²a)]
MFH SFH Education Retail Mixed-use
Auxiliary energy
Heating
DHW
Cooling
Lighting Ventilation
Other electricity
National baseline (new buildings, after 2015)](https://image.slidesharecdn.com/eebuildingguidelineformenaregion-241123132054-1979597a/75/EE-Building-Guideline-for-MENA-Region-pdf-154-2048.jpg)


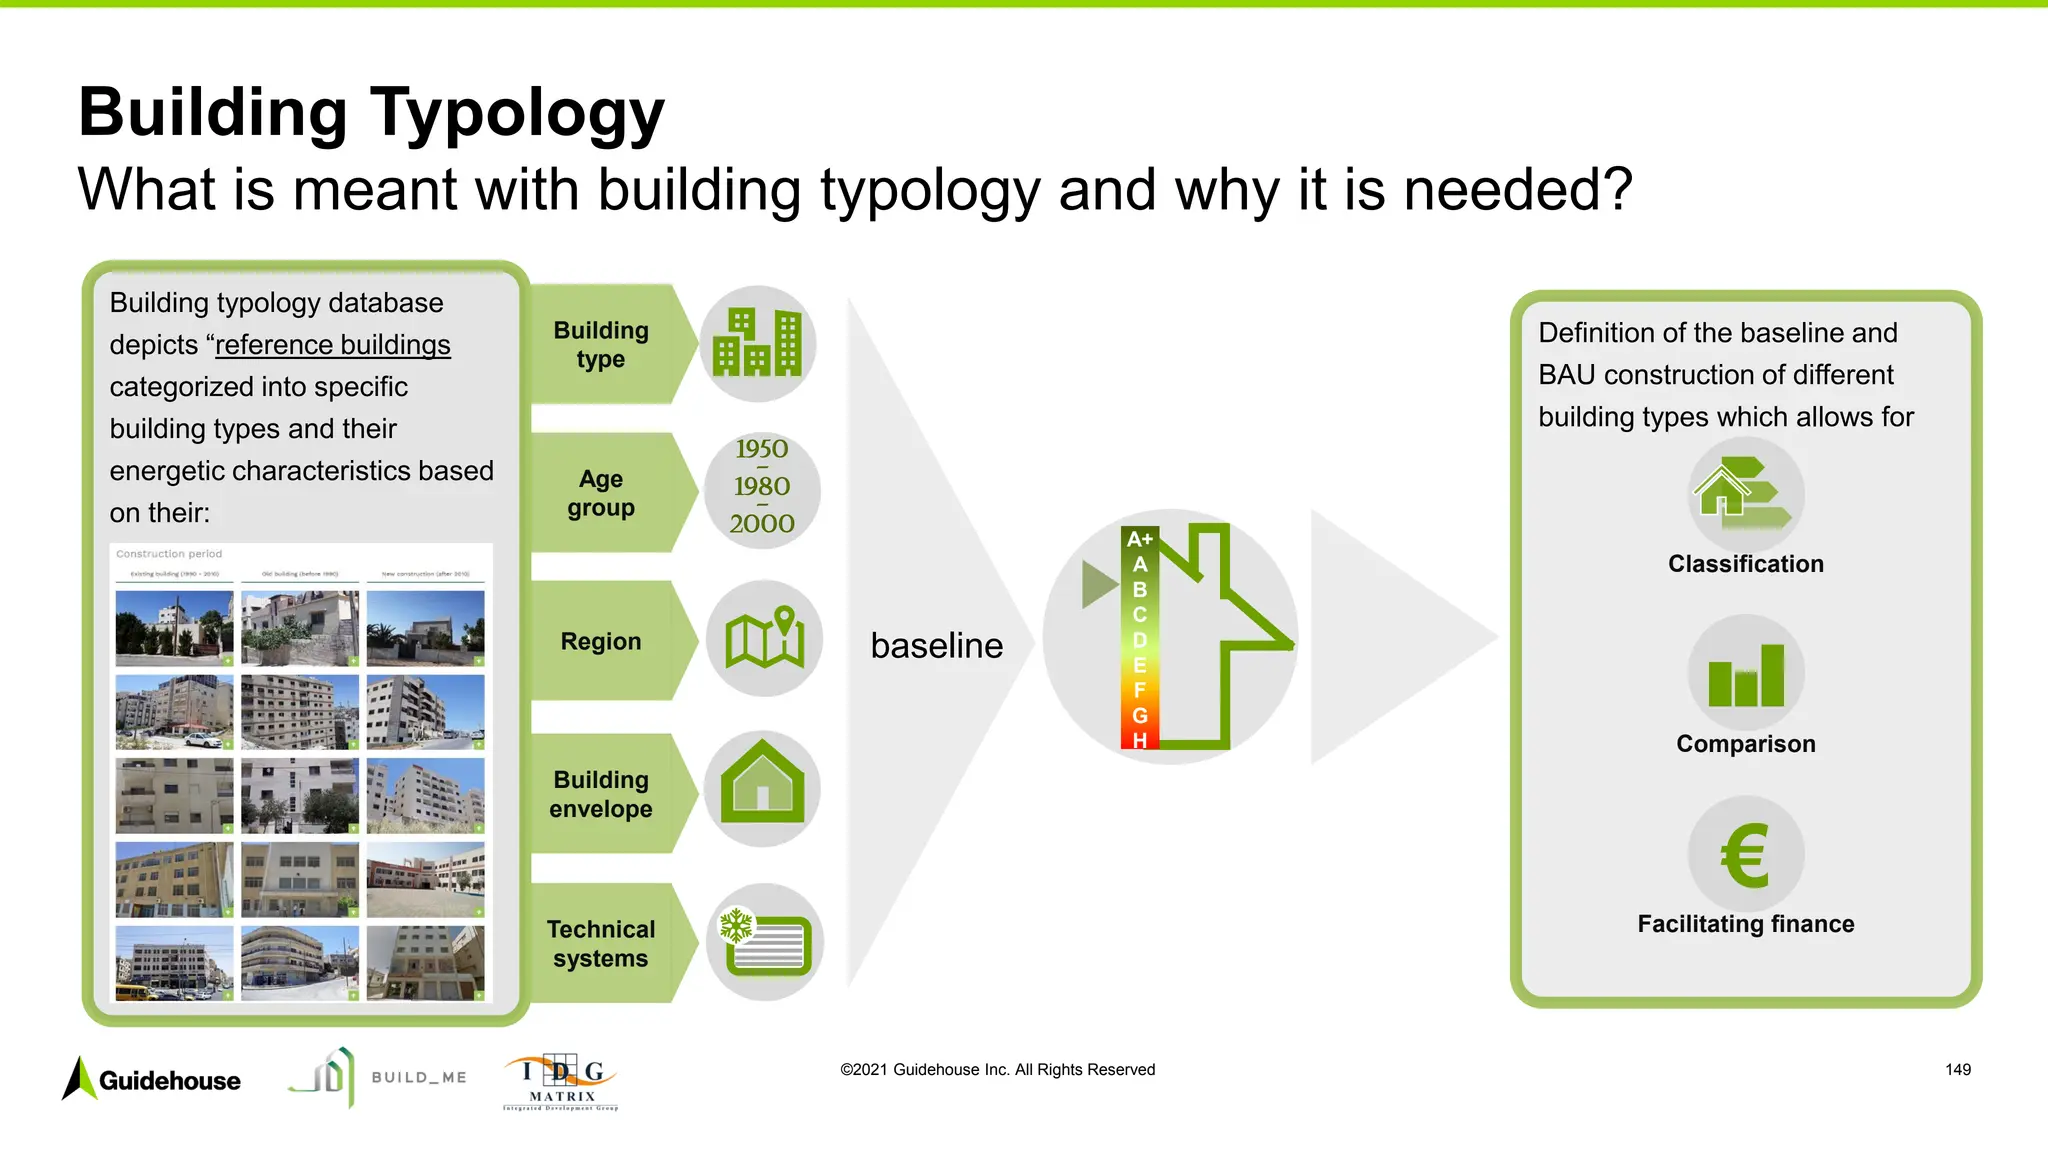
![©2021 Guidehouse Inc. All Rights Reserved 180
Classification scores for
BUILD_ME building types
Application of the classification
score to baseline level
Methodology behind the
BUILD_ME classification
• Classification logic is based on
the European energy
performance certificates of
buildings norm [EN 15217]
• Adapted with feedback from
financial institutes active in the
markets and findings of the
building typology
• Baseline (new buildings energy
consumption) is equal to Class C
(score of 1.0)
Next steps, development of classification scheme
Identification of the rating score
Class Term Score
A
Nearly zero energy
building
<0.25
B
High performance
building
0.25 - 0.75
C
Average new
construction
0.76 - 1.25
D Stock, better quality 1.26 - 1.75
E
Stock, medium
quality
1.76 - 2.25
F Stock, poor quality 2.26 - 2.75
G
Stock, urgent
renovation demand
>2.75
A
B
C
D
E
F
G
- 75%
- 25%
Baseline
+ 25%
+ 75%
+ 125%
+ 175%](https://image.slidesharecdn.com/eebuildingguidelineformenaregion-241123132054-1979597a/75/EE-Building-Guideline-for-MENA-Region-pdf-180-2048.jpg)


![[Metropolia Student Project Seminar 24.5.] Zero Energy Buildings, Group A](https://cdn.slidesharecdn.com/ss_thumbnails/zeroenergybuildings-presentation24-5-2012-120528082031-phpapp01-thumbnail.jpg?width=640&height=640&fit=bounds)


