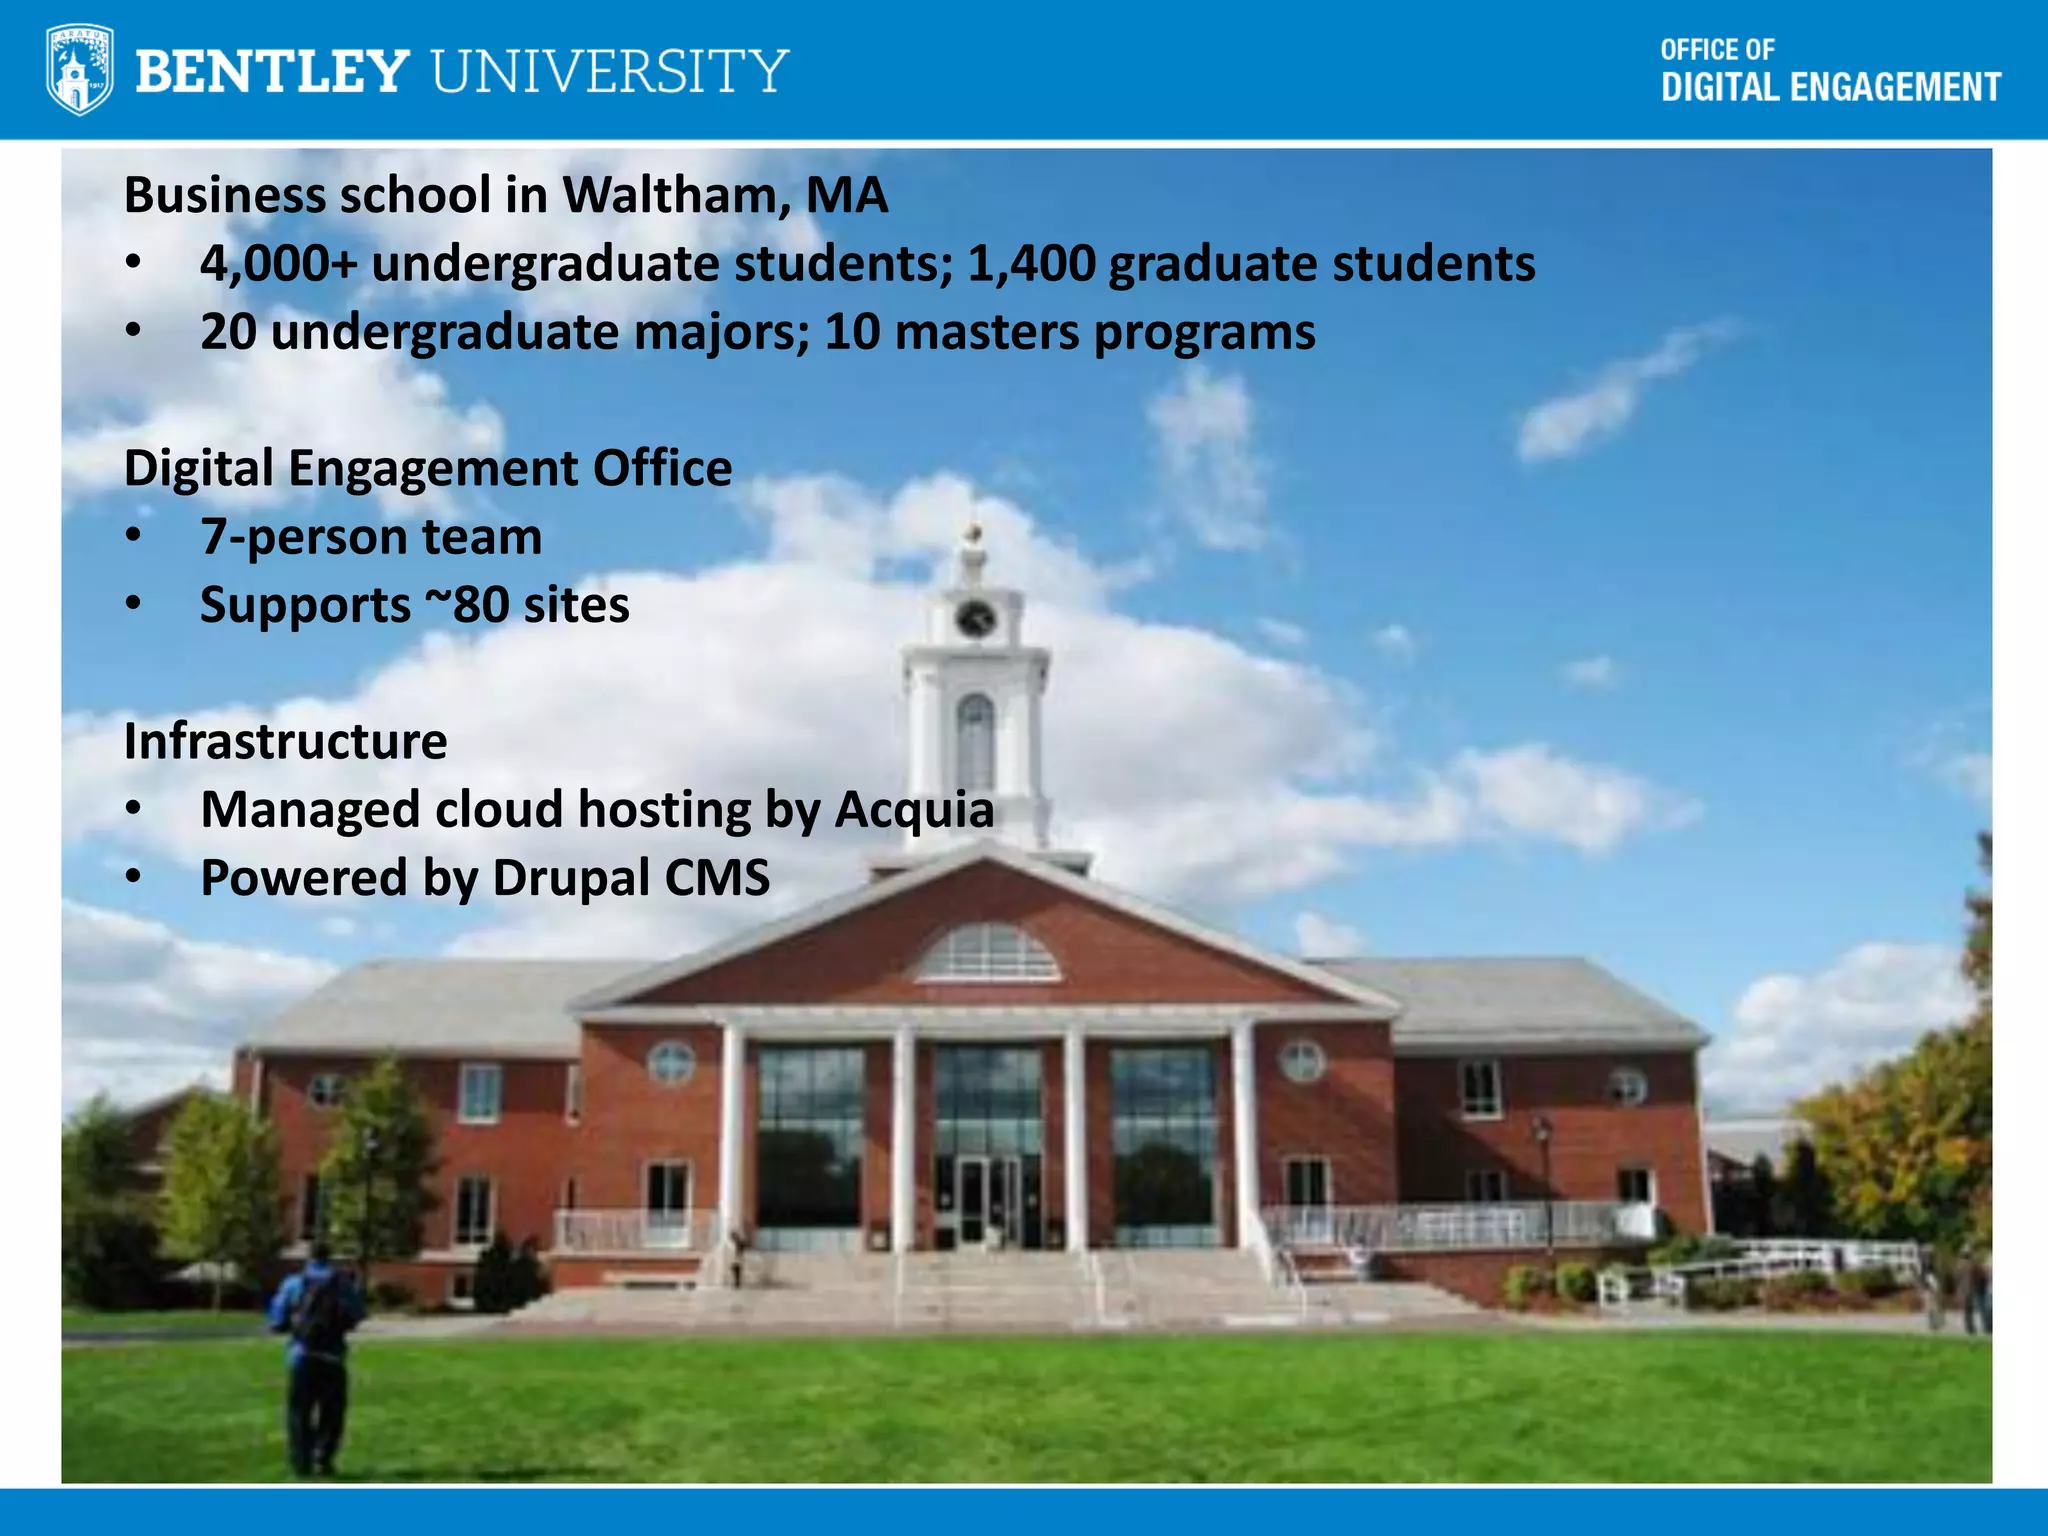
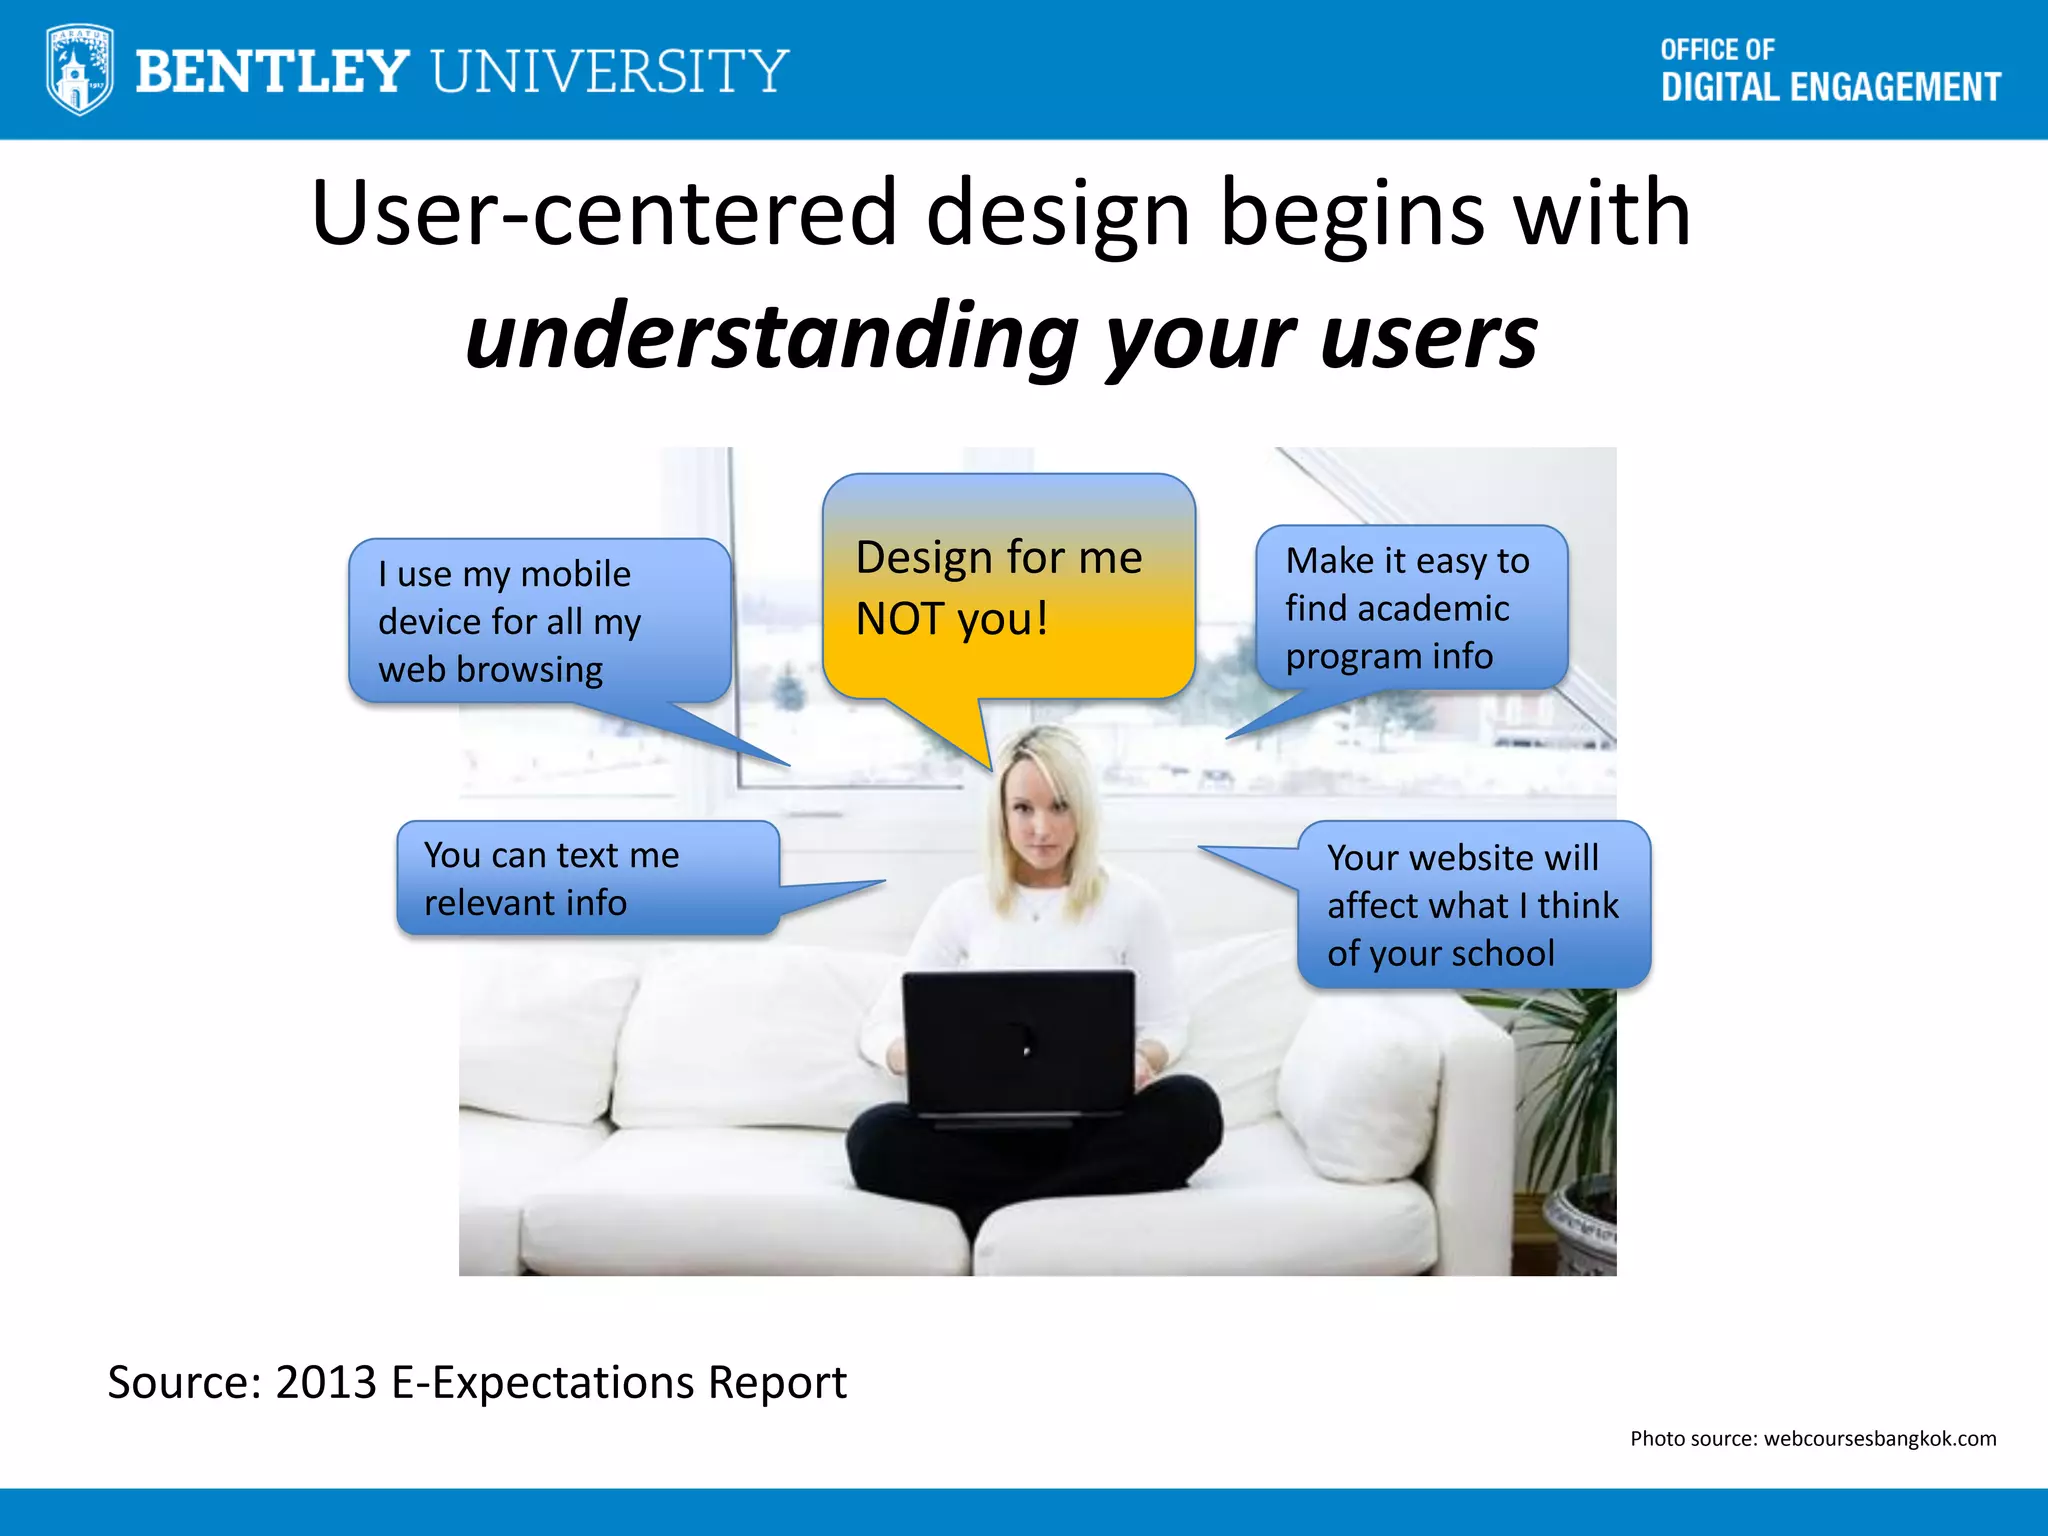
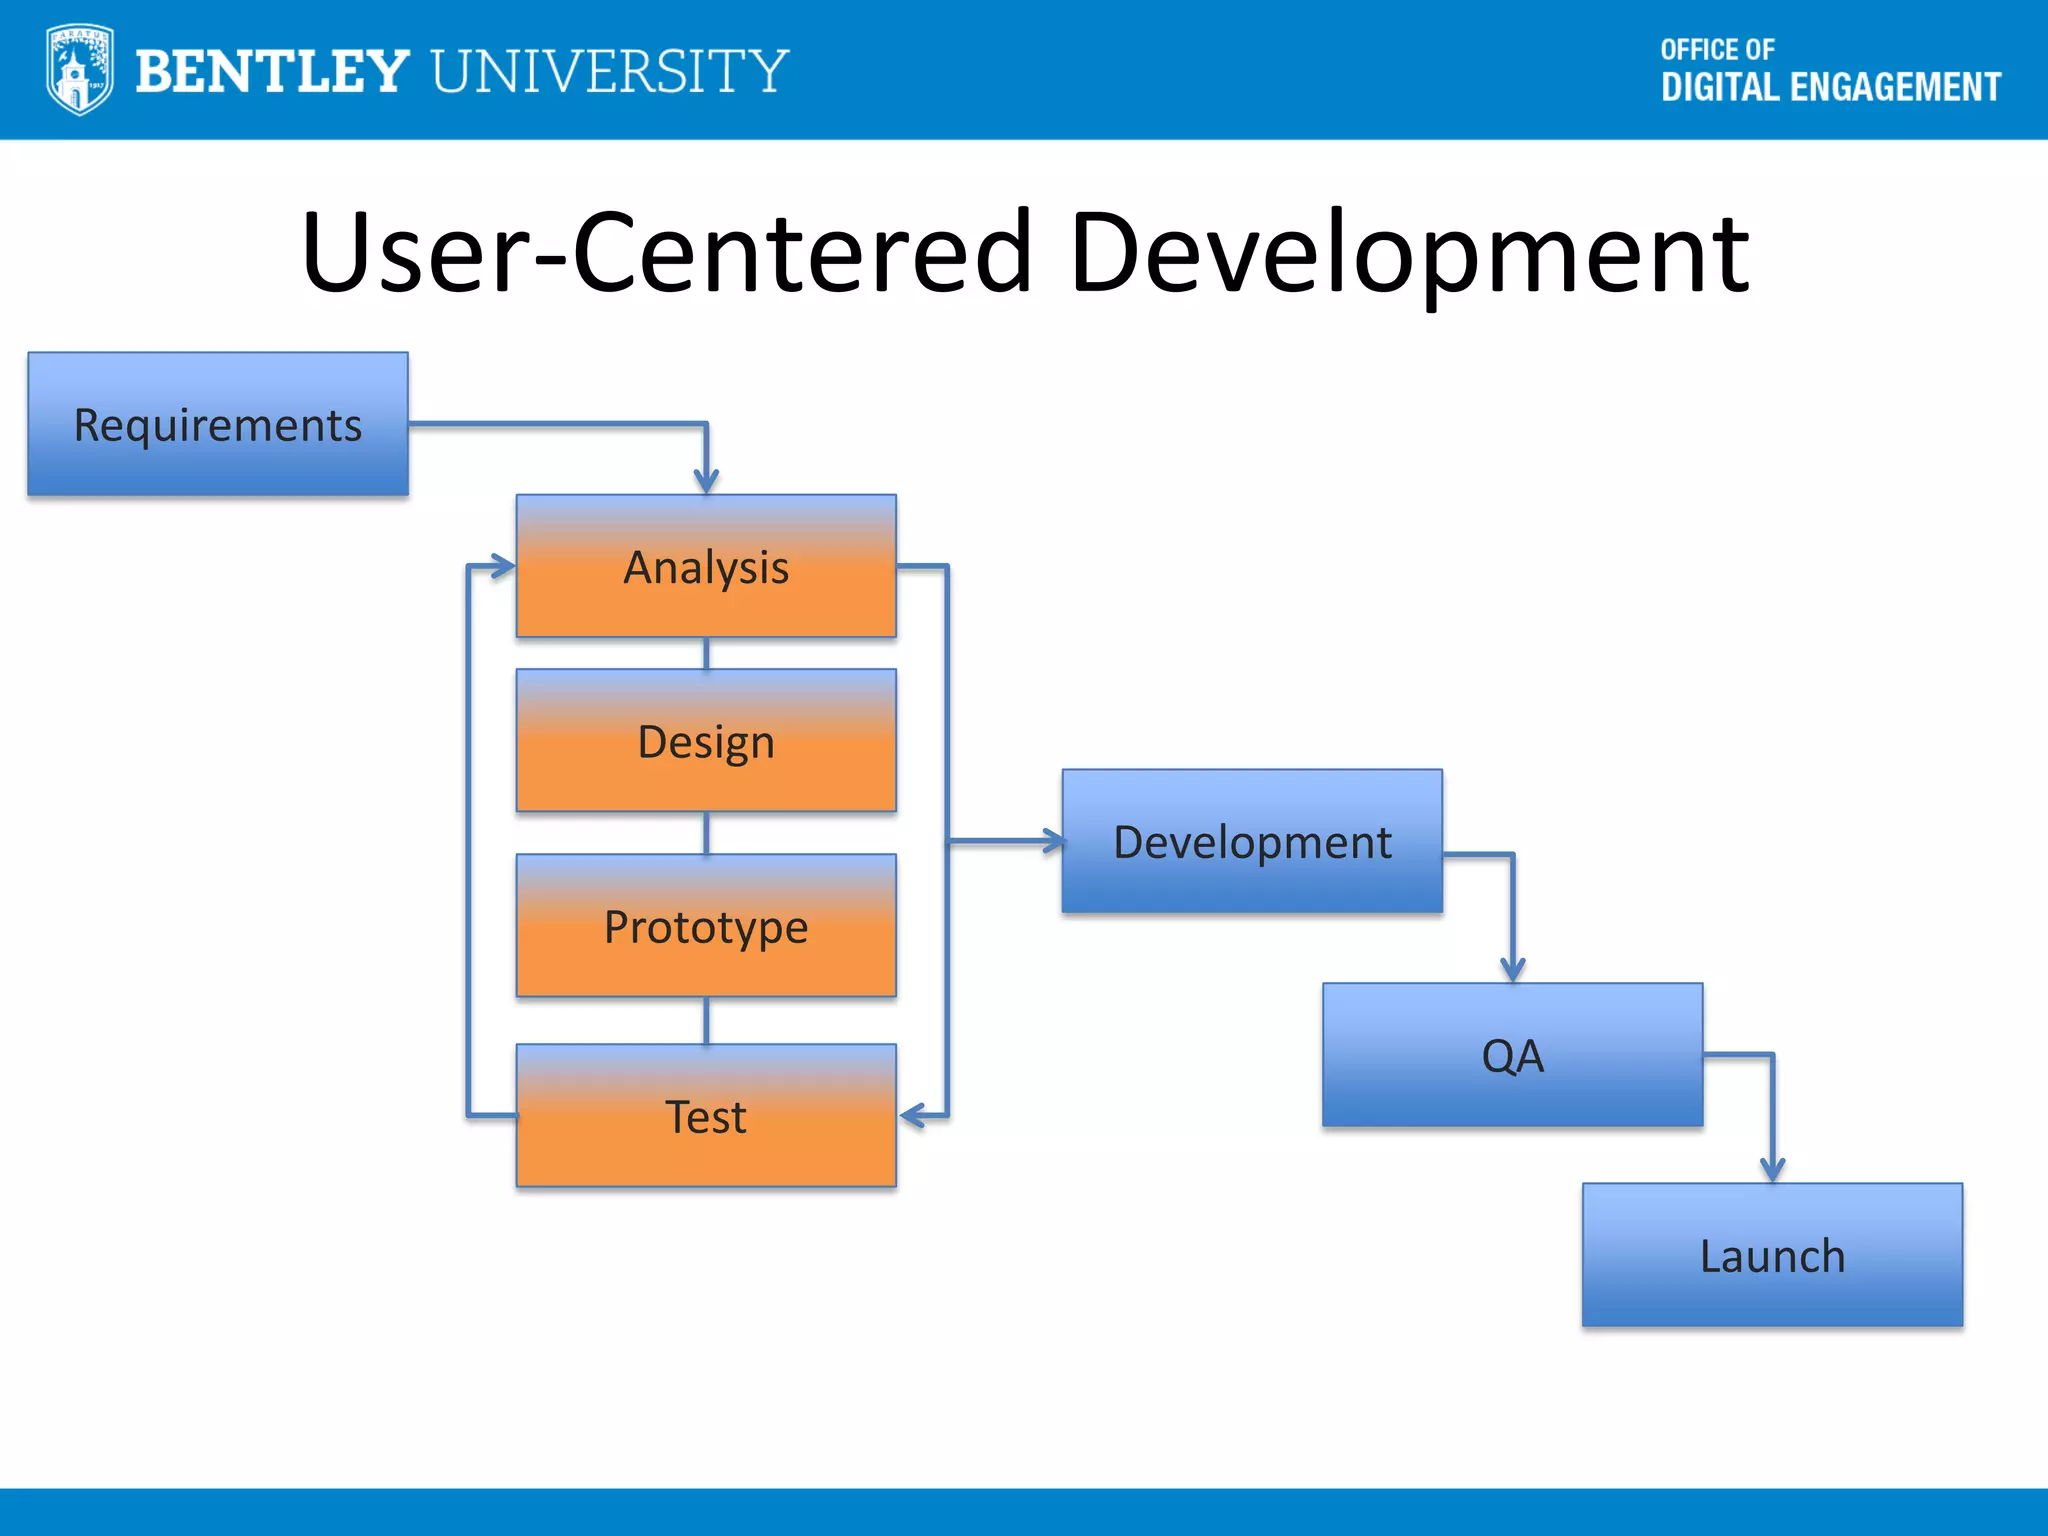
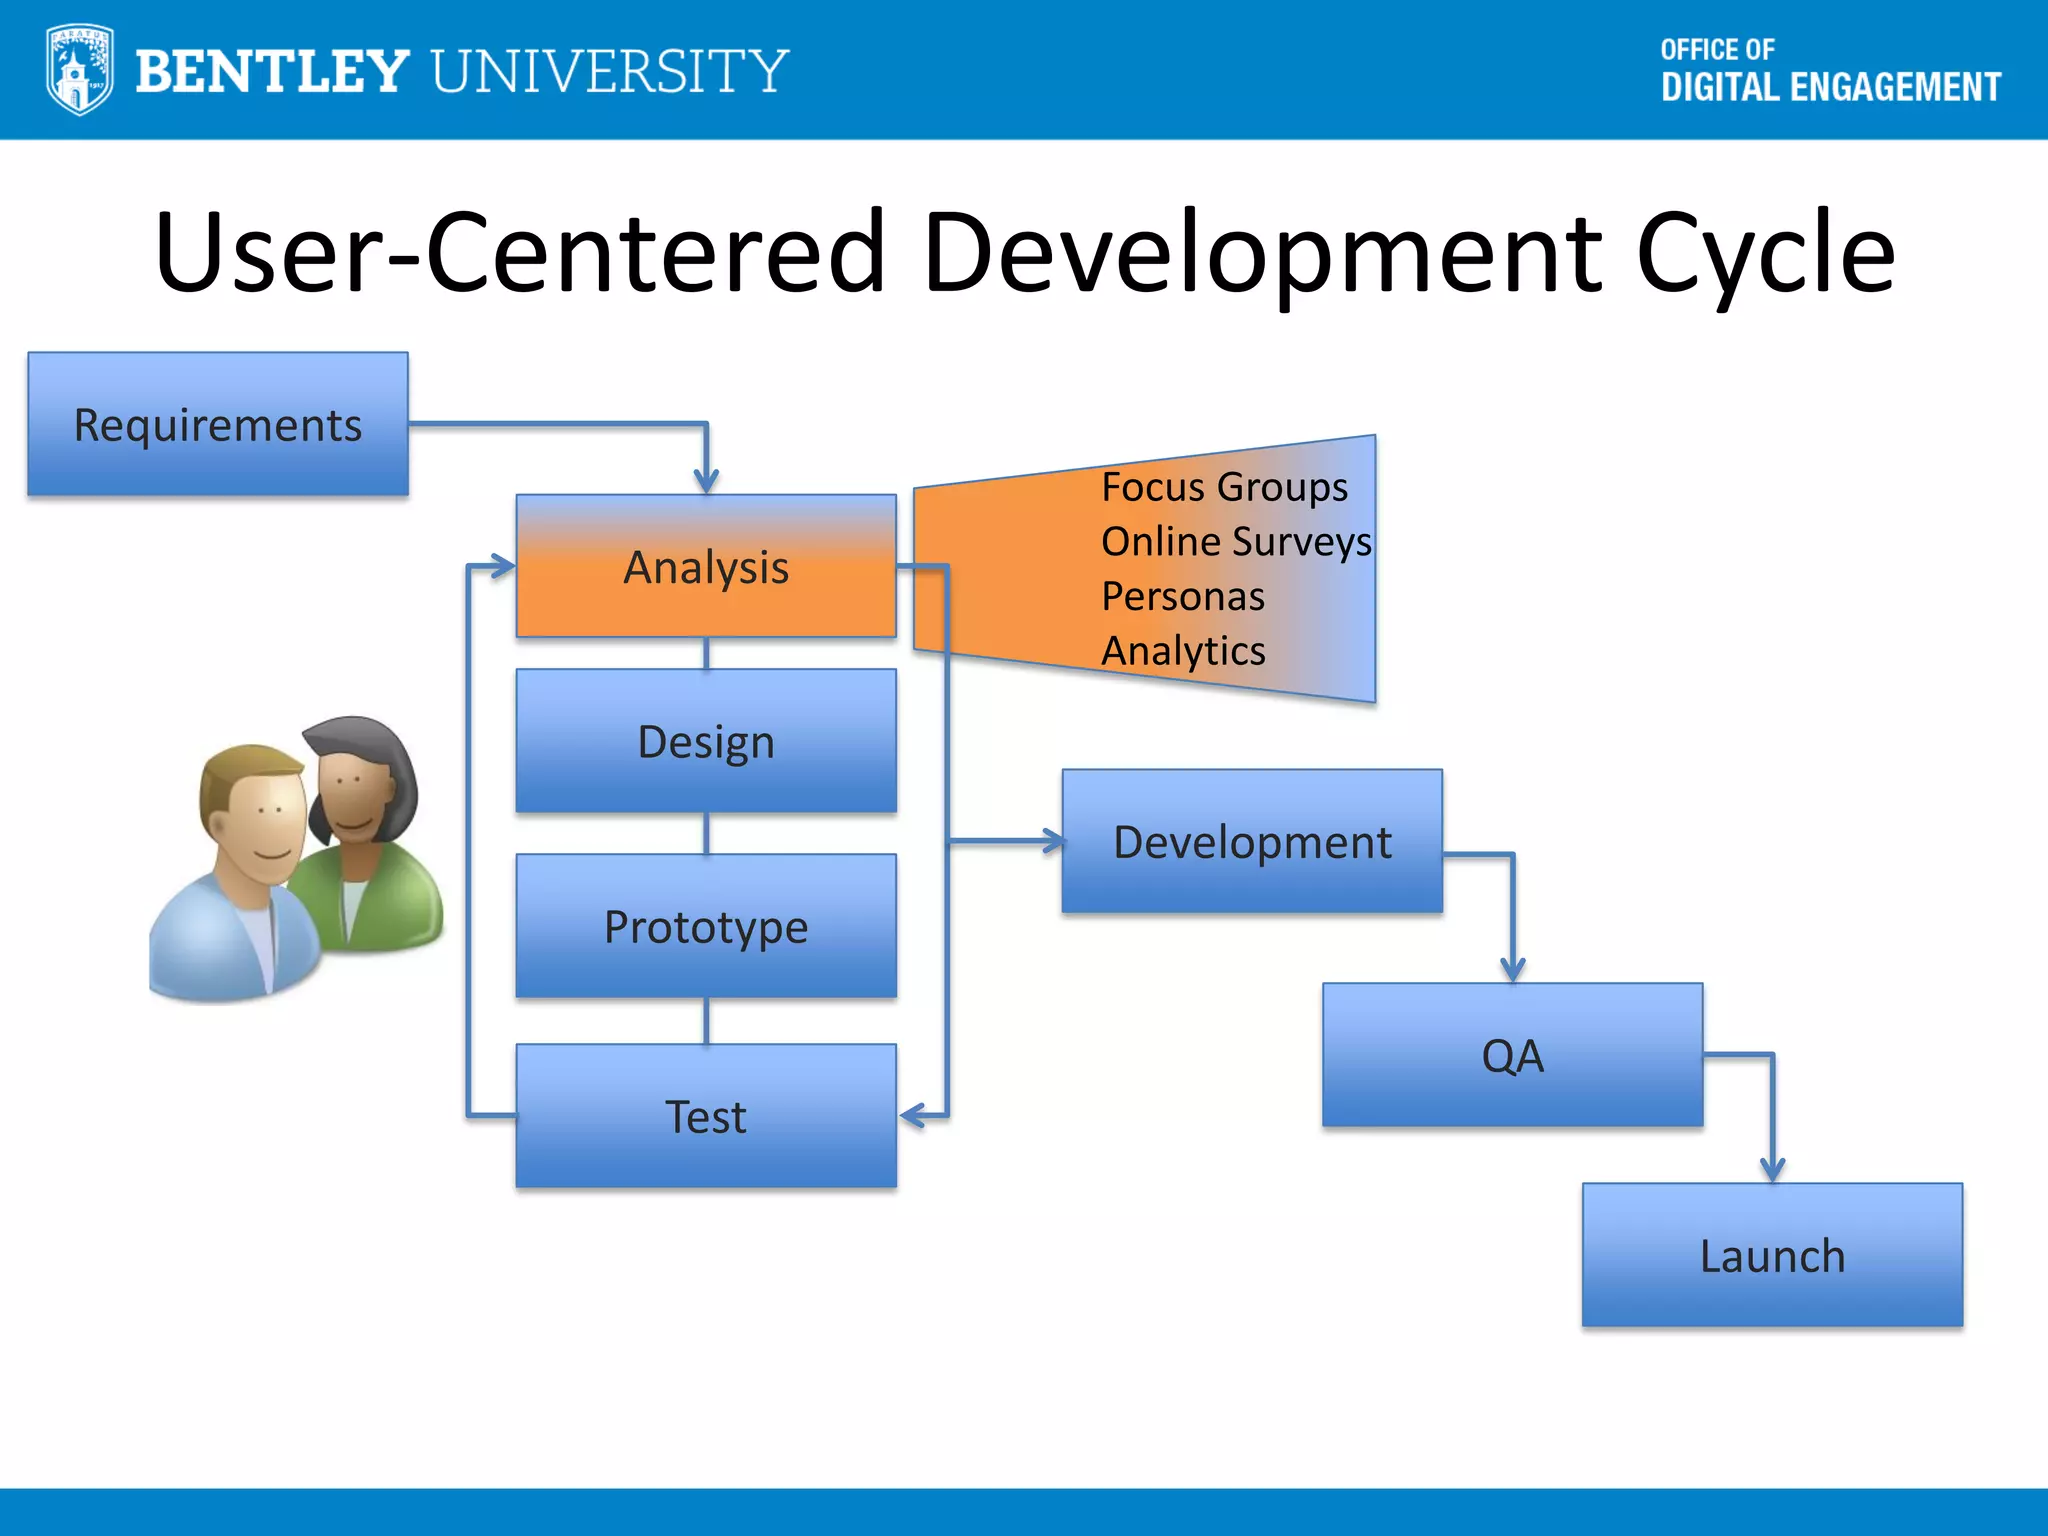
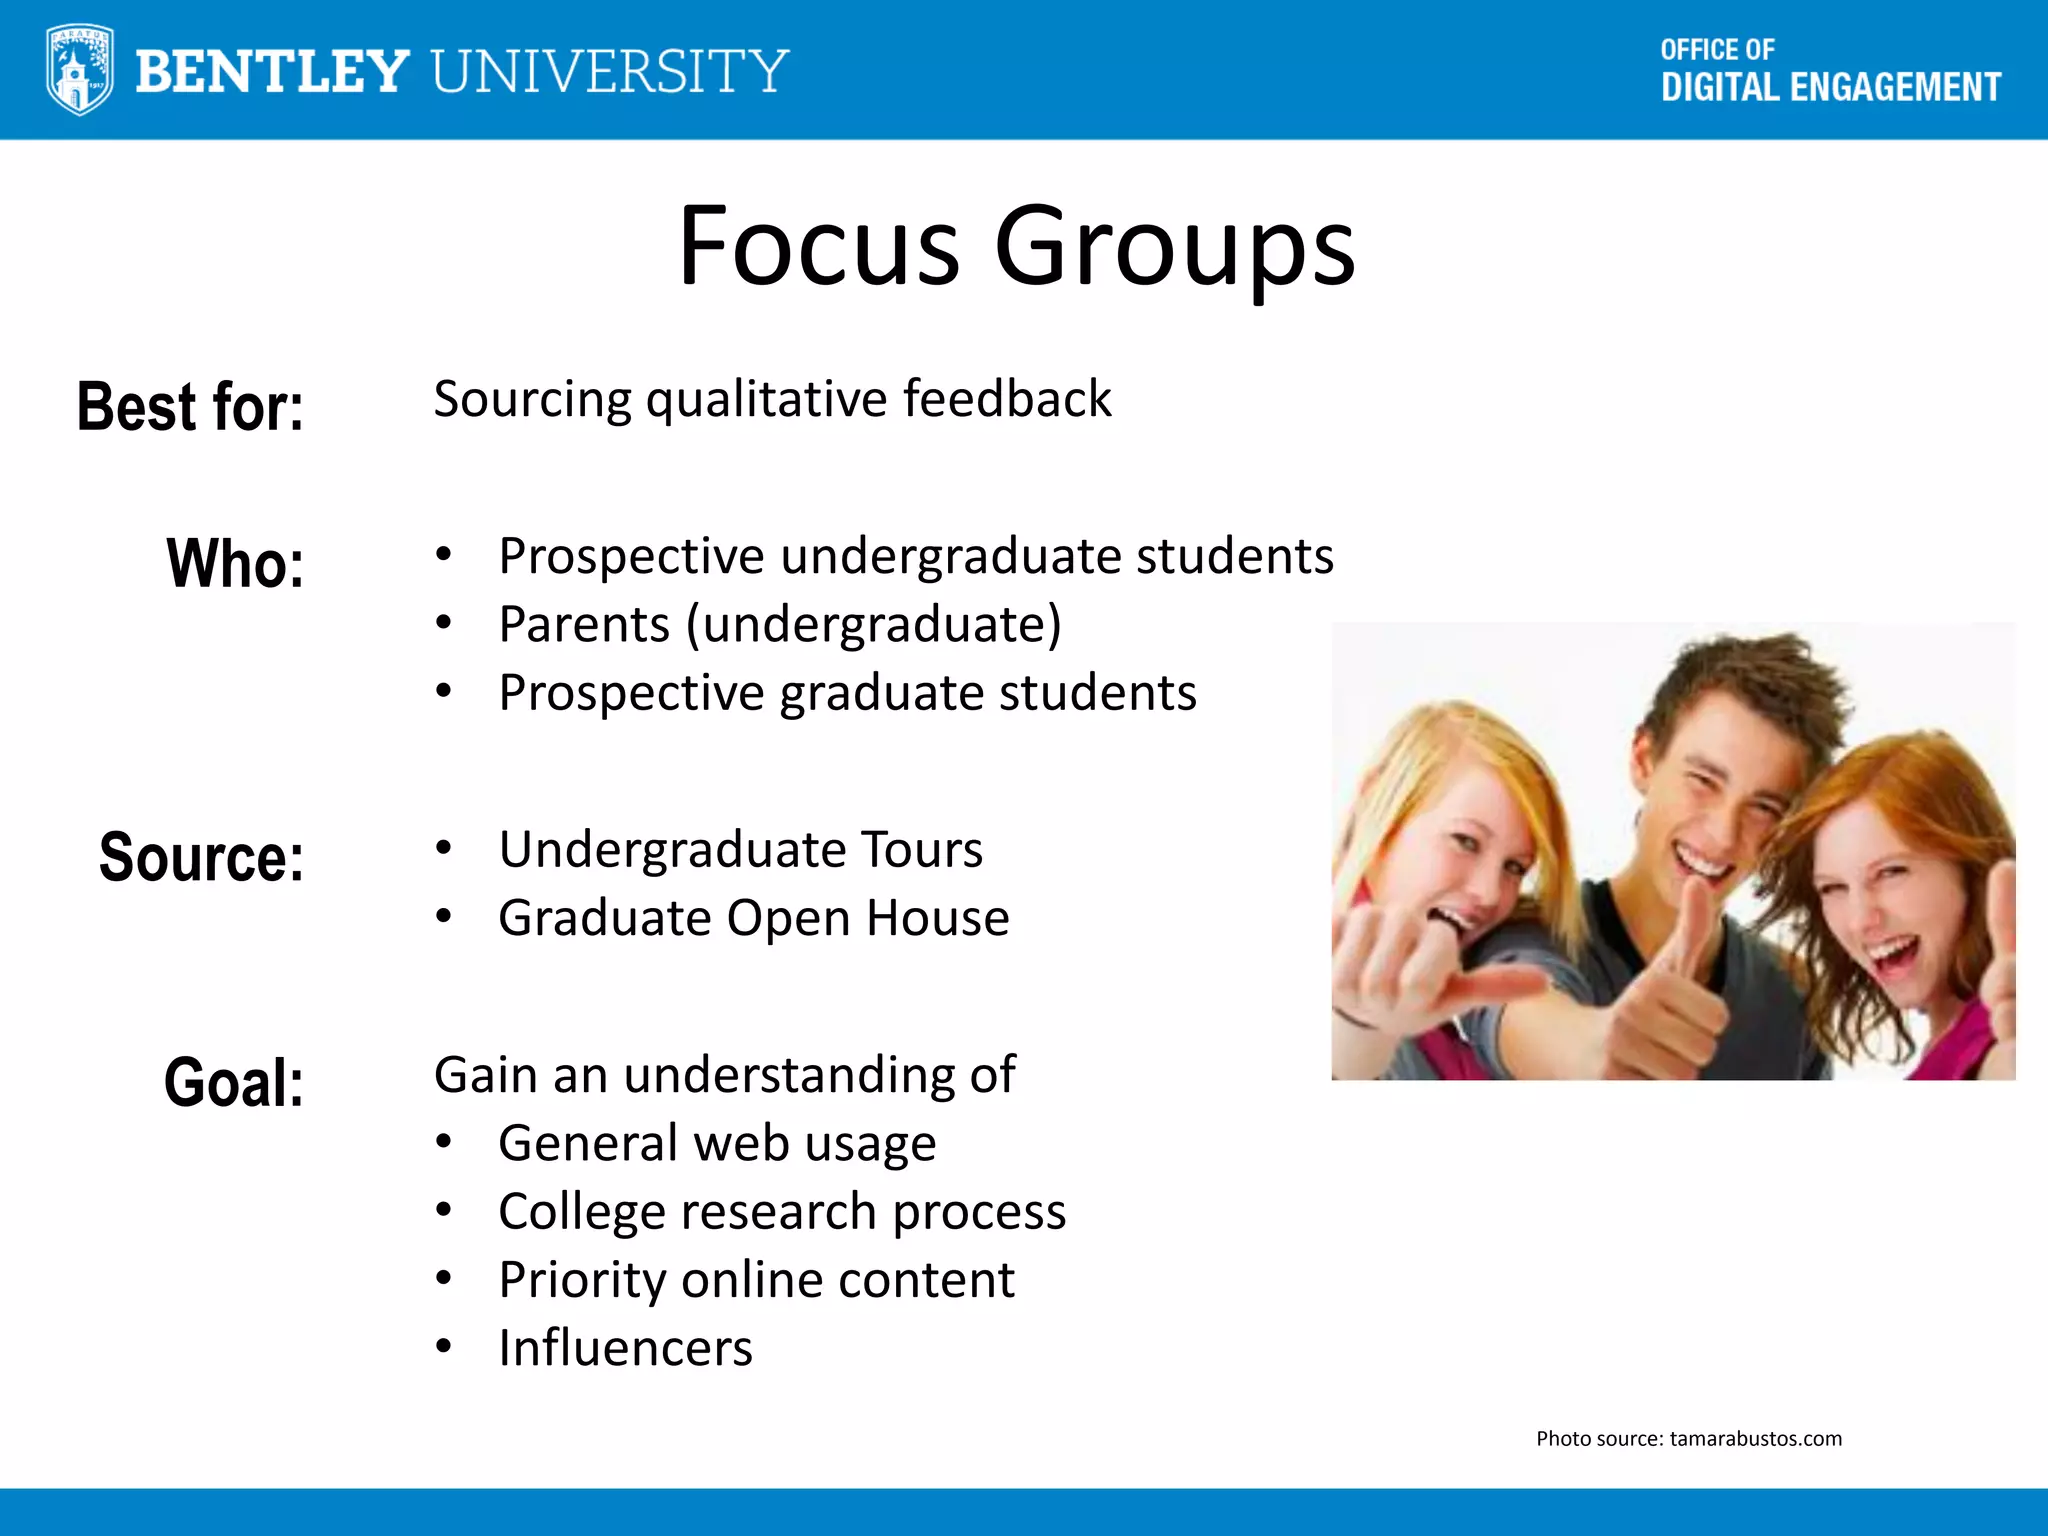
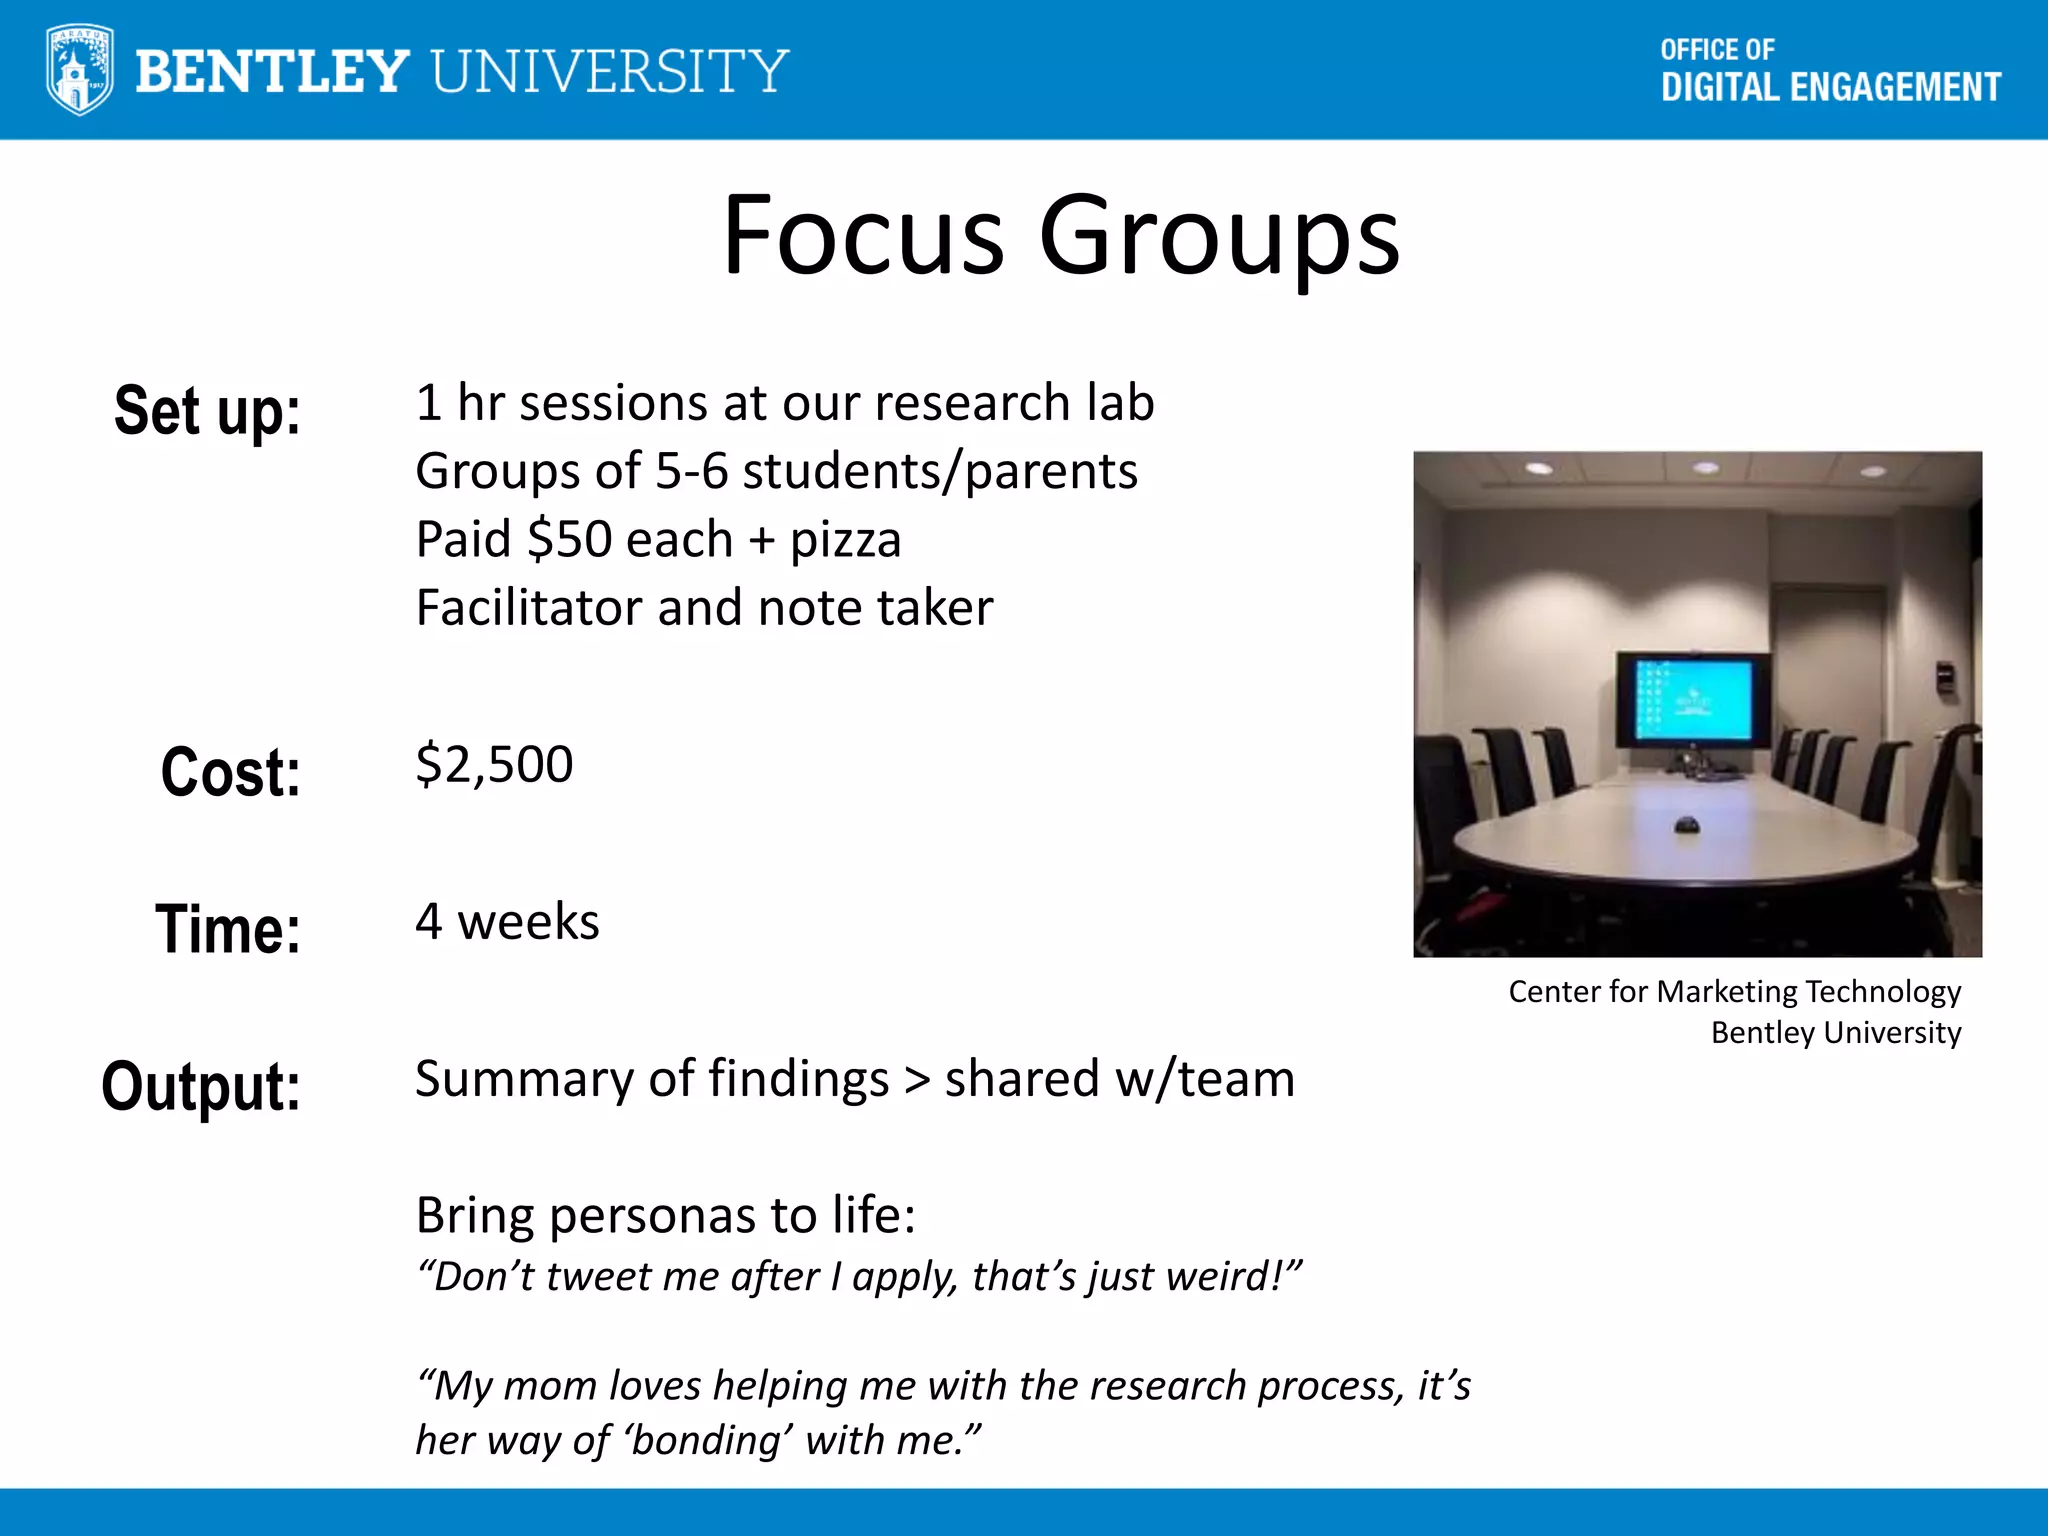
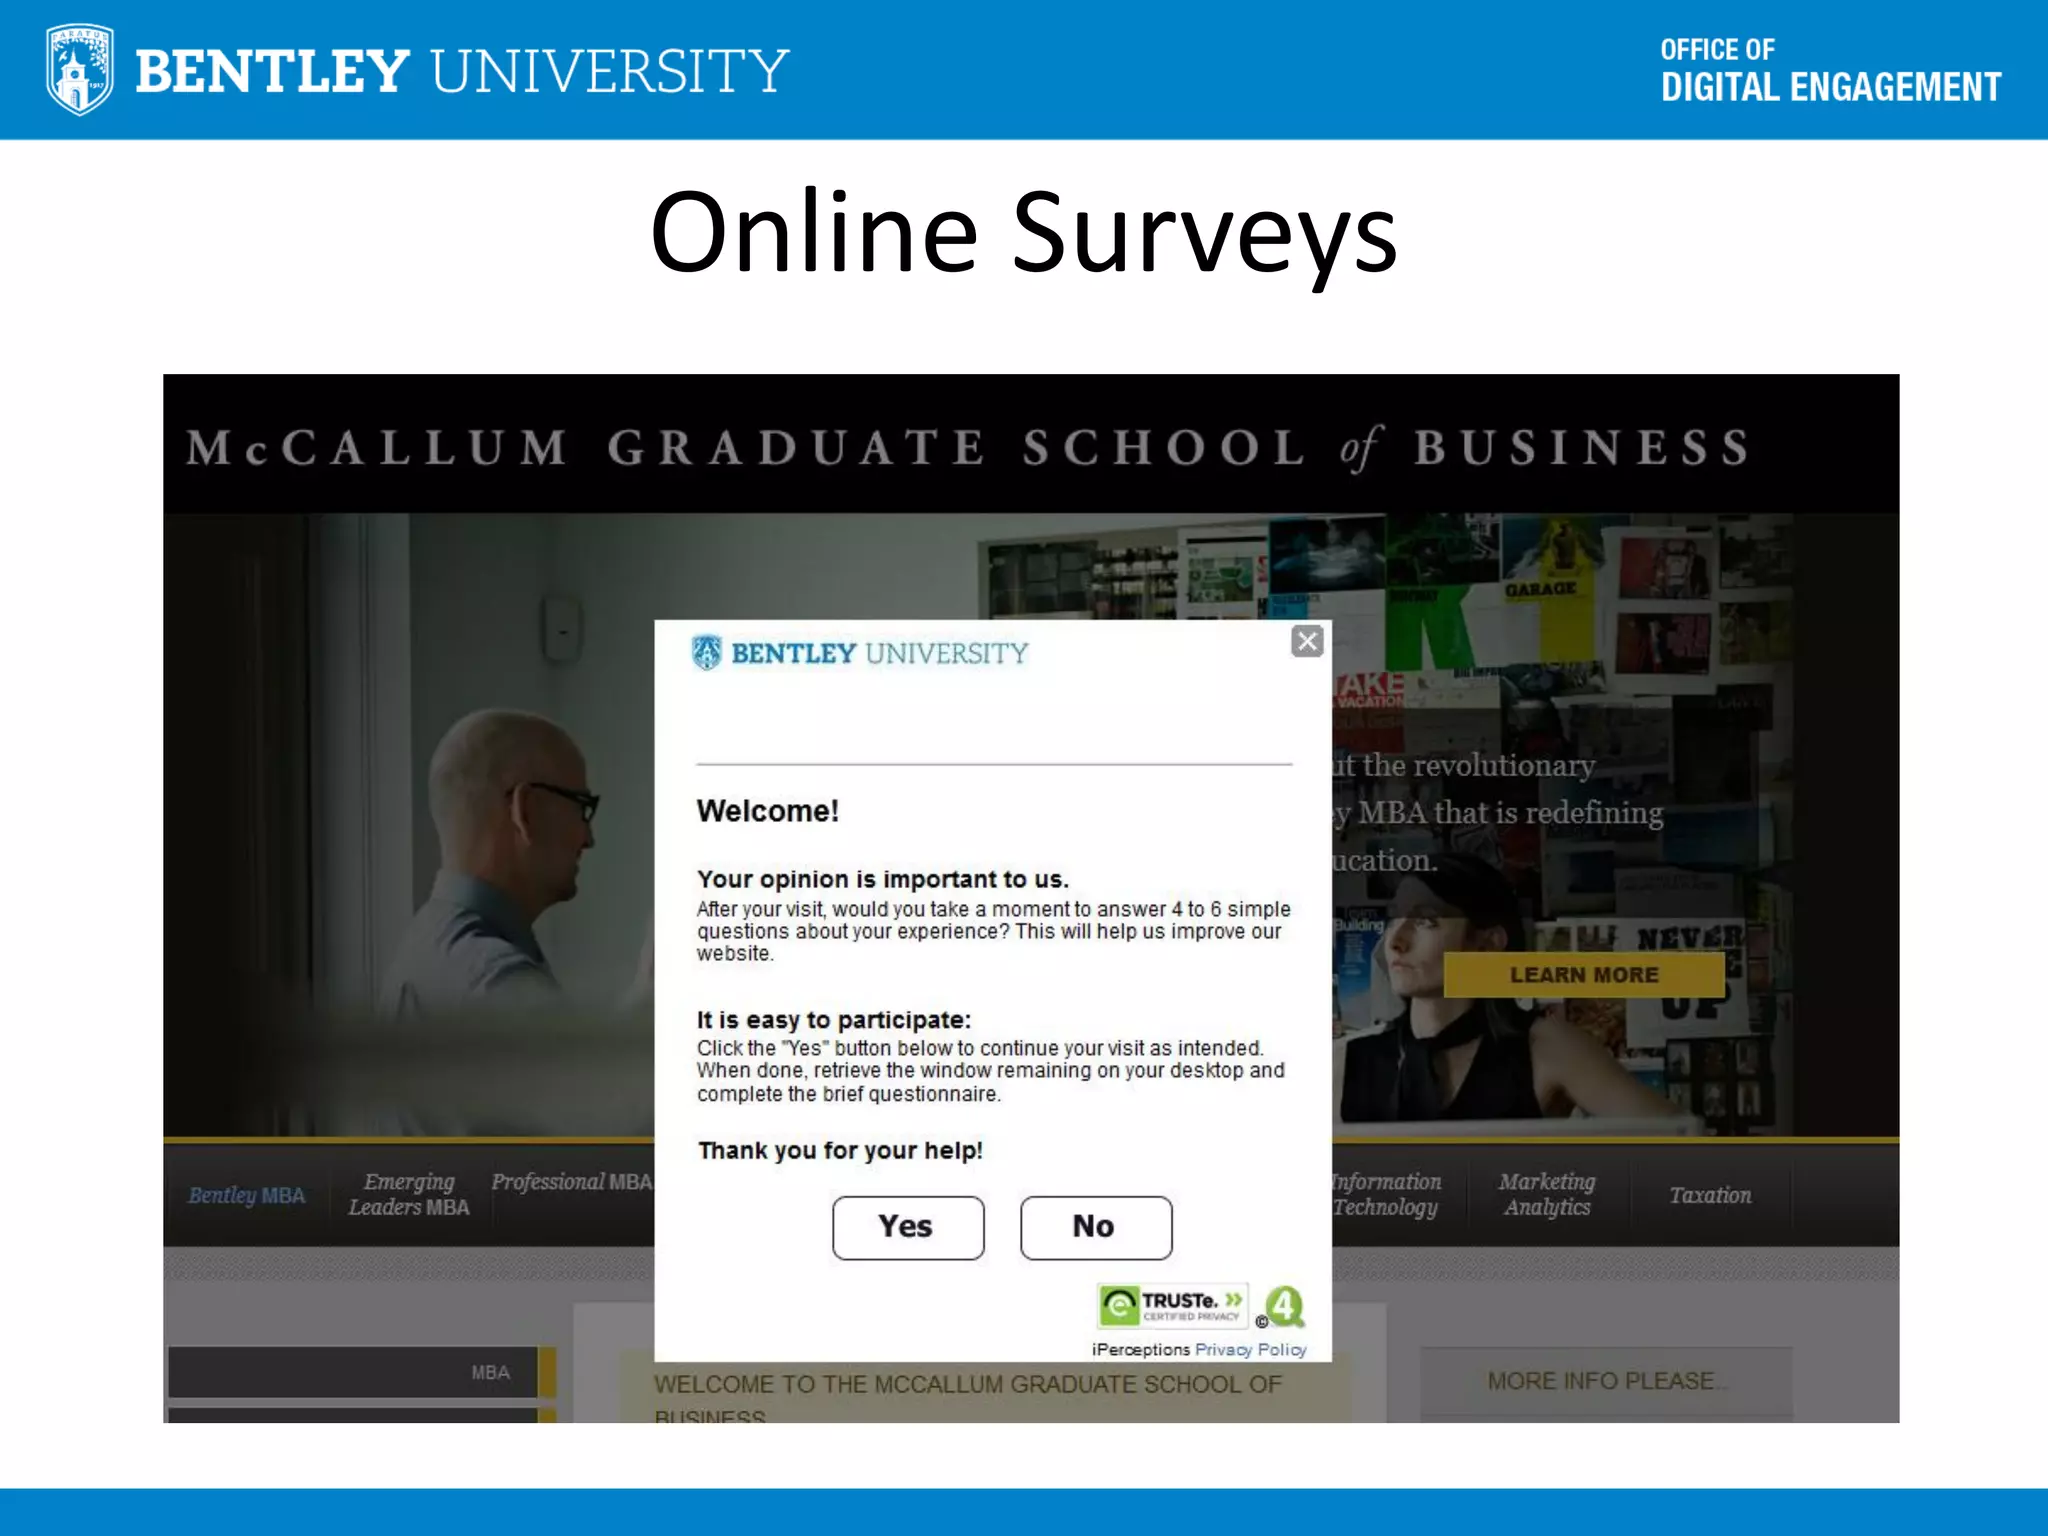
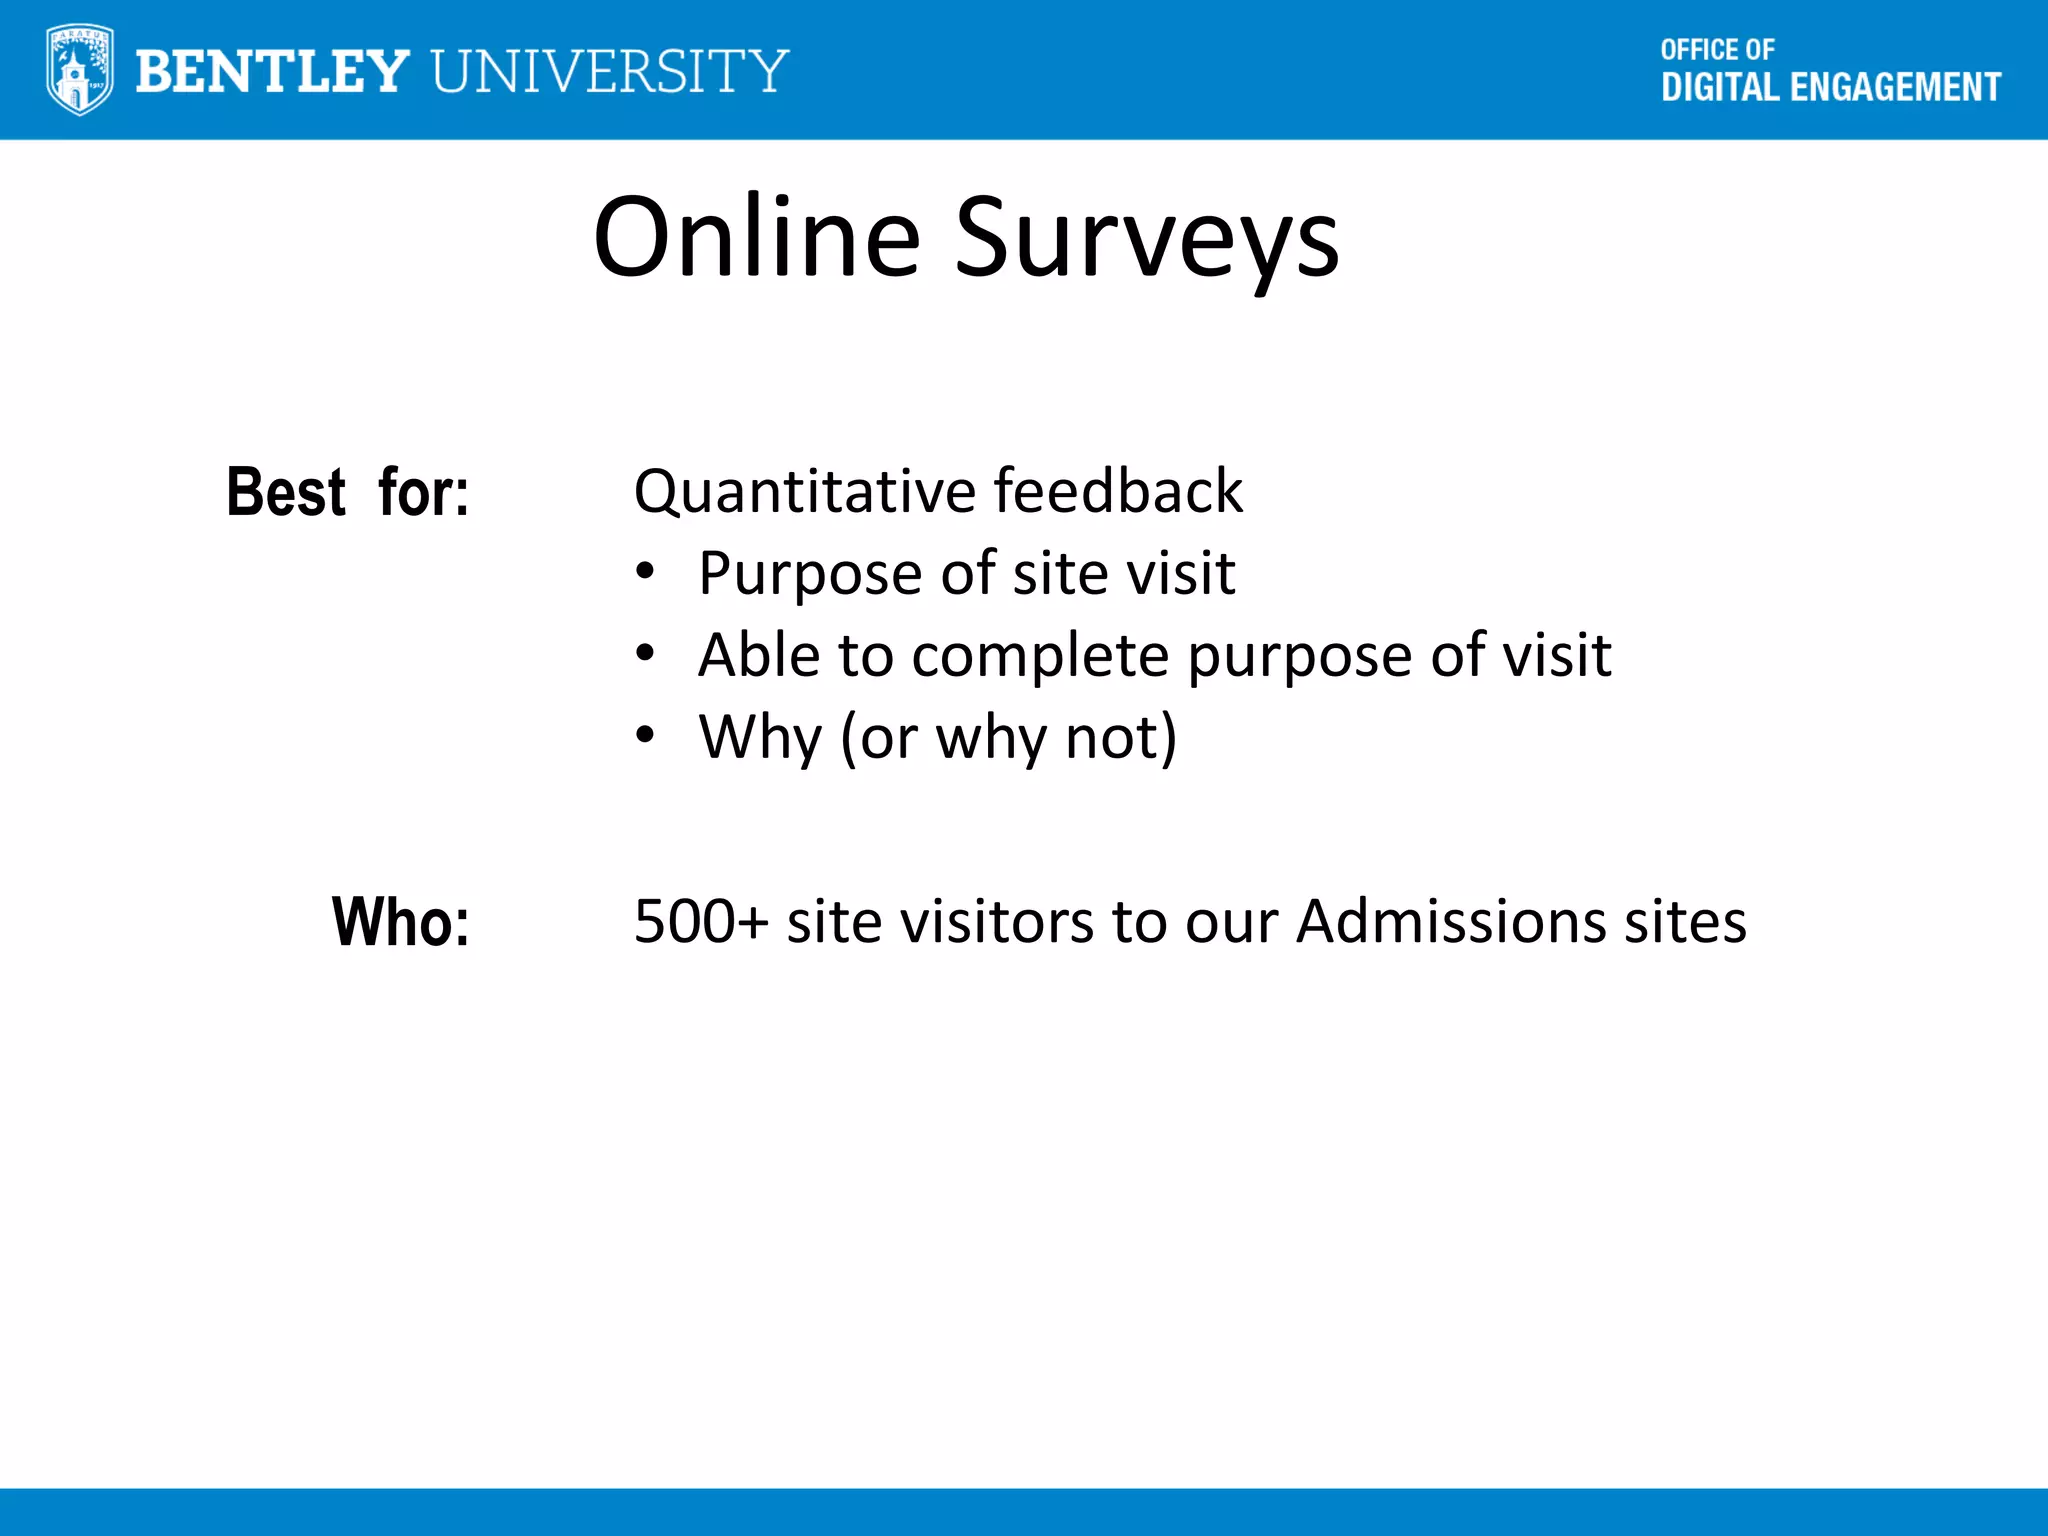
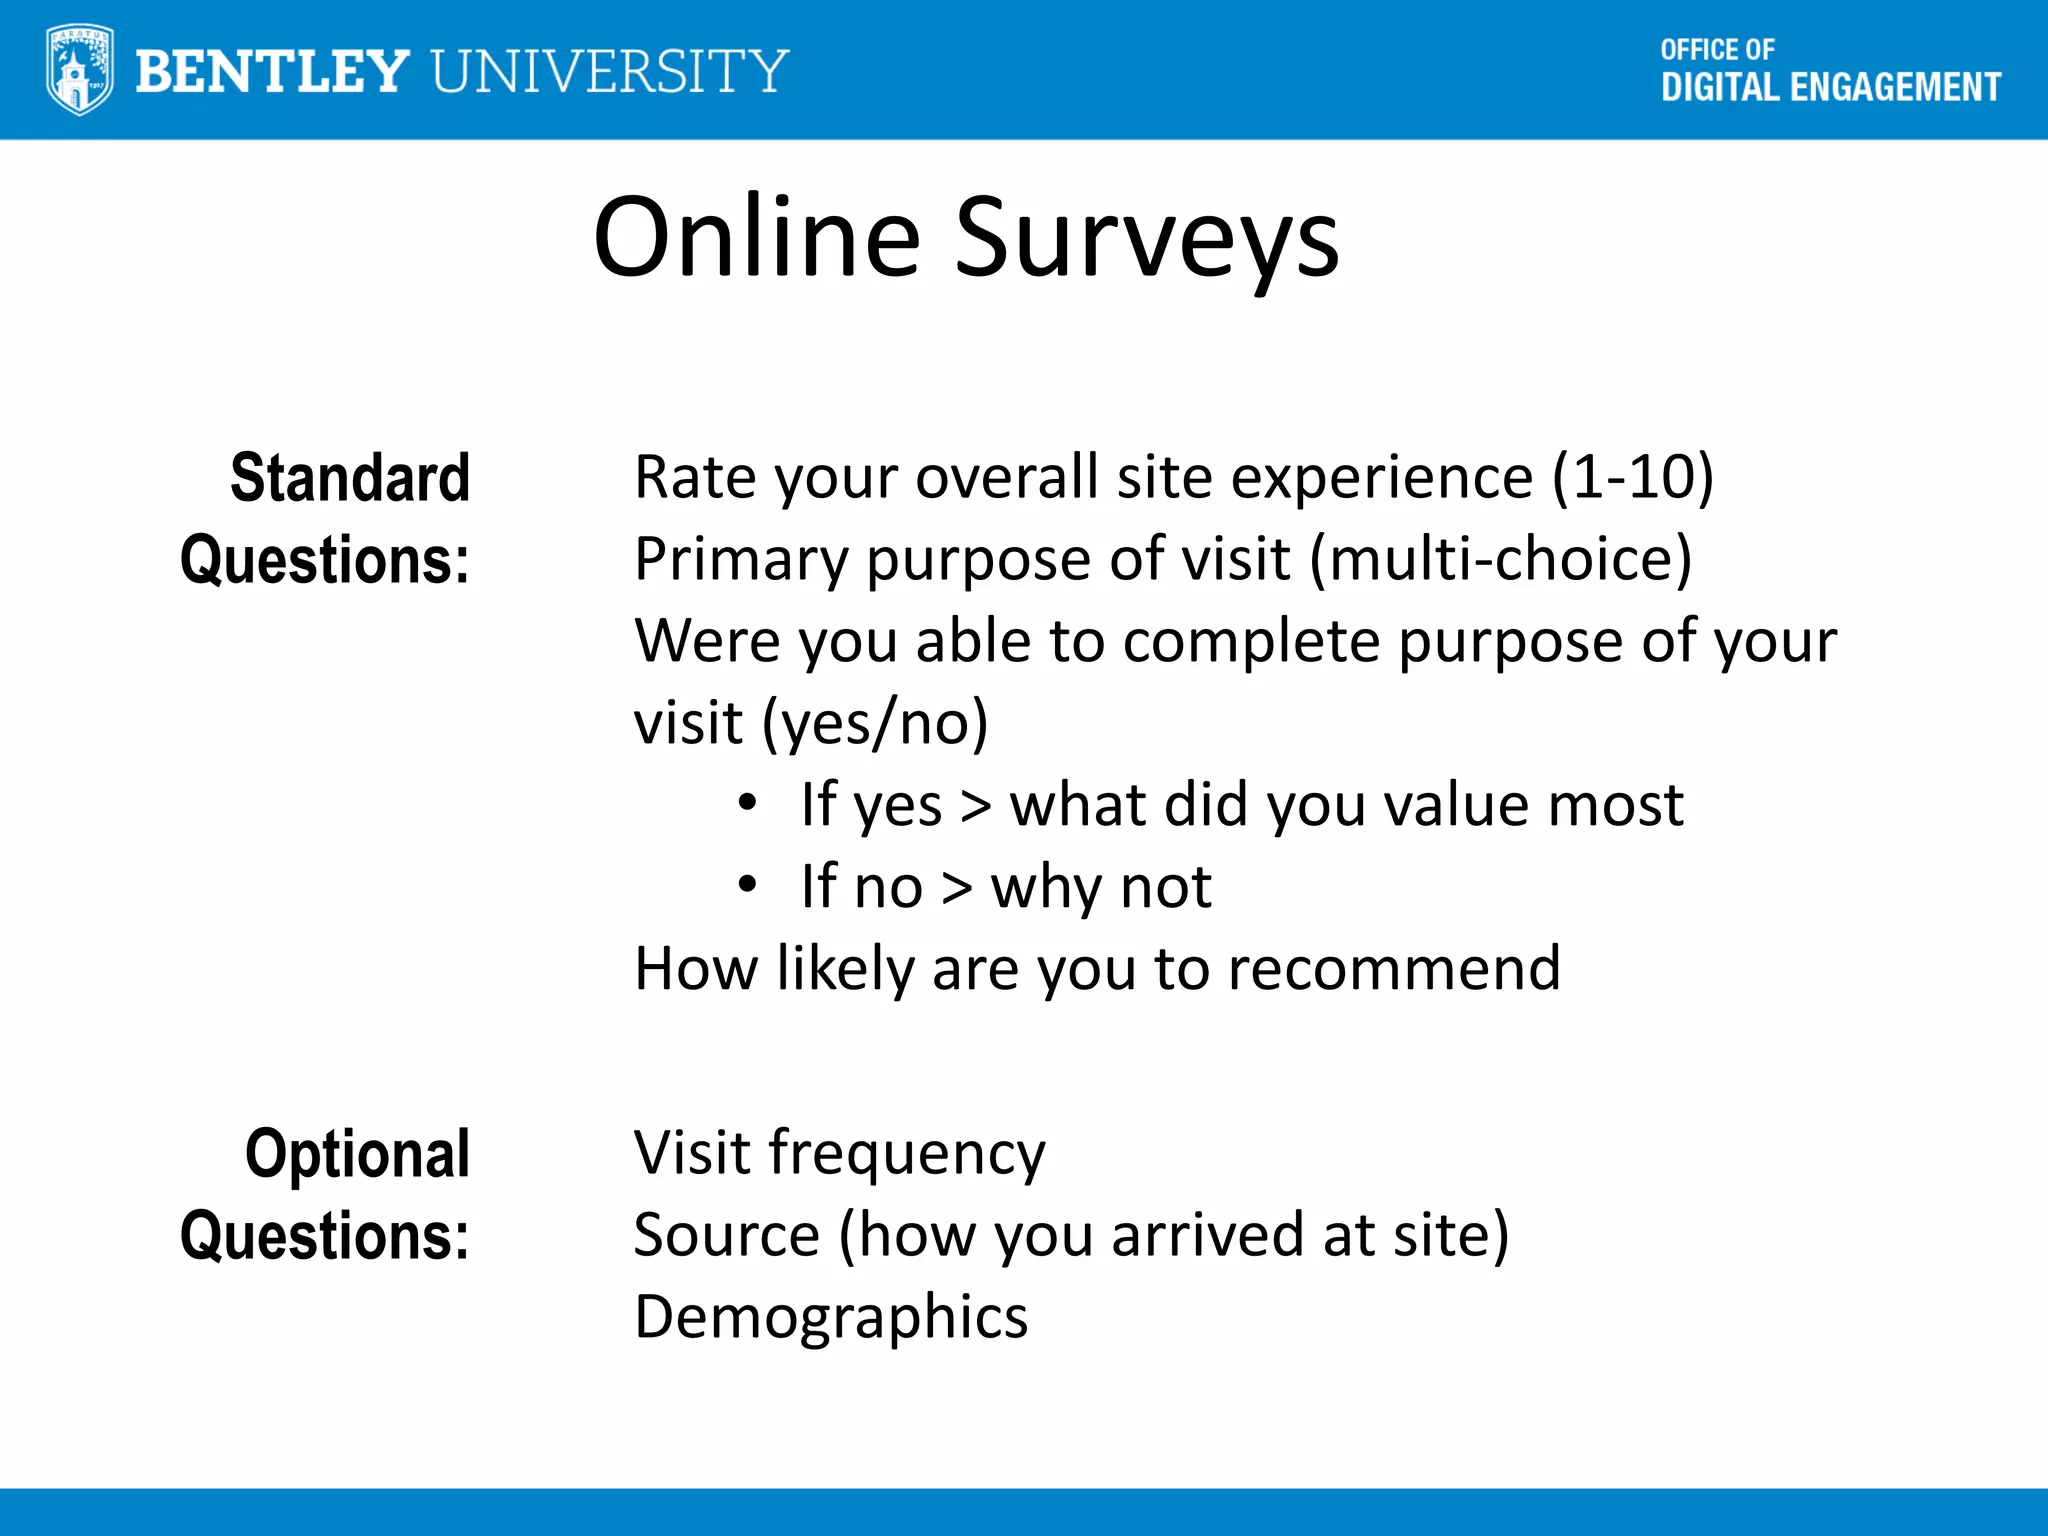
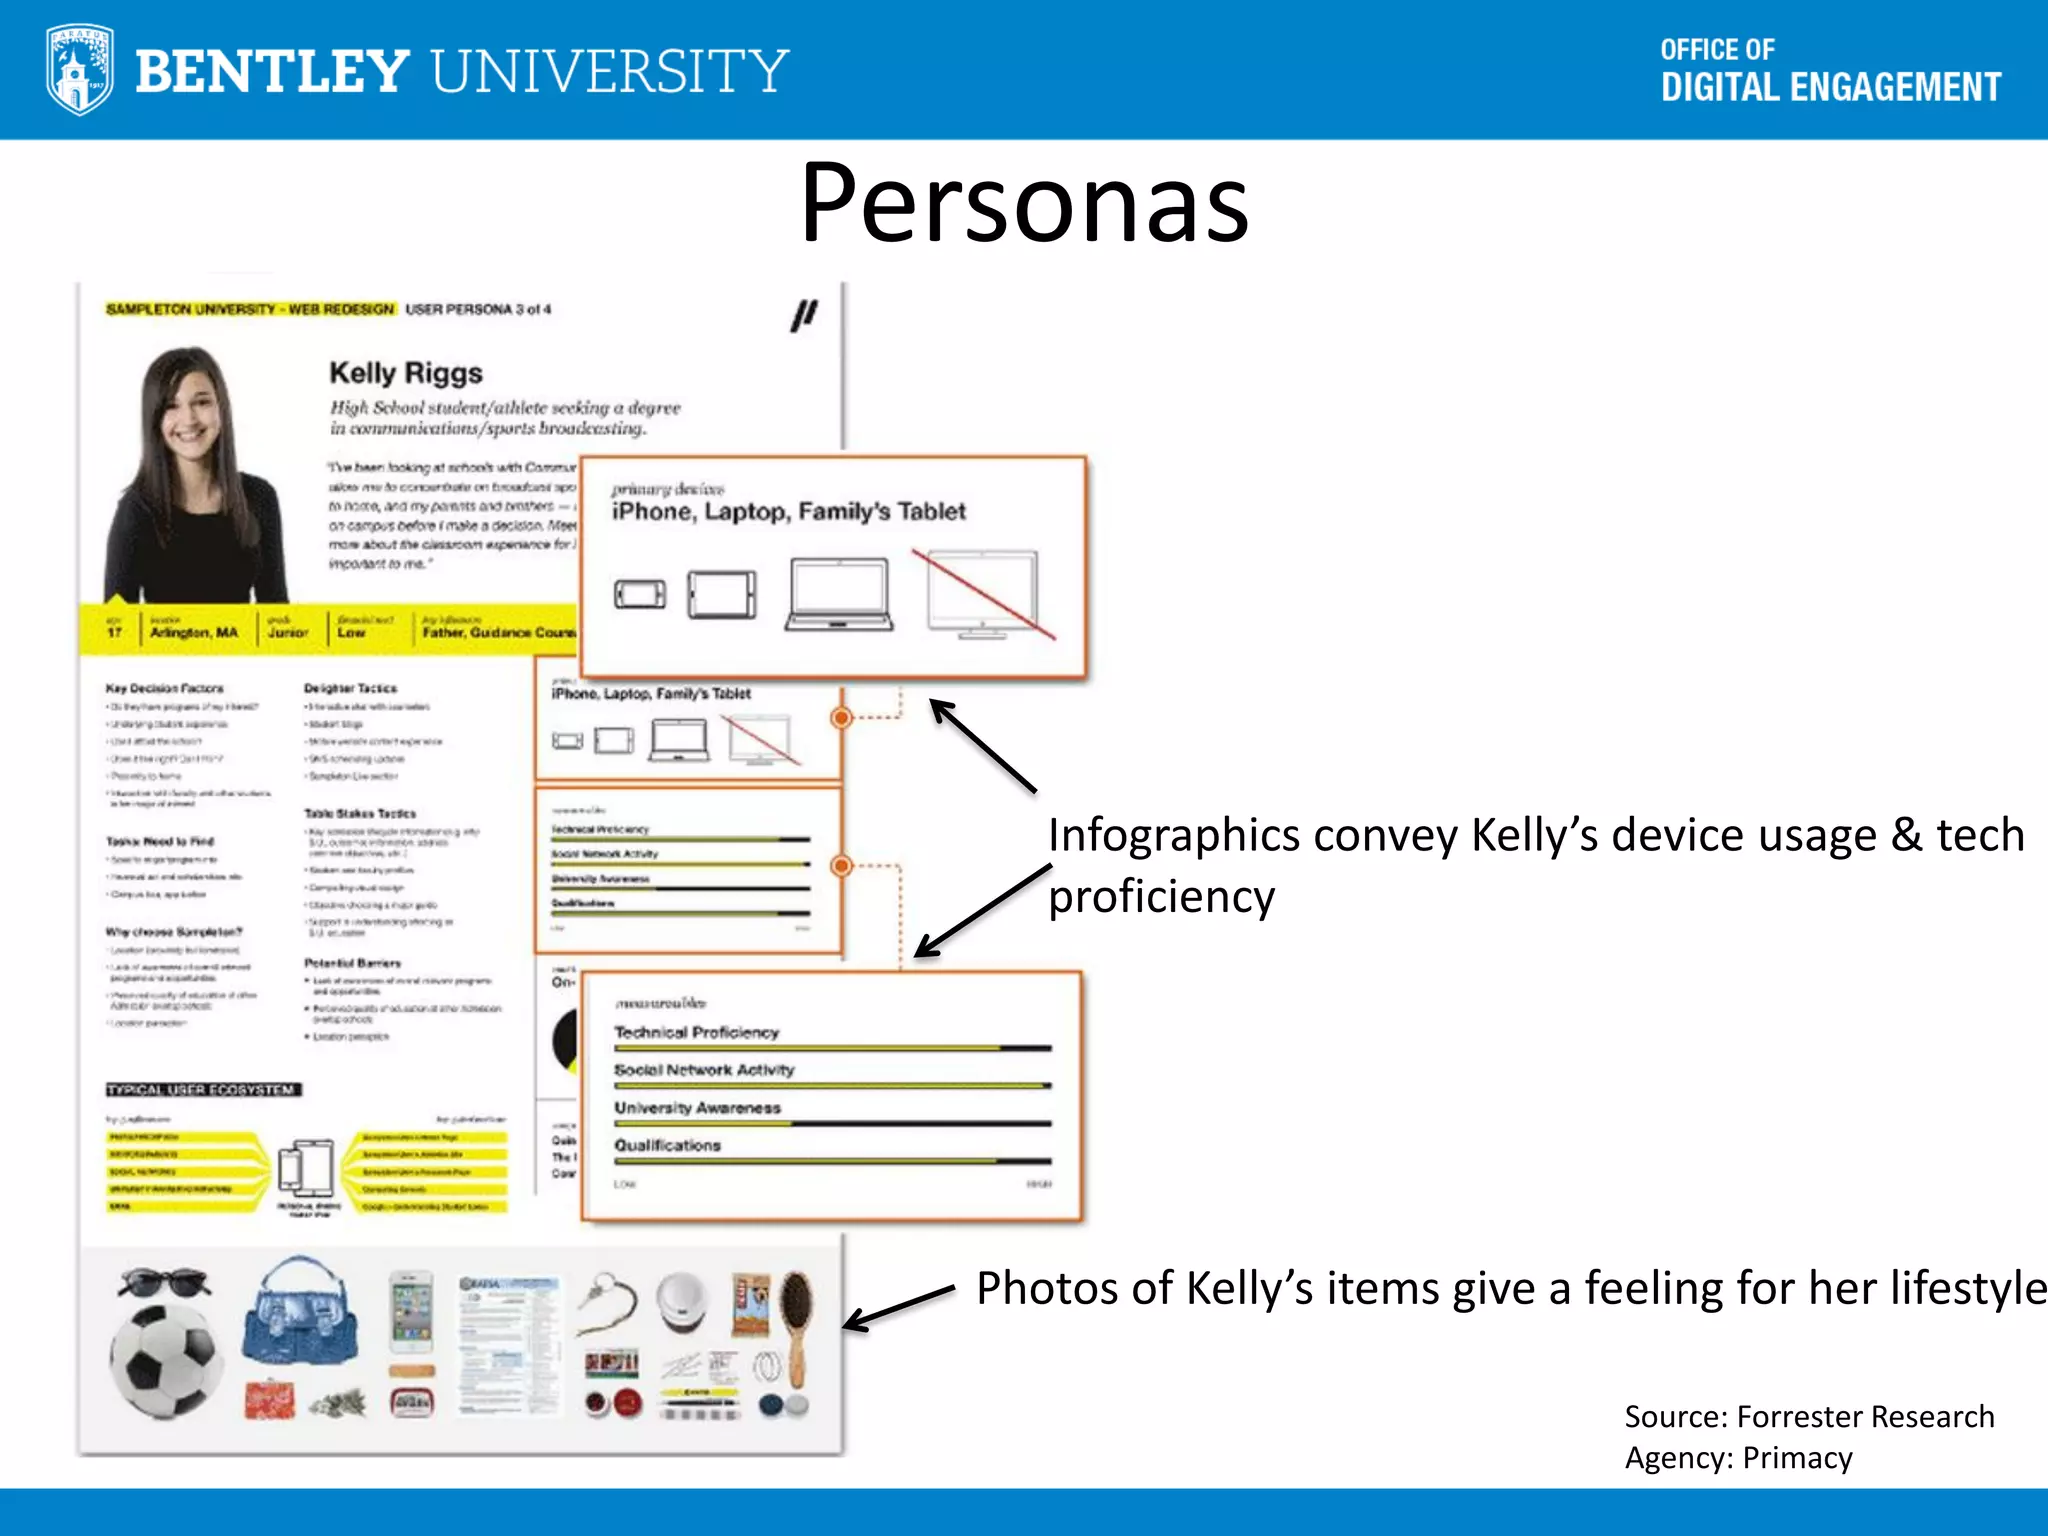
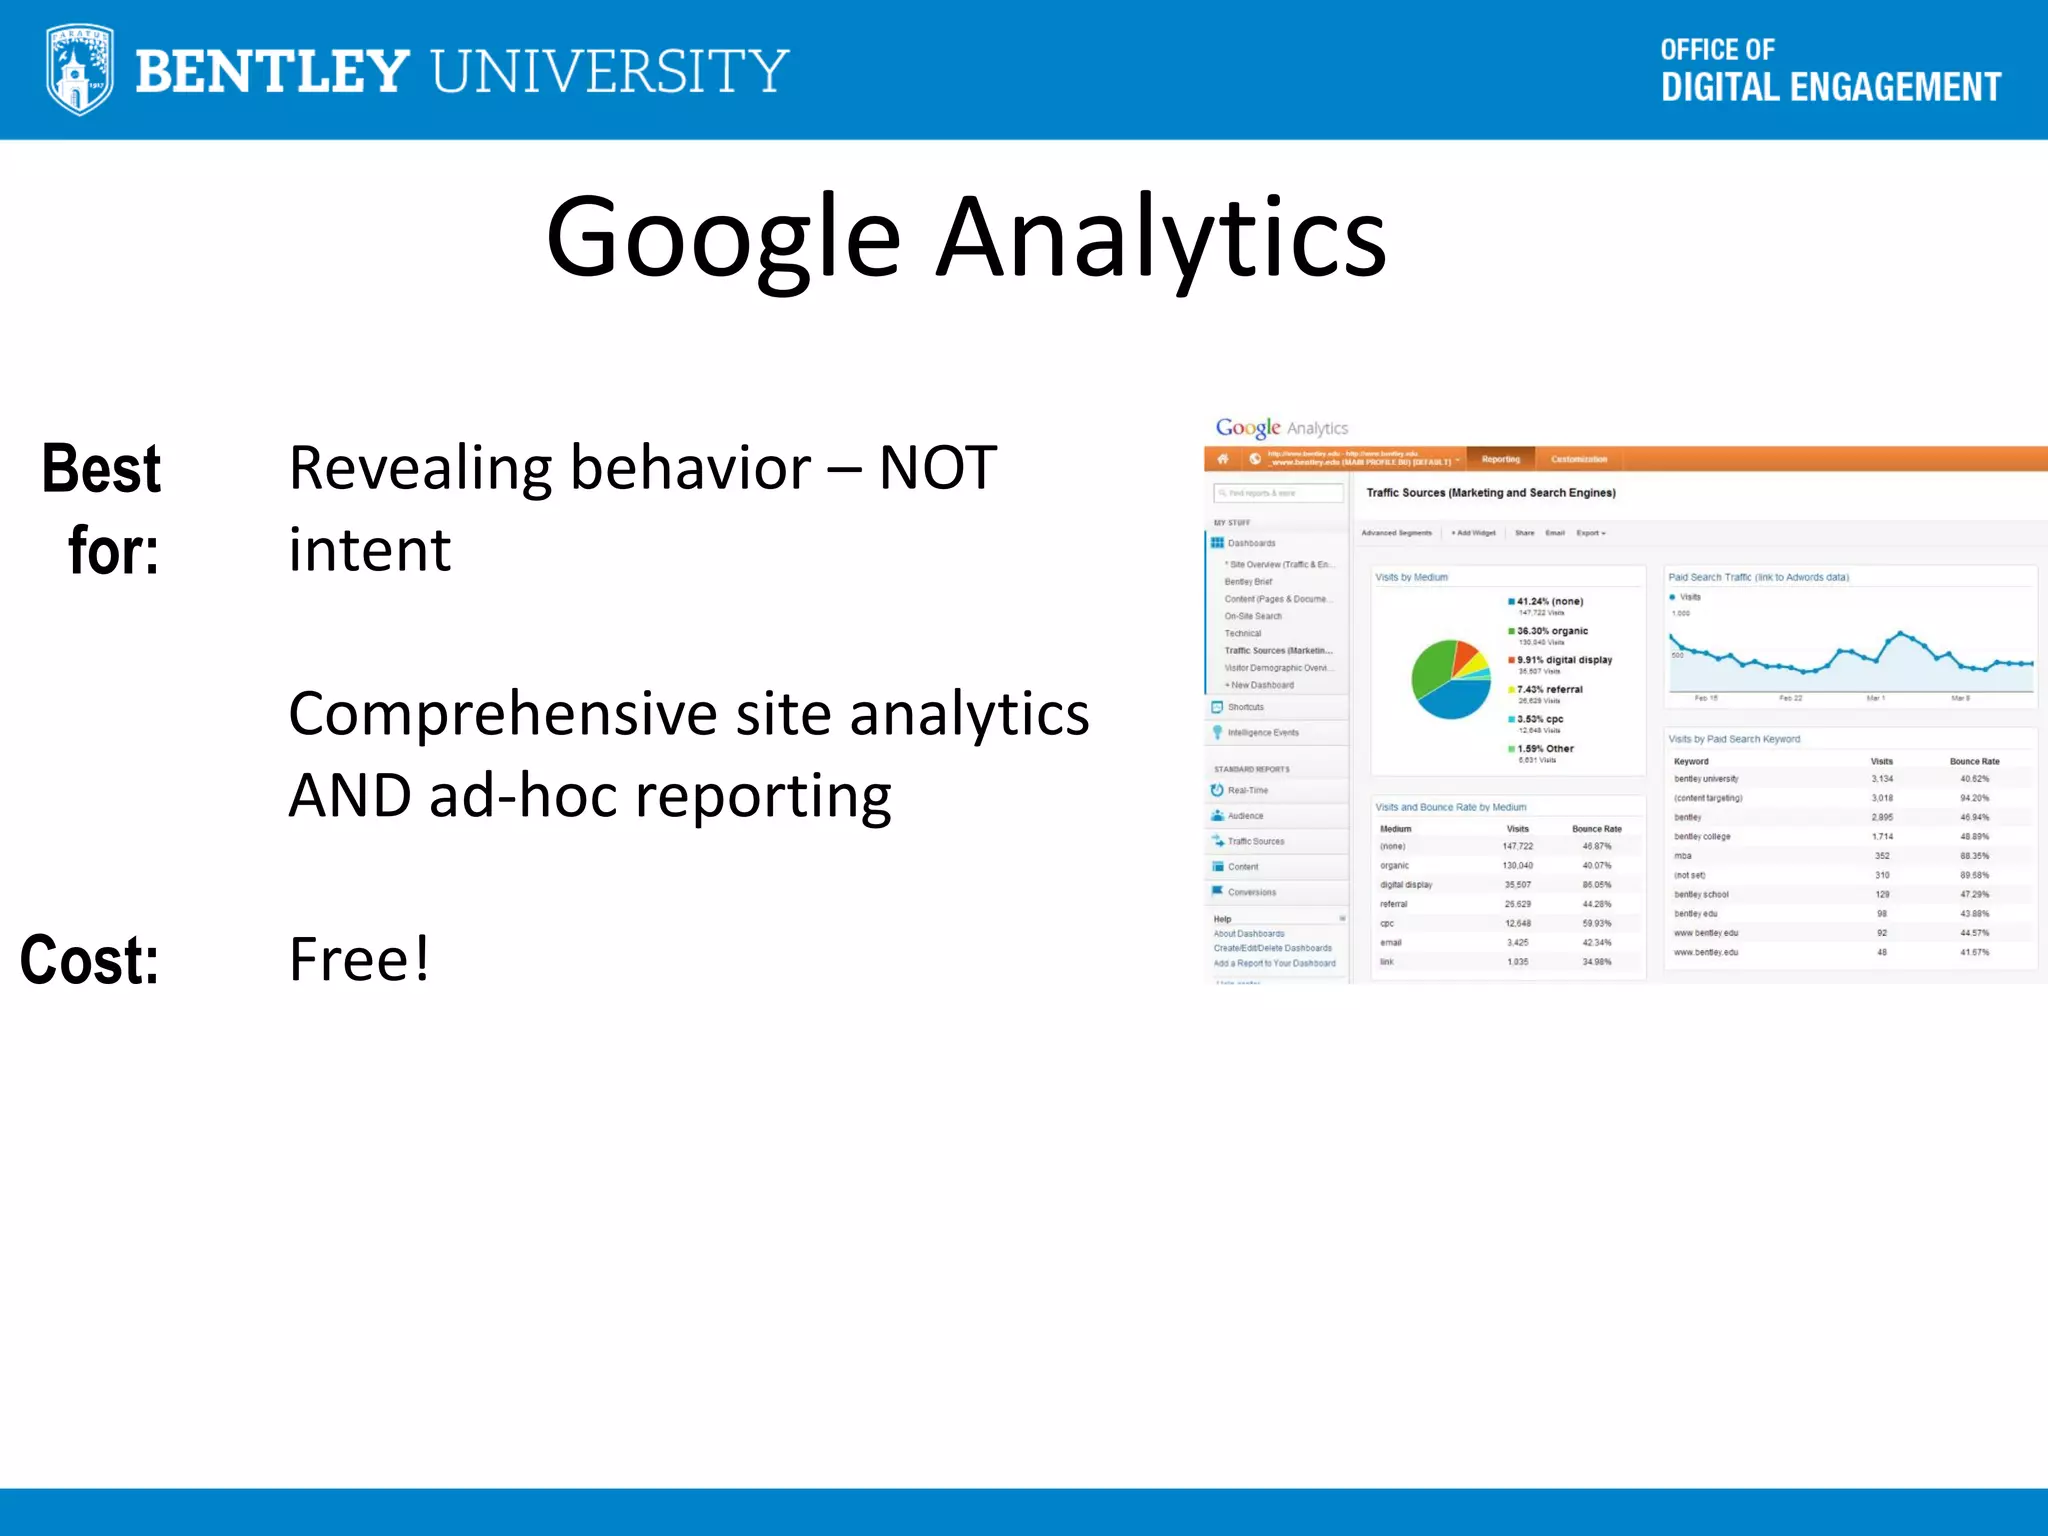
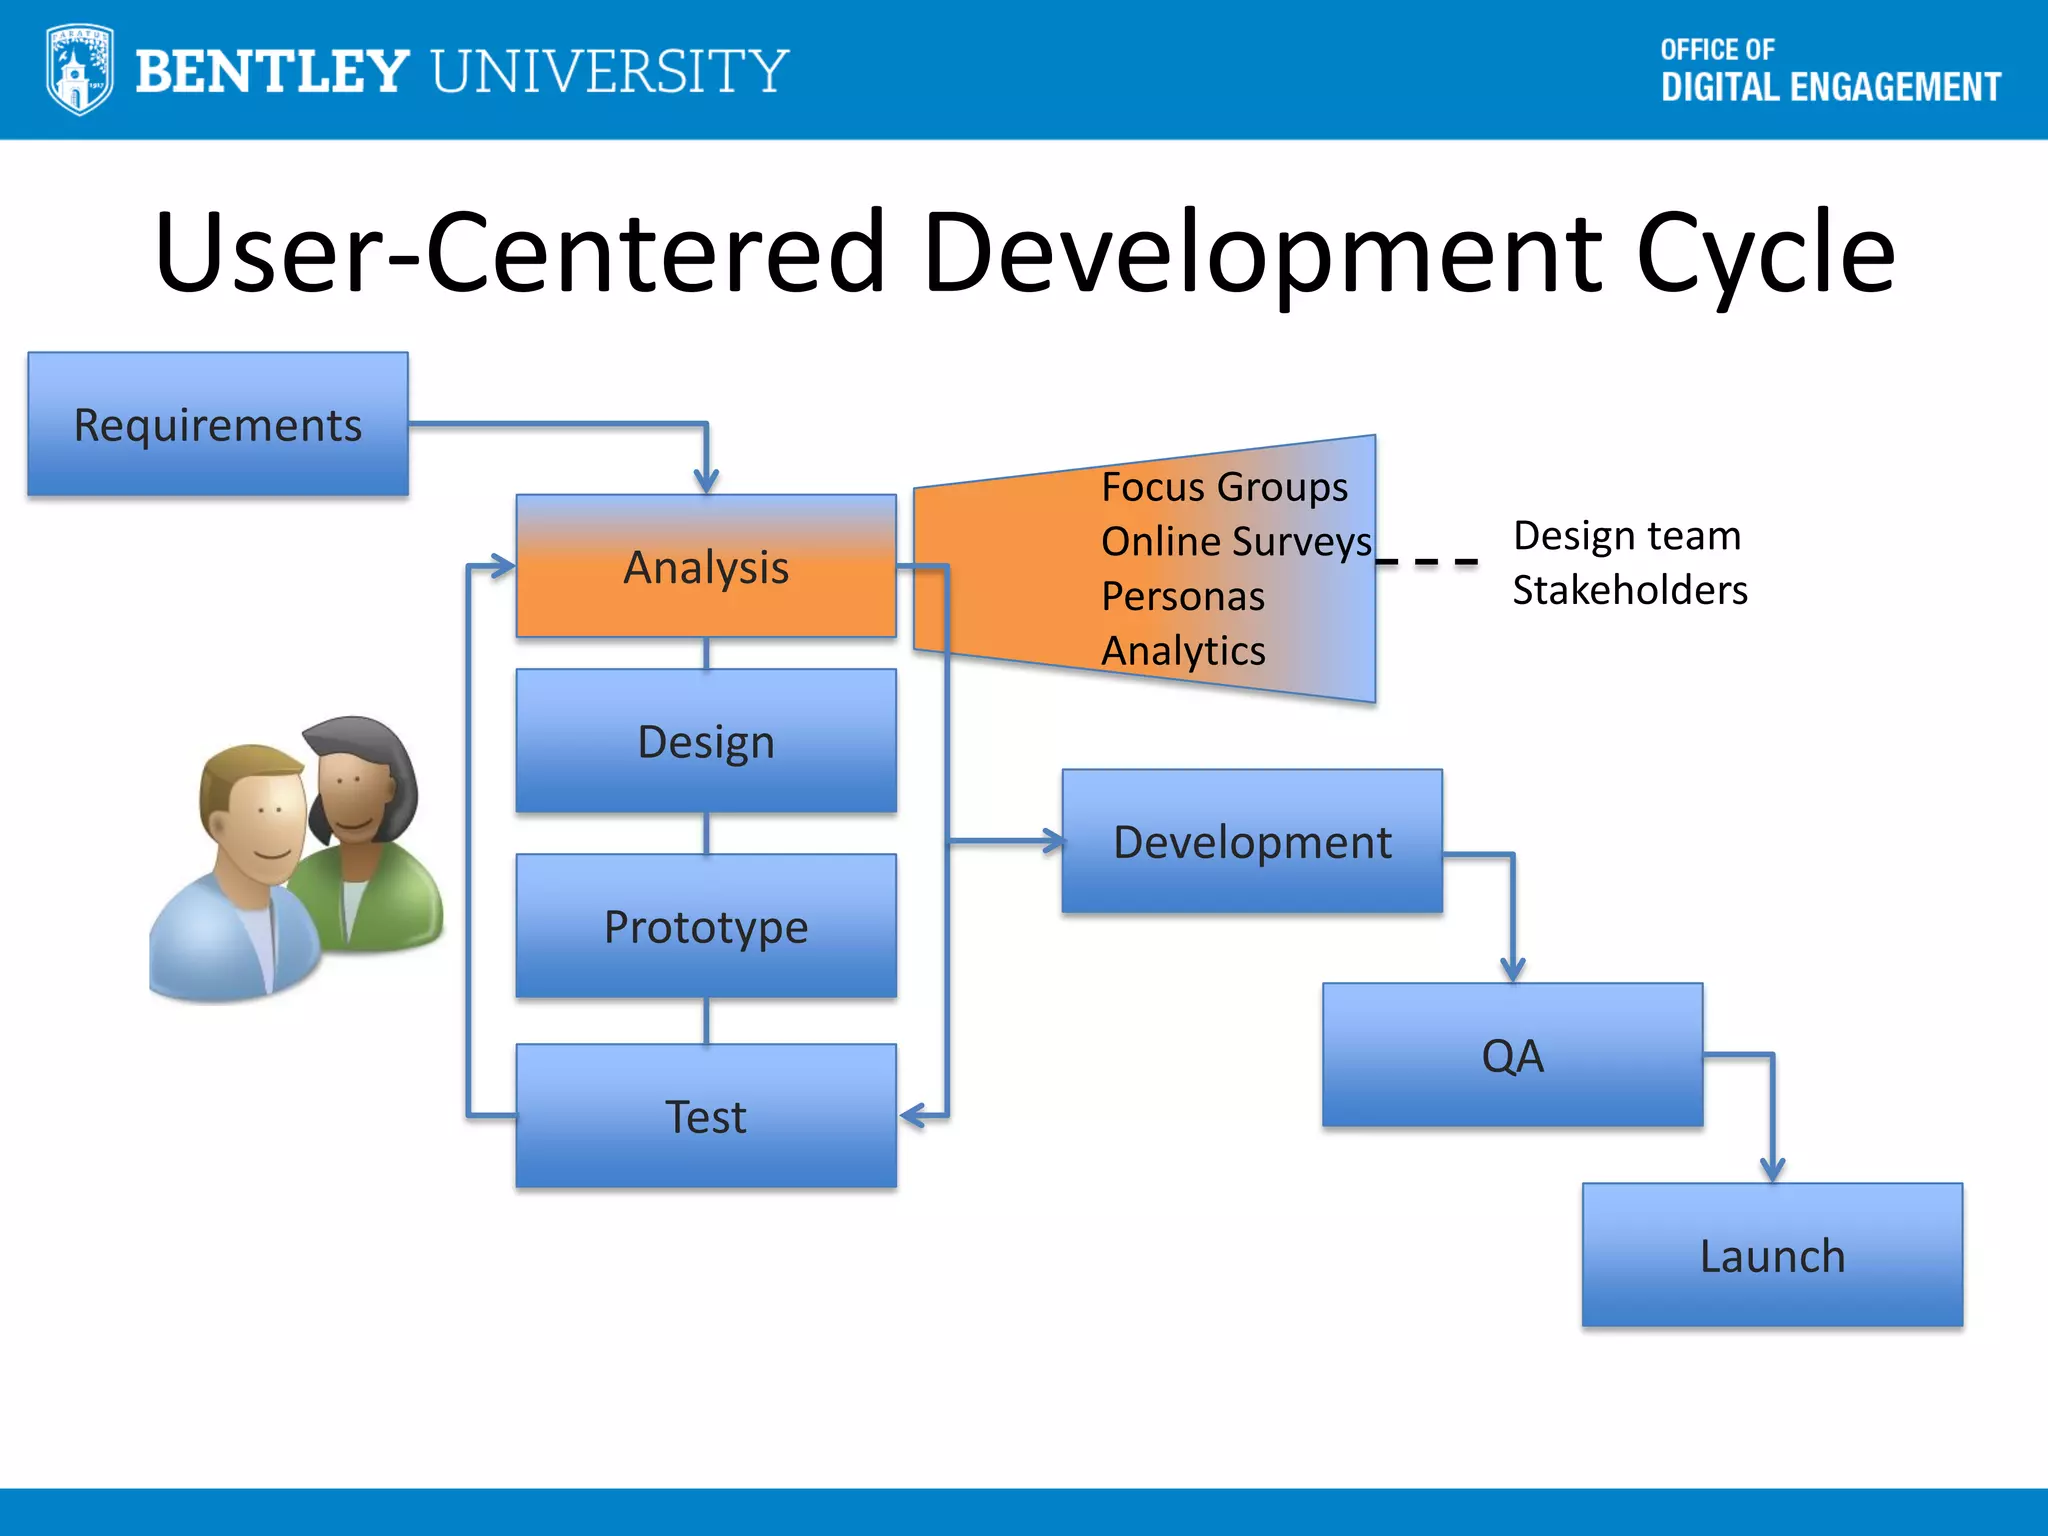
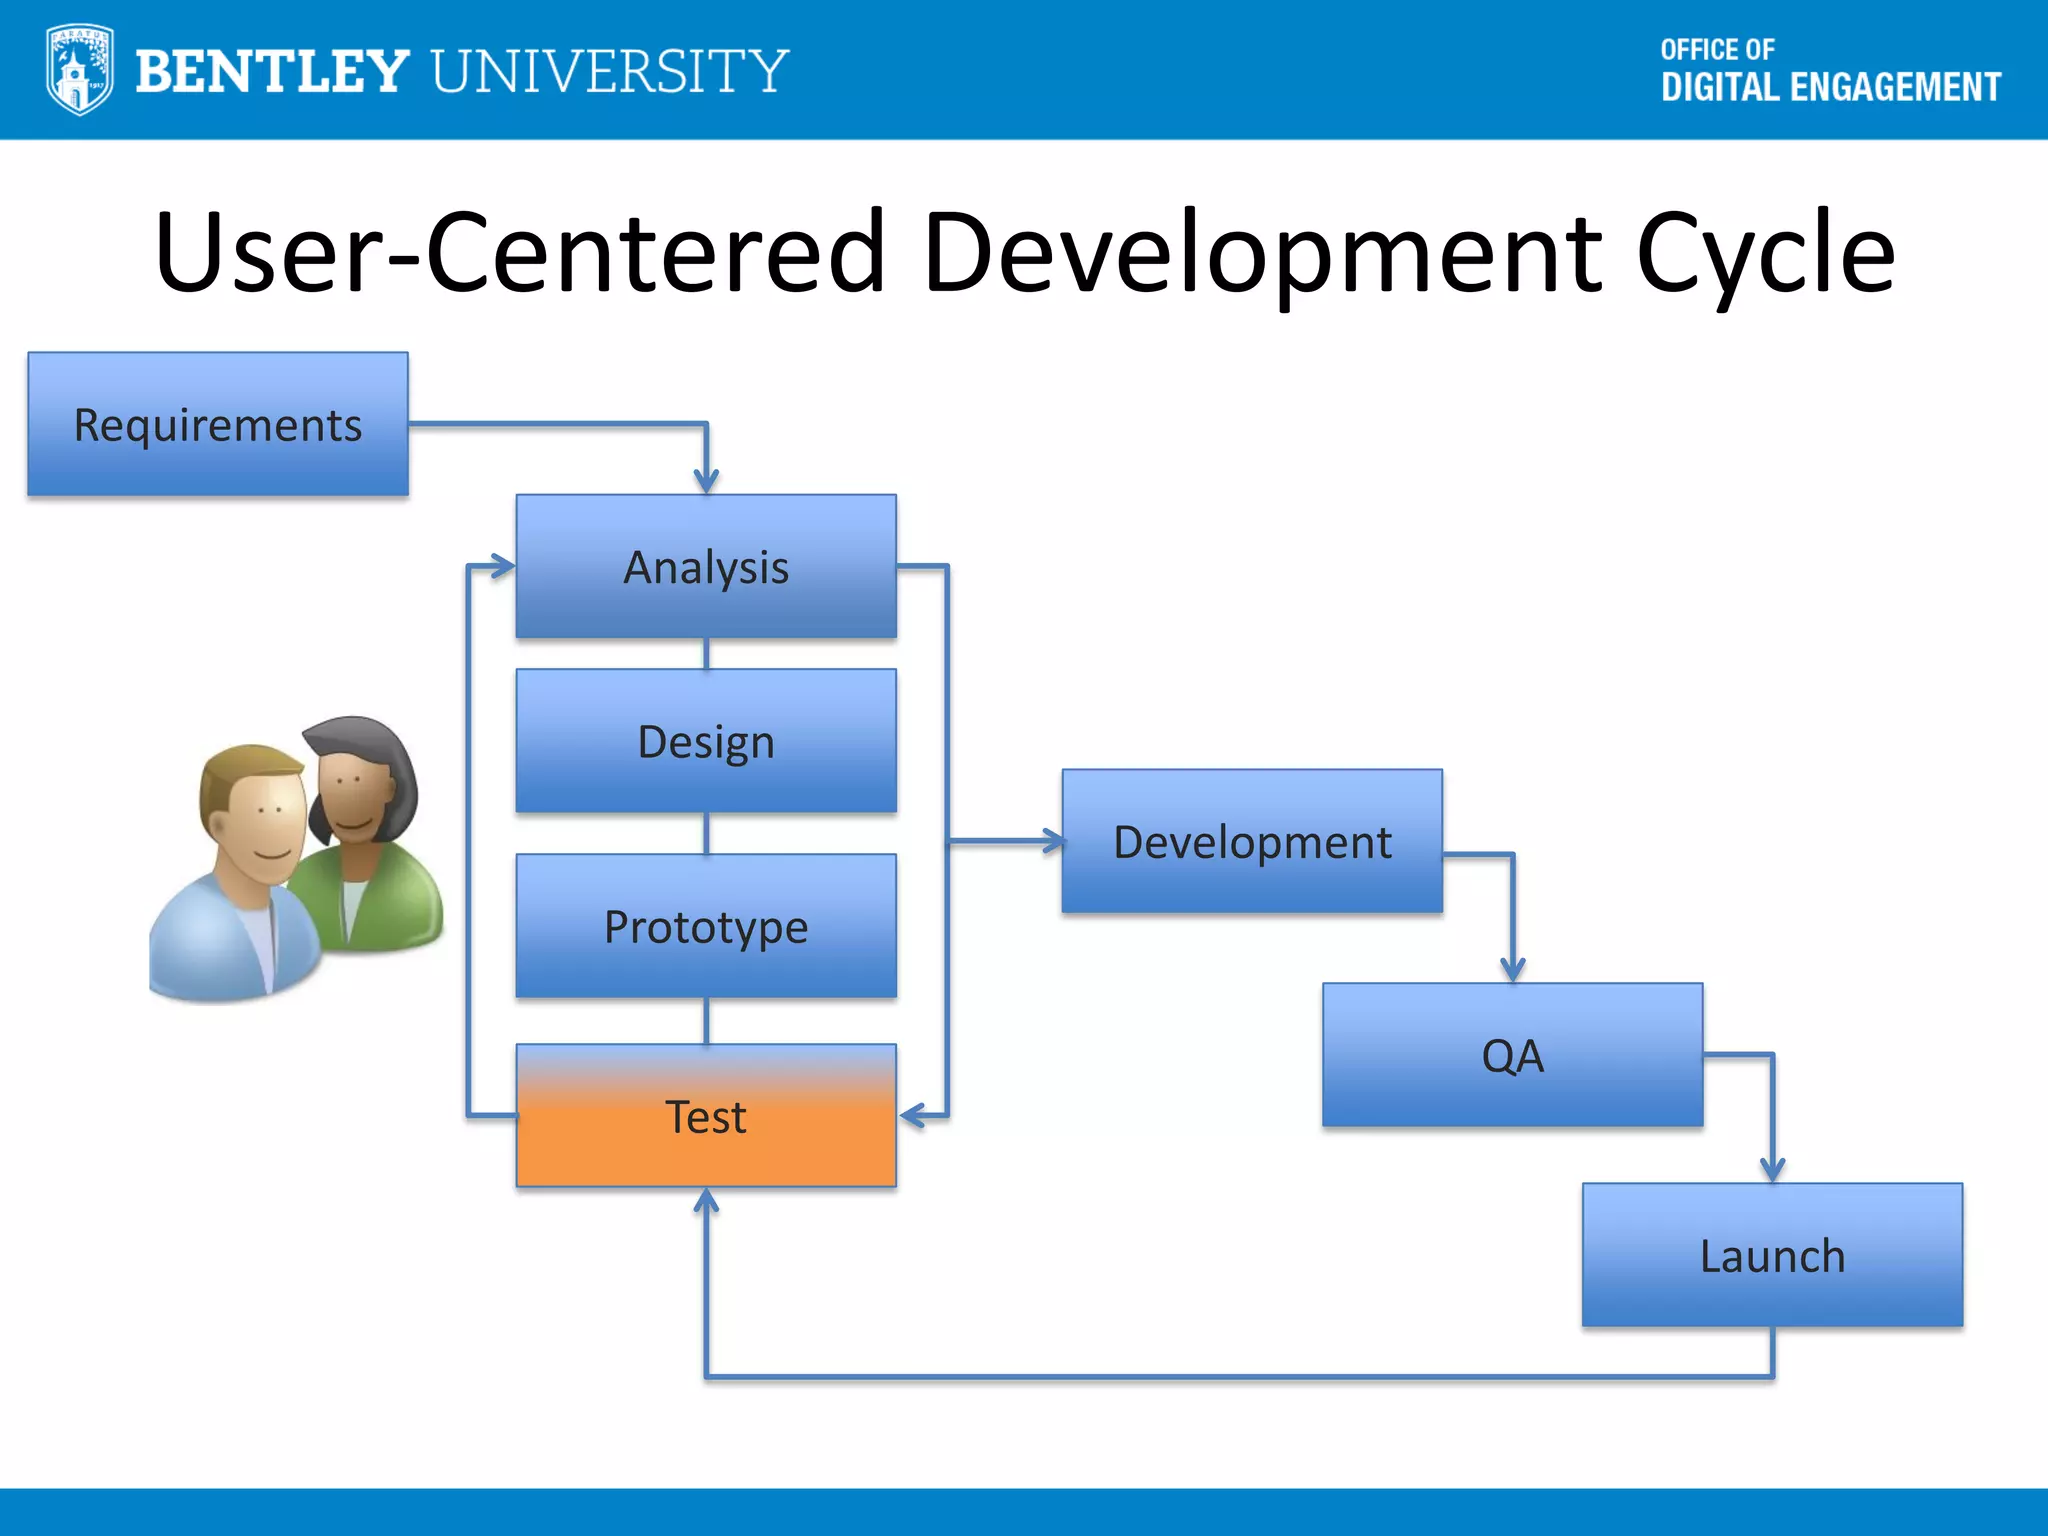
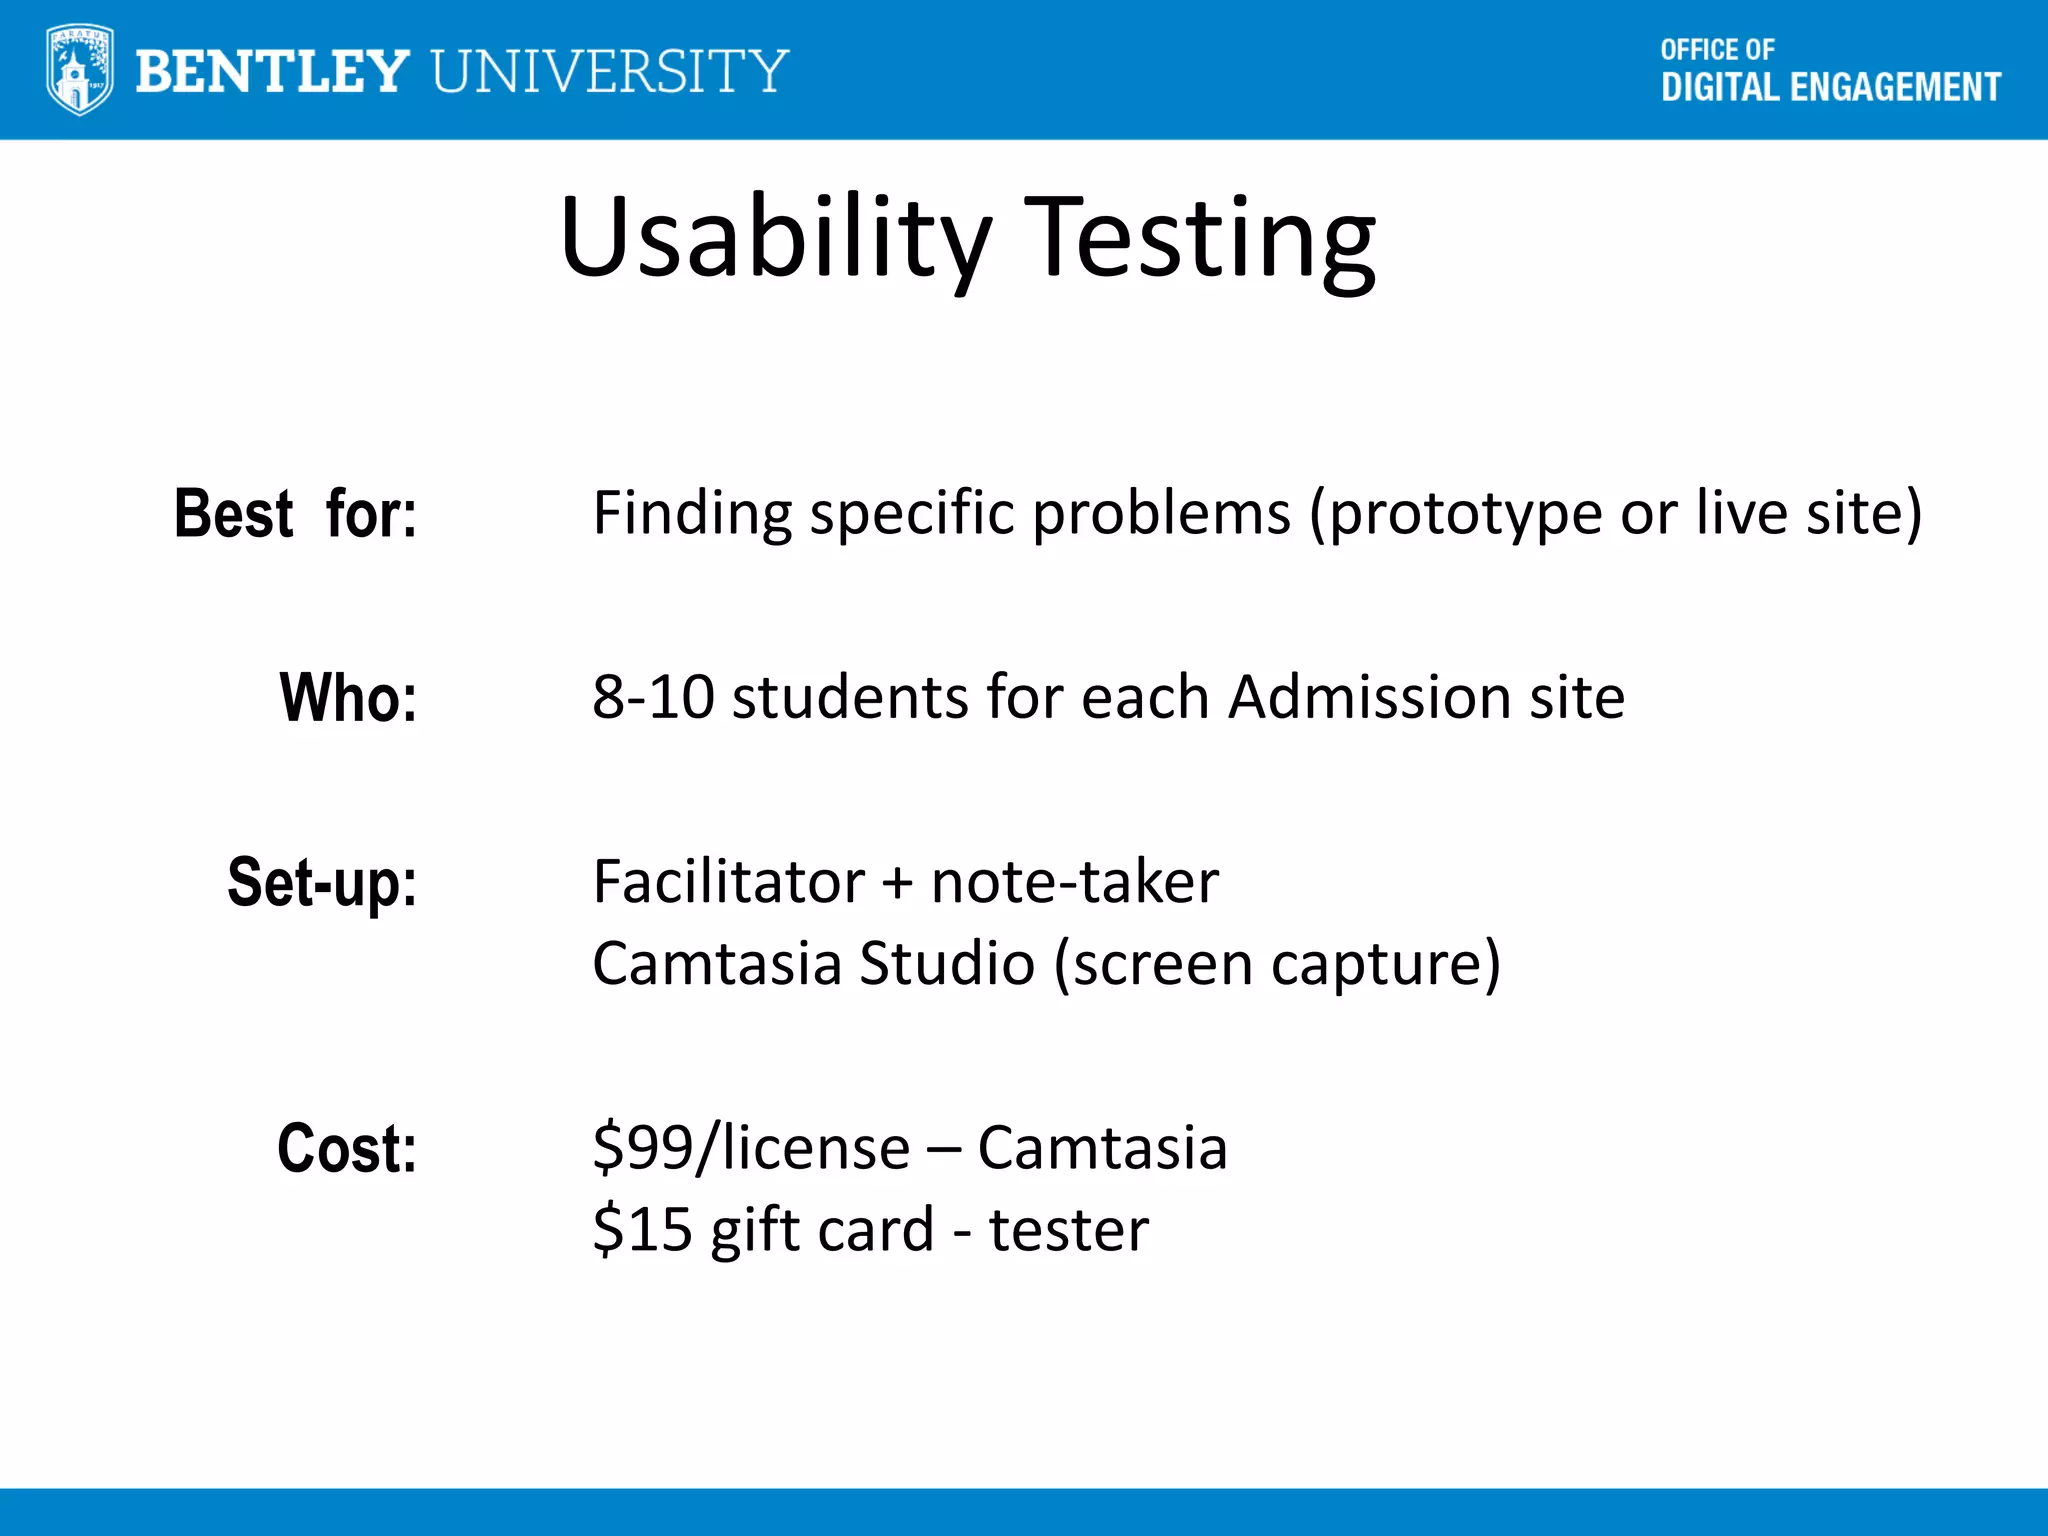
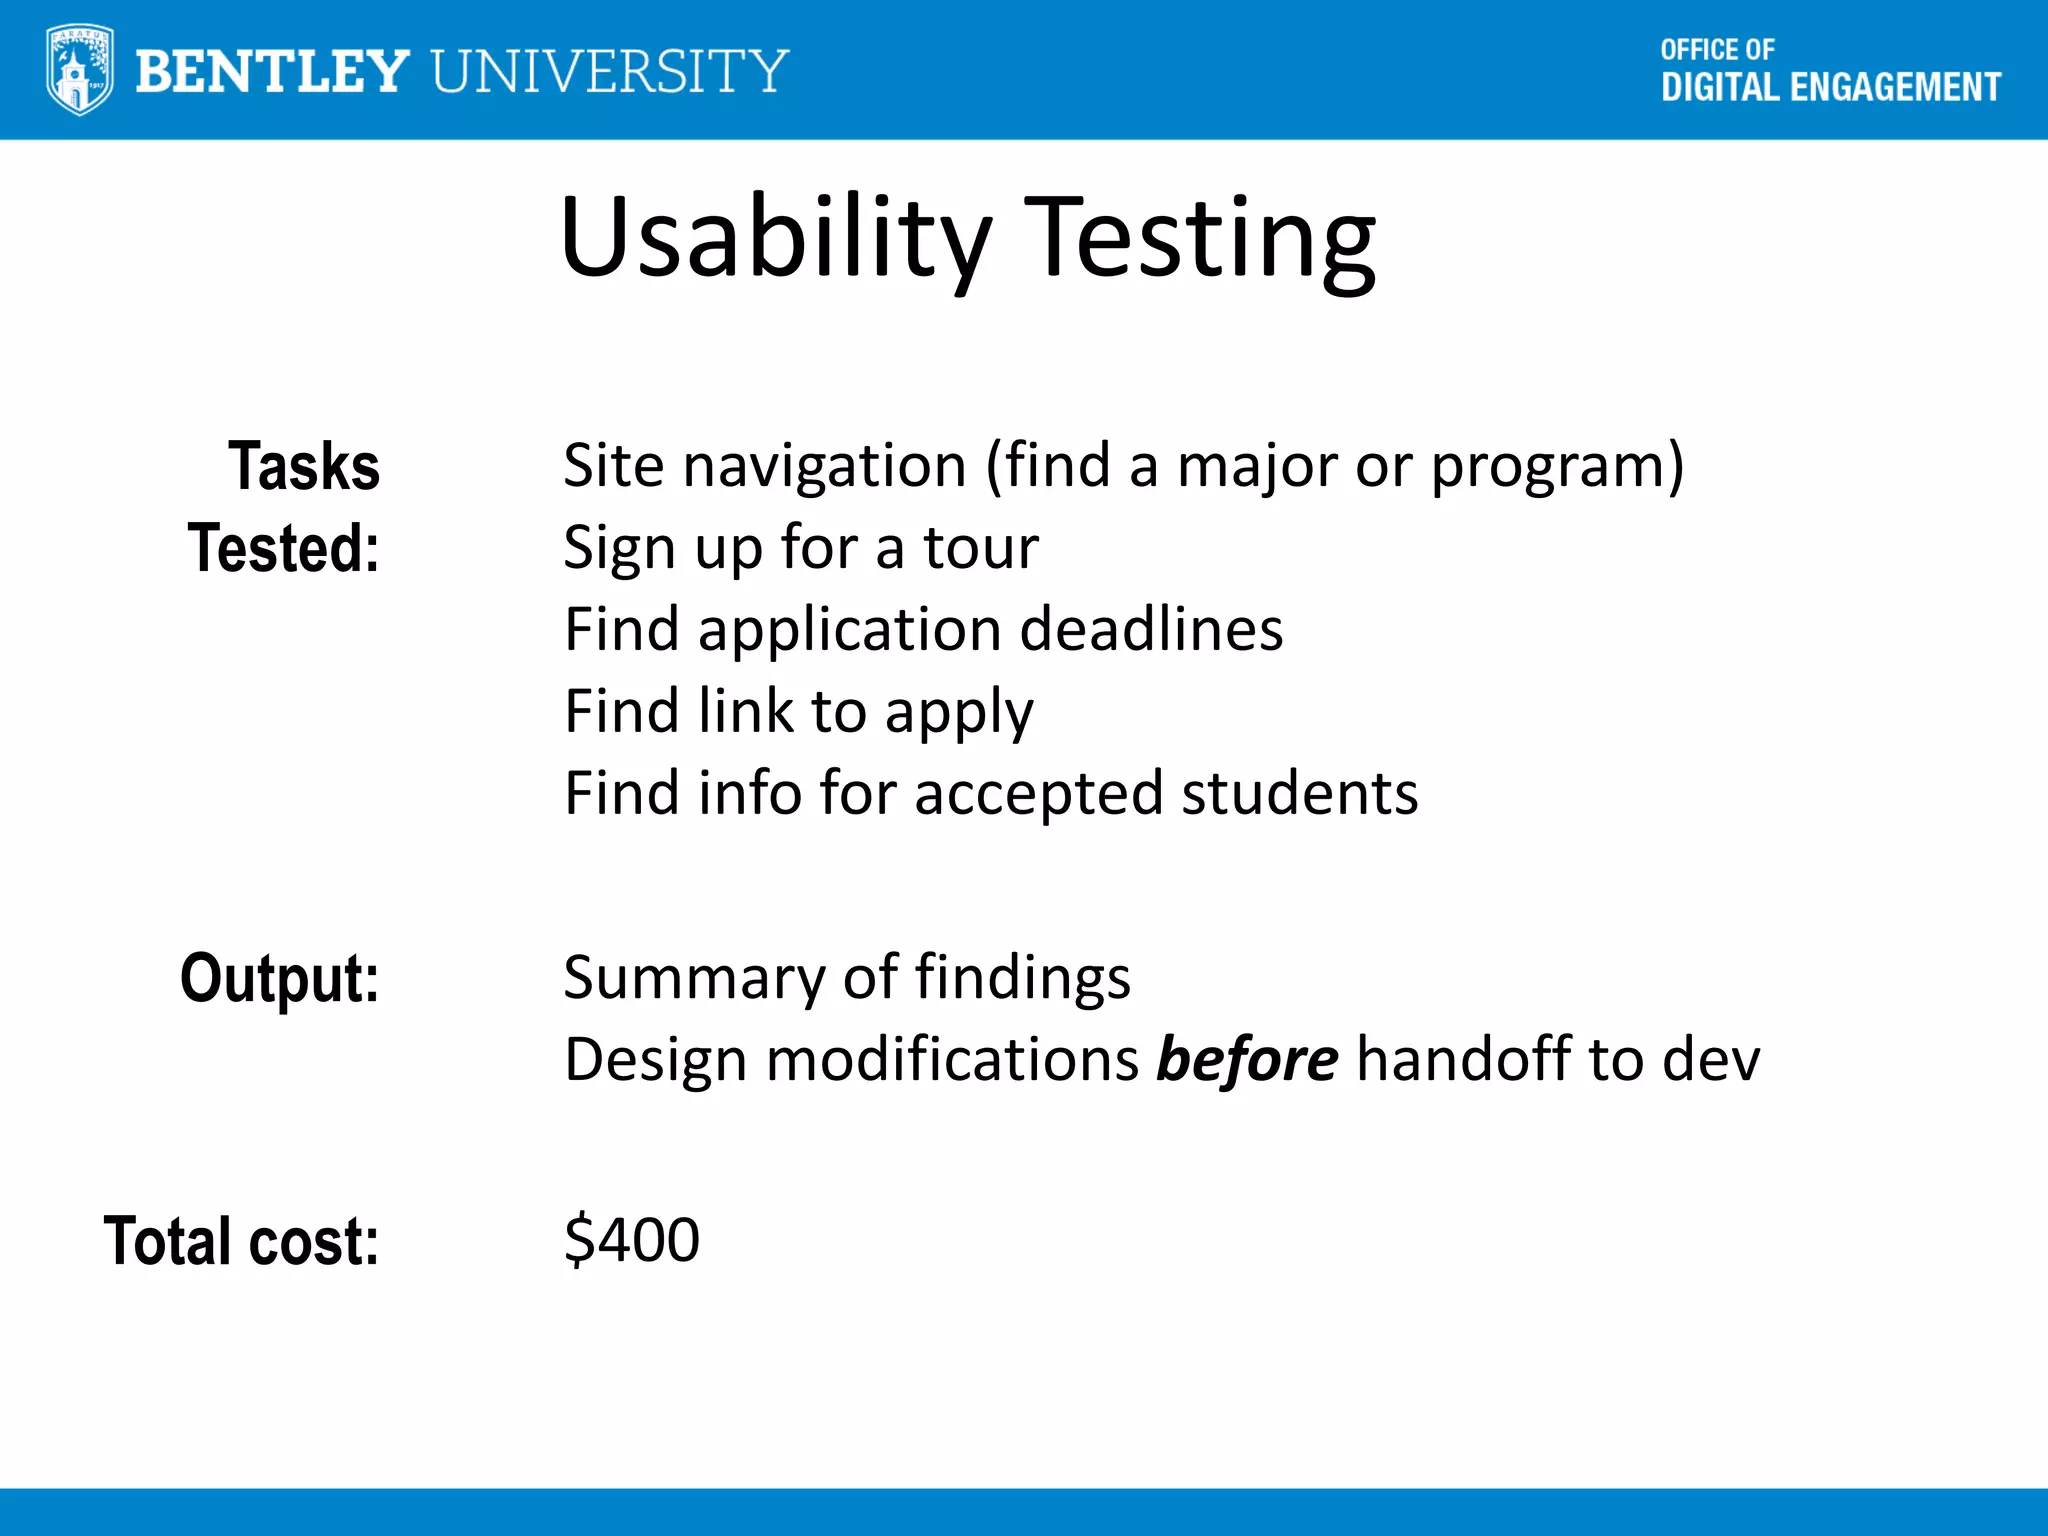
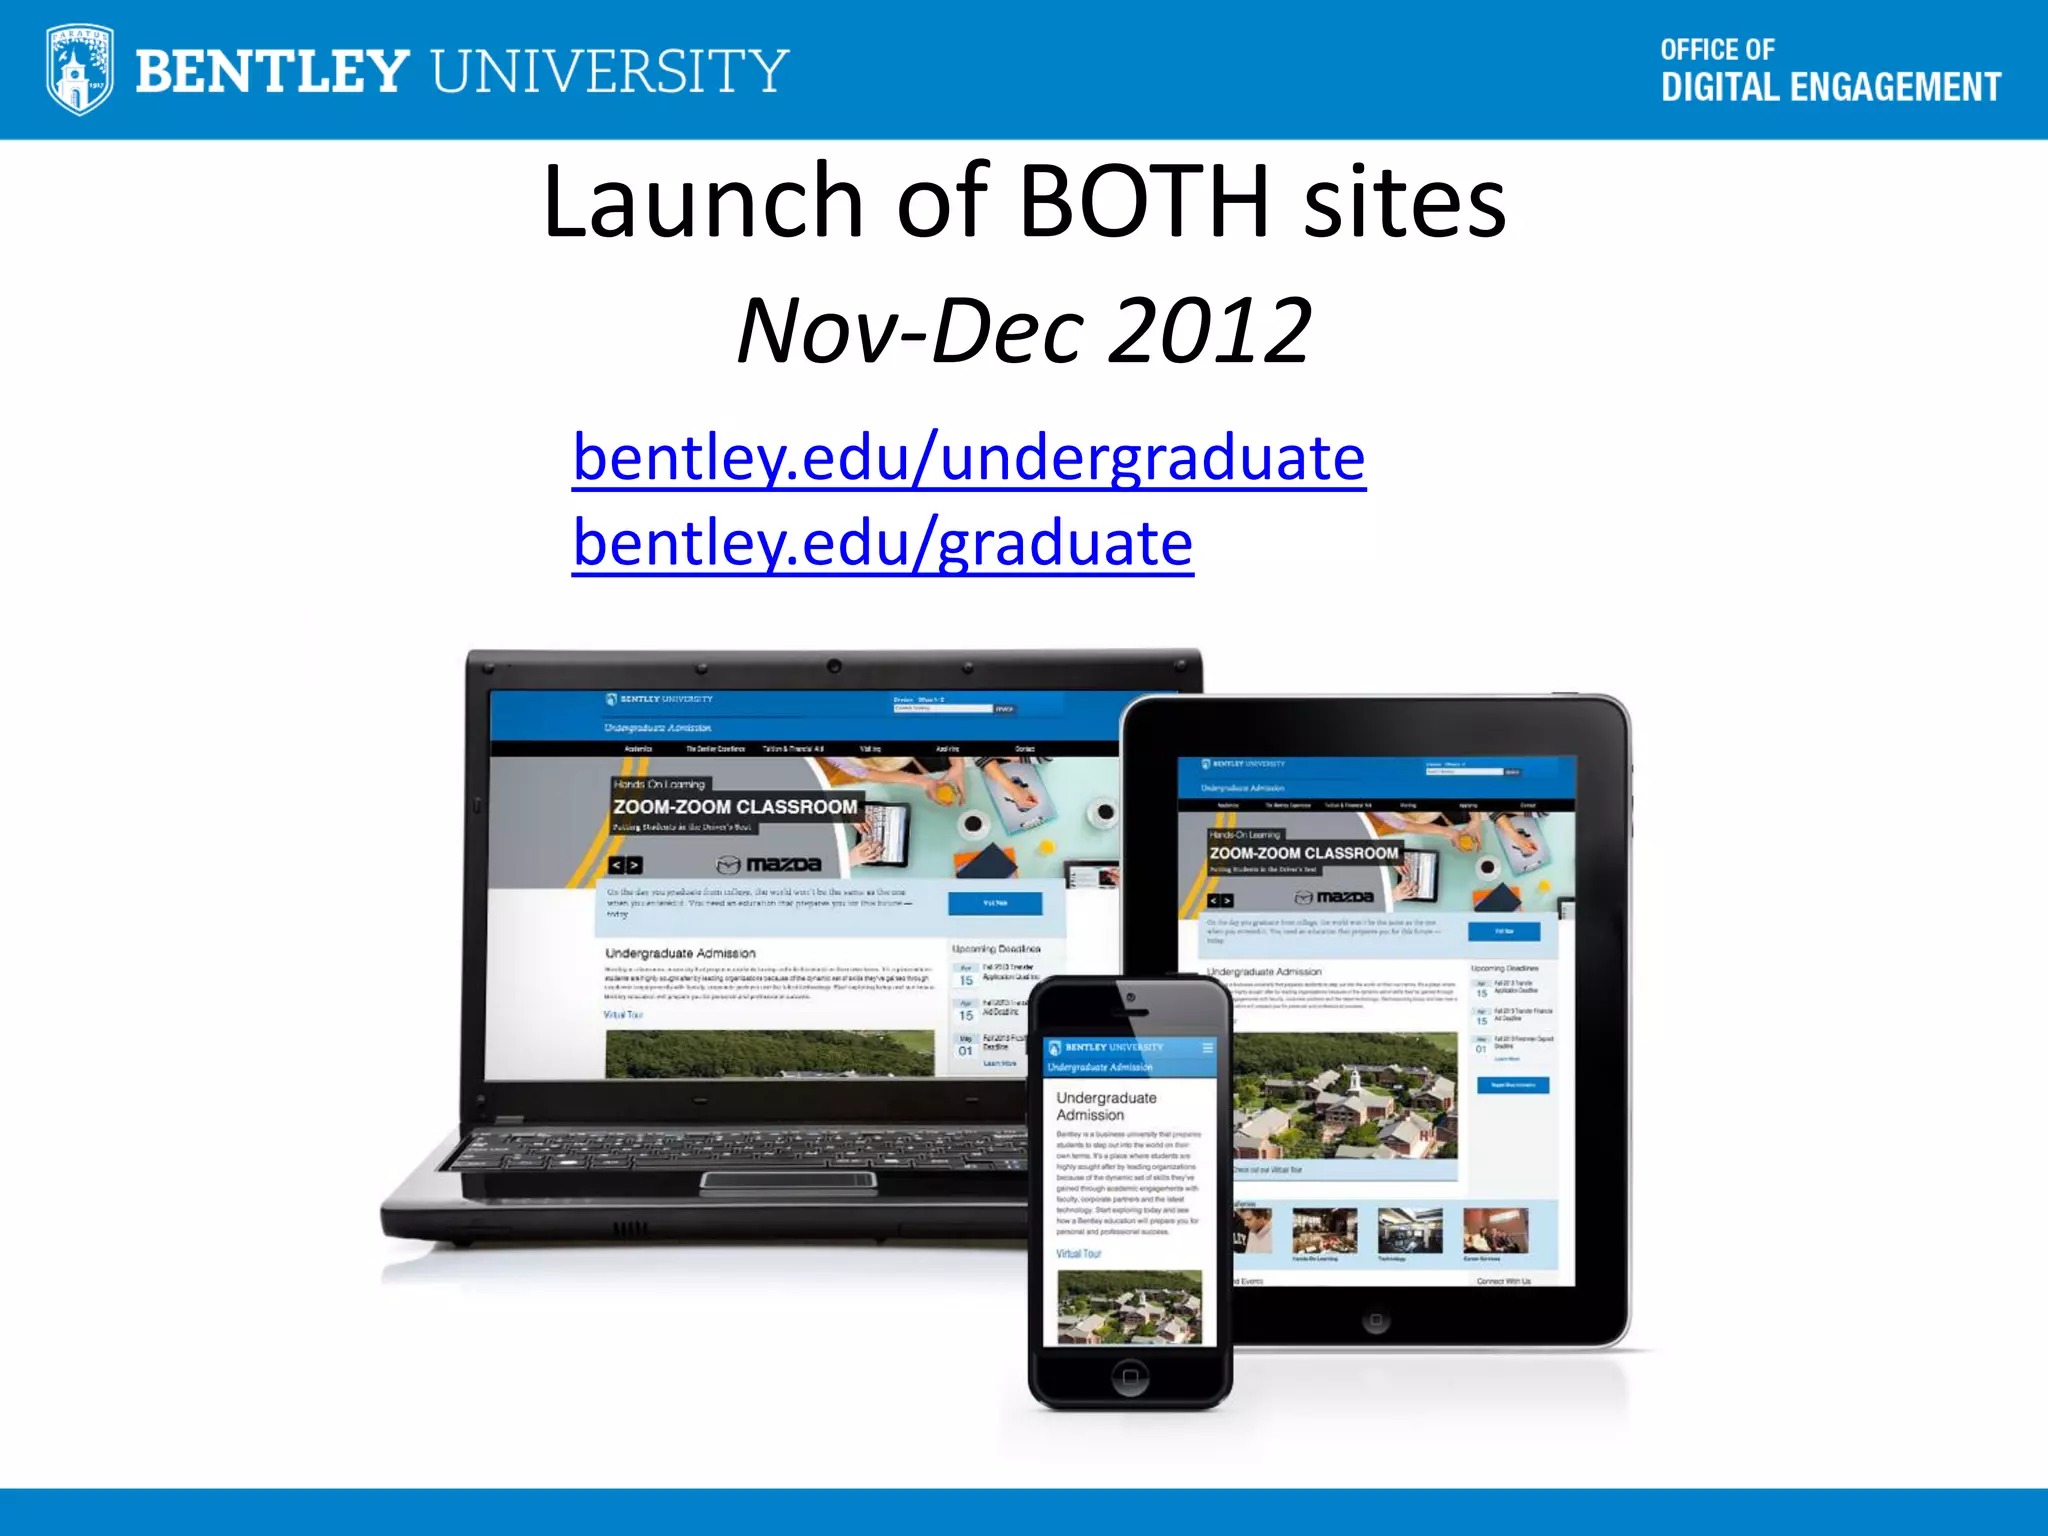
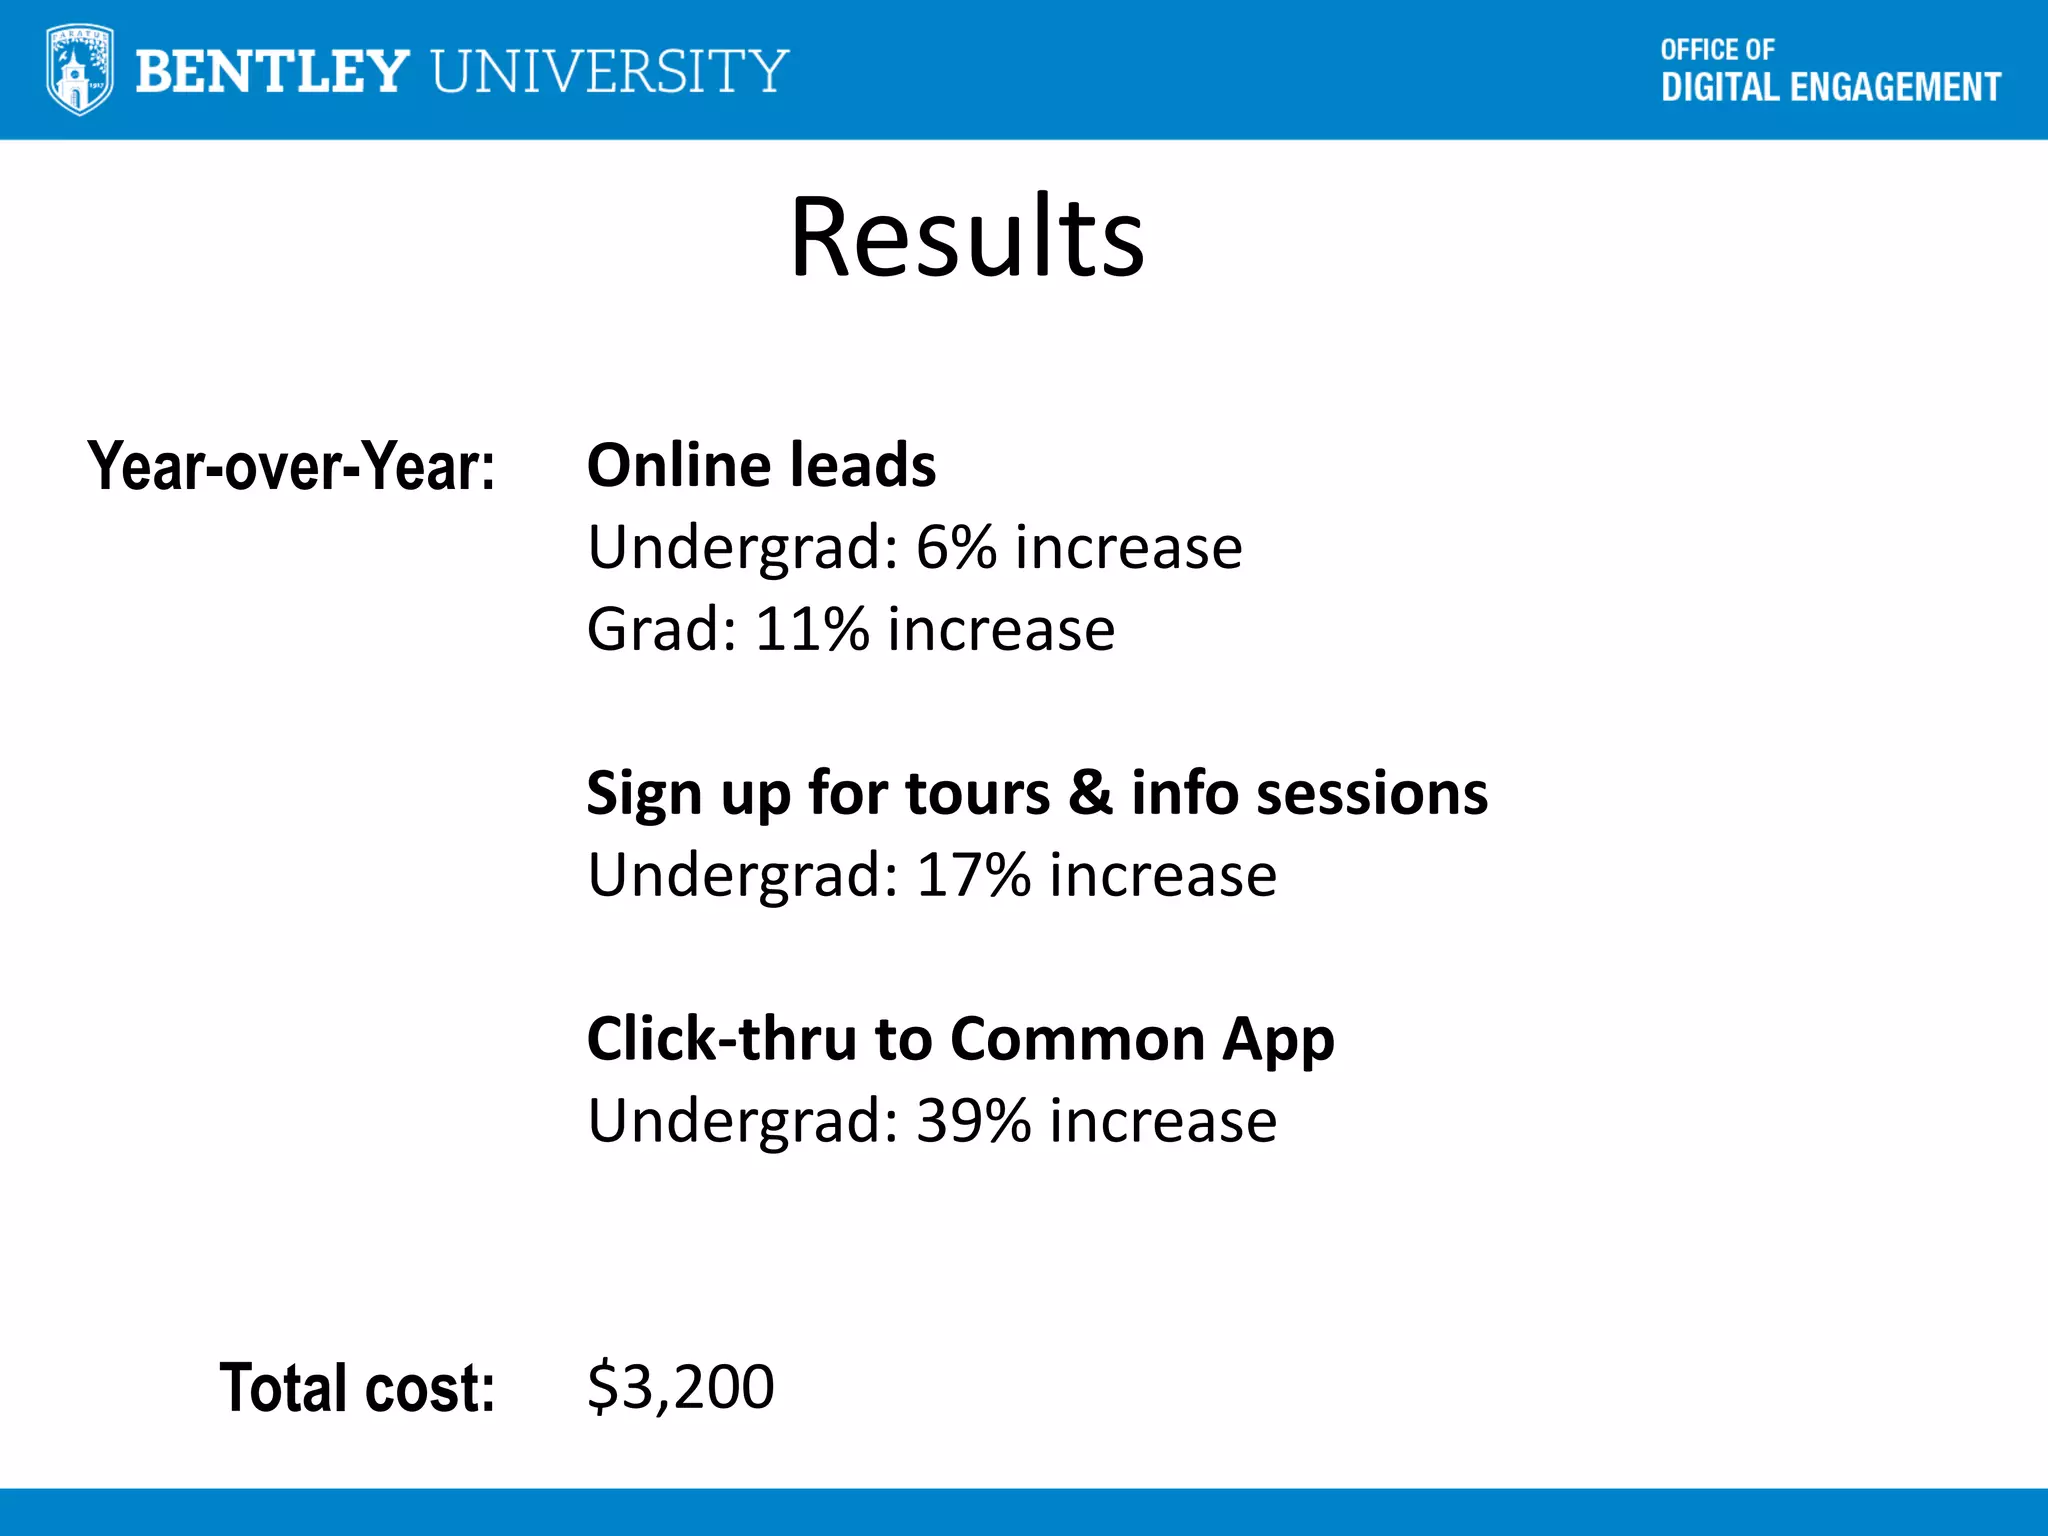
Usability Bootcamp
Driving Enrollment Results with
User-Centered Design
Val Fox
Bentley University | Office of Digital Engagement
eduWeb Conference
Social: #higheredusability #eduwebconf13 @valeriefox
By 3:45, you will learn to:
• Apply focus groups, usability testing, online
surveys, personas and Google Analytics to
develop user insights
By 3:45, you will learn to:
• Run focus groups and usability testing, launch
online surveys, develop personas and apply
Google Analytics to develop user insights
• Increase online conversion by an average of
25-30%
By 3:45, you will learn to:
• Run focus groups and usability testing, launch
online surveys, develop personas and apply
Google Analytics to develop user insights
• Increase online conversion by an average of
25-30%
• DIY for ~ $3,000
Business school in Waltham, MA
• 4,000+ undergraduate students; 1,400 graduate students
• 20 undergraduate majors; 10 masters programs
Digital Engagement Office
• 7-person team
• Supports ~80 sites
Infrastructure
• Managed cloud hosting by Acquia
• Powered by Drupal CMS
“It doesn’t matter what I
think about your website”
User-centered design begins with
understanding your users
Photo source: webcoursesbangkok.com
Make it easy to
find academic
program info
I use my mobile
device for all my
web browsing
Design for me
NOT you!
Your website will
affect what I think
of your school
You can text me
relevant info
Source: 2013 E-Expectations Report
Making a case for users begins
with NOT talking about users.
Admissions doesn’t care about “users”
So we offered them what they DO want:
• More info session and tour attendees
• More “request info” leads
• More applicants
Wake Up Call
Mobile traffic was doubling every
8-10 months
Source: Google Analytics
Wake Up Call
20% of prospective students said
they would remove a school from
consideration because of a poor
web experience
Source: Noel Levitz
2011 E-Expectations Report
Wake Up Call
70% of prospective students said a
school’s web site affects their
perception of the institution
Source: Noel Levitz
2013 E-Expectations Report
Admissions
We need a mobile
site by Fall!
We can learn Drupal 7
This is one of our top
priorities
Admissions
Design a new site!
Traditional Development
Requirements
Design
Development
QA
Launch
User-Centered Development
Analysis
Design
Development
QA
Launch
Prototype
Test
Requirements
But won’t all this take longer?!
100x more expensive to make
site changes POST launch
Nielson Norman Group
User-Centered Development Cycle
Analysis
Design
Development
QA
Launch
Prototype
Test
Requirements
Focus Groups
Online Surveys
Personas
Analytics
Focus Groups
Photo source: cartoonstock.com
Focus Groups
Best for: Sourcing qualitative feedback
Who: • Prospective undergraduate students
• Parents (undergraduate)
• Prospective graduate students
Source: • Undergraduate Tours
• Graduate Open House
Goal: Gain an understanding of
• General web usage
• College research process
• Priority online content
• Influencers
Photo source: tamarabustos.com
Focus Groups
Set up: 1 hr sessions at our research lab
Groups of 5-6 students/parents
Paid $50 each + pizza
Facilitator and note taker
Cost: $2,500
Time: 4 weeks
Output: Summary of findings > shared w/team
Bring personas to life:
“Don’t tweet me after I apply, that’s just weird!”
“My mom loves helping me with the research process, it’s
her way of ‘bonding’ with me.”
Center for Marketing Technology
Bentley University
Online Surveys
Online Surveys
Best for: Quantitative feedback
• Purpose of site visit
• Able to complete purpose of visit
• Why (or why not)
Who: 500+ site visitors to our Admissions sites
Online Surveys
Tool: iPerceptions “Plus” account
• Data export
• Unlimited data collection
• Device-specific
• Adjustable invitation rate
• Multi-language
Cost: $20/mo
Approach: 4 standard + optional questions
Online Surveys
Standard
Questions:
Rate your overall site experience (1-10)
Primary purpose of visit (multi-choice)
Were you able to complete purpose of your
visit (yes/no)
• If yes > what did you value most
• If no > why not
How likely are you to recommend
Optional
Questions:
Visit frequency
Source (how you arrived at site)
Demographics
Online Surveys
Output: Summary shared via PPT doc
Key
Learnings:
Qualified visitors are most
demanding
Content = meat + potatoes
“Information too vague”
“Couldn’t find average SAT scores”
“I want detailed information on the grad
program curriculum”
Photo source: chefmom.sheknows.com
Personas
Source: Forrester Research
Agency: Primacy
Personas
Defined as: Hypothetical user developed through interviews &
observations of real users
Use for: Create a common understanding of target audience
Must: • Sound like a real person
• Include compelling narrative
• Call out key attributes & high level goals
• Enable design decisions
• Include scenarios
Example Scenario
Persona Prospective graduate student
Goal: Find a part-time MBA program in Boston area
Scenario: • Searches for “Boston MBA programs”
• Reaches Bentley.edu > Academics > Graduate
Programs
• Sees MBA programs but labels aren’t clear
• Visits each program page to learn more but gets
frustrated with time spent
Personas
Source: Forrester Research
Agency: Primacy
Photos of Kelly’s items give a feeling for her lifestyle
Infographics convey Kelly’s device usage & tech
proficiency
Google Analytics
Best
for:
Cost:
Revealing behavior – NOT
intent
Comprehensive site analytics
AND ad-hoc reporting
Free!
Site Performance Measurement
Pre-launch: Tracking out-of-the-box stats:
• Site visits & visitors
• Pageviews
• Pages/visit
• Bounce rate
• Top pages
• Traffic by source
Results: No actionable insights
No ownership
Site Performance Measurement
Post-launch: Set up Admission profiles w/dashboards
Tracking KPIs & delivering automated reports:
• Conversion rates by form
• Conversion rates by source
• Cost per visit (search keywords)
Results Regular review w/stakeholders
Ownership & accountability
User-Centered Development Cycle
Analysis
Design
Development
QA
Launch
Prototype
Test
Requirements
Focus Groups
Online Surveys
Personas
Analytics
Design team
Stakeholders
User-Centered Development Cycle
Analysis
Design
Development
QA
Launch
Prototype
Test
Requirements
User Testing
Usability Testing
Best for: Finding specific problems (prototype or live site)
Who: 8-10 students for each Admission site
Set-up: Facilitator + note-taker
Camtasia Studio (screen capture)
Cost: $99/license – Camtasia
$15 gift card - tester
Usability Testing
Tasks
Tested:
Site navigation (find a major or program)
Sign up for a tour
Find application deadlines
Find link to apply
Find info for accepted students
Output: Summary of findings
Design modifications before handoff to dev
Total cost: $400
Launch of BOTH sites
Nov-Dec 2012
bentley.edu/undergraduate
bentley.edu/graduate
Results
Year-over-Year: Online leads
Undergrad: 6% increase
Grad: 11% increase
Sign up for tours & info sessions
Undergrad: 17% increase
Click-thru to Common App
Undergrad: 39% increase
Total cost: $3,200
Stay in touch
• Twitter:@ValerieFox
• www.slideshare.net/FoxAtBentley
• www.bentley.edu/DE

Driving Enrollment Results with User-Centered Design at Bentley University

  • 1.
    Usability Bootcamp Driving EnrollmentResults with User-Centered Design Val Fox Bentley University | Office of Digital Engagement eduWeb Conference Social: #higheredusability #eduwebconf13 @valeriefox
  • 2.
    By 3:45, youwill learn to: • Apply focus groups, usability testing, online surveys, personas and Google Analytics to develop user insights
  • 3.
    By 3:45, youwill learn to: • Run focus groups and usability testing, launch online surveys, develop personas and apply Google Analytics to develop user insights • Increase online conversion by an average of 25-30%
  • 4.
    By 3:45, youwill learn to: • Run focus groups and usability testing, launch online surveys, develop personas and apply Google Analytics to develop user insights • Increase online conversion by an average of 25-30% • DIY for ~ $3,000
  • 5.
    Business school inWaltham, MA • 4,000+ undergraduate students; 1,400 graduate students • 20 undergraduate majors; 10 masters programs Digital Engagement Office • 7-person team • Supports ~80 sites Infrastructure • Managed cloud hosting by Acquia • Powered by Drupal CMS
  • 6.
    “It doesn’t matterwhat I think about your website”
  • 7.
    User-centered design beginswith understanding your users Photo source: webcoursesbangkok.com Make it easy to find academic program info I use my mobile device for all my web browsing Design for me NOT you! Your website will affect what I think of your school You can text me relevant info Source: 2013 E-Expectations Report
  • 8.
    Making a casefor users begins with NOT talking about users.
  • 9.
    Admissions doesn’t careabout “users” So we offered them what they DO want: • More info session and tour attendees • More “request info” leads • More applicants
  • 10.
    Wake Up Call Mobiletraffic was doubling every 8-10 months Source: Google Analytics
  • 11.
    Wake Up Call 20%of prospective students said they would remove a school from consideration because of a poor web experience Source: Noel Levitz 2011 E-Expectations Report
  • 12.
    Wake Up Call 70%of prospective students said a school’s web site affects their perception of the institution Source: Noel Levitz 2013 E-Expectations Report
  • 13.
    Admissions We need amobile site by Fall! We can learn Drupal 7 This is one of our top priorities
  • 14.
  • 15.
  • 16.
  • 17.
    But won’t allthis take longer?! 100x more expensive to make site changes POST launch Nielson Norman Group
  • 18.
  • 19.
  • 20.
    Focus Groups Best for:Sourcing qualitative feedback Who: • Prospective undergraduate students • Parents (undergraduate) • Prospective graduate students Source: • Undergraduate Tours • Graduate Open House Goal: Gain an understanding of • General web usage • College research process • Priority online content • Influencers Photo source: tamarabustos.com
  • 21.
    Focus Groups Set up:1 hr sessions at our research lab Groups of 5-6 students/parents Paid $50 each + pizza Facilitator and note taker Cost: $2,500 Time: 4 weeks Output: Summary of findings > shared w/team Bring personas to life: “Don’t tweet me after I apply, that’s just weird!” “My mom loves helping me with the research process, it’s her way of ‘bonding’ with me.” Center for Marketing Technology Bentley University
  • 22.
  • 23.
    Online Surveys Best for:Quantitative feedback • Purpose of site visit • Able to complete purpose of visit • Why (or why not) Who: 500+ site visitors to our Admissions sites
  • 24.
    Online Surveys Tool: iPerceptions“Plus” account • Data export • Unlimited data collection • Device-specific • Adjustable invitation rate • Multi-language Cost: $20/mo Approach: 4 standard + optional questions
  • 25.
    Online Surveys Standard Questions: Rate youroverall site experience (1-10) Primary purpose of visit (multi-choice) Were you able to complete purpose of your visit (yes/no) • If yes > what did you value most • If no > why not How likely are you to recommend Optional Questions: Visit frequency Source (how you arrived at site) Demographics
  • 26.
    Online Surveys Output: Summaryshared via PPT doc Key Learnings: Qualified visitors are most demanding Content = meat + potatoes “Information too vague” “Couldn’t find average SAT scores” “I want detailed information on the grad program curriculum” Photo source: chefmom.sheknows.com
  • 27.
  • 28.
    Personas Defined as: Hypotheticaluser developed through interviews & observations of real users Use for: Create a common understanding of target audience Must: • Sound like a real person • Include compelling narrative • Call out key attributes & high level goals • Enable design decisions • Include scenarios
  • 29.
    Example Scenario Persona Prospectivegraduate student Goal: Find a part-time MBA program in Boston area Scenario: • Searches for “Boston MBA programs” • Reaches Bentley.edu > Academics > Graduate Programs • Sees MBA programs but labels aren’t clear • Visits each program page to learn more but gets frustrated with time spent
  • 30.
    Personas Source: Forrester Research Agency:Primacy Photos of Kelly’s items give a feeling for her lifestyle Infographics convey Kelly’s device usage & tech proficiency
  • 31.
    Google Analytics Best for: Cost: Revealing behavior– NOT intent Comprehensive site analytics AND ad-hoc reporting Free!
  • 32.
    Site Performance Measurement Pre-launch:Tracking out-of-the-box stats: • Site visits & visitors • Pageviews • Pages/visit • Bounce rate • Top pages • Traffic by source Results: No actionable insights No ownership
  • 33.
    Site Performance Measurement Post-launch:Set up Admission profiles w/dashboards Tracking KPIs & delivering automated reports: • Conversion rates by form • Conversion rates by source • Cost per visit (search keywords) Results Regular review w/stakeholders Ownership & accountability
  • 34.
  • 35.
  • 36.
  • 37.
    Usability Testing Best for:Finding specific problems (prototype or live site) Who: 8-10 students for each Admission site Set-up: Facilitator + note-taker Camtasia Studio (screen capture) Cost: $99/license – Camtasia $15 gift card - tester
  • 38.
    Usability Testing Tasks Tested: Site navigation(find a major or program) Sign up for a tour Find application deadlines Find link to apply Find info for accepted students Output: Summary of findings Design modifications before handoff to dev Total cost: $400
  • 39.
    Launch of BOTHsites Nov-Dec 2012 bentley.edu/undergraduate bentley.edu/graduate
  • 40.
    Results Year-over-Year: Online leads Undergrad:6% increase Grad: 11% increase Sign up for tours & info sessions Undergrad: 17% increase Click-thru to Common App Undergrad: 39% increase Total cost: $3,200
  • 41.
    Stay in touch •Twitter:@ValerieFox • www.slideshare.net/FoxAtBentley • www.bentley.edu/DE