Download to read offline

![Conclusions Intentional educational media can promote new knowledge acquisition, skills development and behaviour change. More than awareness. More than marketing My future research will write up the process of making educational media, as a model for use. Full findings available from: Ingrid Bruynse [email_address] www.brightmedia.co.za](https://image.slidesharecdn.com/edulearn11-110705023500-phpapp02/85/Edu-learn11-21-320.jpg)

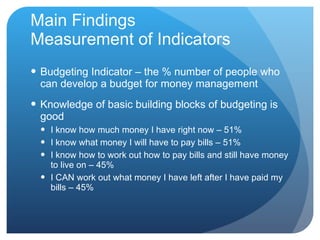
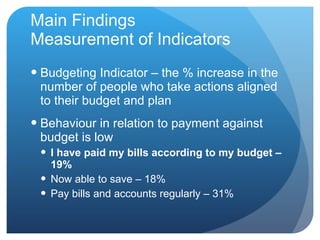
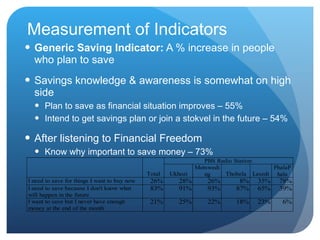
The document summarizes research on the impact of an educational radio drama in South Africa called "Financial Freedom" on listeners' financial literacy. Key findings include: 1) Exposure to the radio drama increased listeners' knowledge of basic financial concepts like budgeting and saving and their ability to develop budgets. 2) It also increased financially beneficial behaviors among some listeners, with more reporting opening savings accounts or talking to others about financial planning. 3) However, changing behaviors proved more difficult than increasing knowledge and many listeners struggled to consistently save or follow budgets. 4) The researcher concluded educational media can effectively promote new learning but changing behaviors requires more than awareness campaigns and requires further research.


