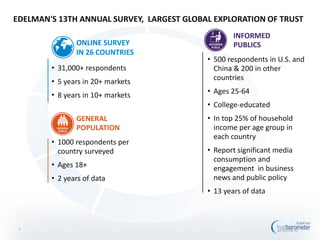

![54%
39%
50%
43%
56%
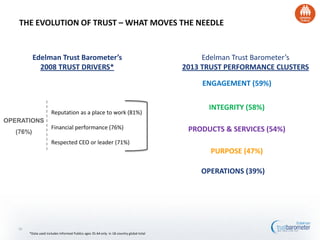
59%
59%
36%
54%
46%
50%
62%
43%
30%
46%
40%
43%
53%
63%
45%
63%
55%
58%
70%
20%
30%
40%
50%
60%
70%
80%
2008 2009 2010 2011 2012 2013
Energy
Business
Government
NGOs
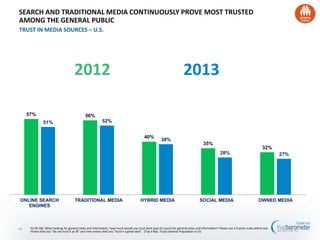
TRUST IN INSTITUTIONS RISE PAST 2010 HIGHS
TRUST IN INSTITUTIONS – INFORMED PUBLICS AGES 35-64 – U.S.
Q11-14. [TRACKING] Below is a list of institutions. For each one, please indicate how much you trust that institution to do what is right using a 9-point scale where one means
that you “do not trust them at all” and nine means that you “trust them a great deal”. (Top 4 Box, Trust) Informed Publics ages 35-64 in US
8
2008
16 point gap
between business &
government trust
2013
Business, energy &
government trust are
all within 9 points
NGOs](https://image.slidesharecdn.com/2013edelmantrustbarometer-usenergyindustrydeck20130530-130607151111-phpapp02/85/Edelman-Trust-Barometer-U-S-Energy-Industry-8-320.jpg)
![Q11-14. [TRACKING] Below is a list of institutions. For each one, please indicate how much you trust that institution to do what is right using a 9-point scale where one
means that you “do not trust them at all” and nine means that you “trust them a great deal”. (Top 2 Box, Trust a great deal and Top 4 Box, Trust) Informed Publics ages 25-64
in US
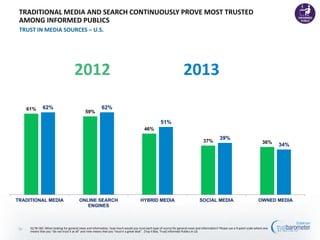
TRUST ON THE RISE ACROSS INSTITUTIONS
TRUST IN INSTITUTIONS – U.S.
9
2012
Total Trust
2013
Total Trust
45% 51%
US
2012
Total Trust
2013
Total Trust
58%
70%
US
2012
Total Trust
2013
Total Trust
NGOS
BUSINESS
MEDIA
GOVERNMENT
2012
Total Trust
2013
Total Trust
43%
53%
US
50%
62%
US
ENERGY
2012
Total Trust
2013
Total Trust
56% 59%](https://image.slidesharecdn.com/2013edelmantrustbarometer-usenergyindustrydeck20130530-130607151111-phpapp02/85/Edelman-Trust-Barometer-U-S-Energy-Industry-9-320.jpg)
![59%
82%
64%
49%
74%
56%
81%
44%
56%
52%
44%
40%
62%
56%
47% 48%
63%
58%
48%
61% 60%
77%
44%
58%
65%
74%
31%
50%
41%
33%
19%
47%
30%
57%
20%
35%
32% 32%
29%
53%
47%
40%
43%
60%
58%
48%
62% 63%
82%
49%
65%
73%
81%
44%
Q11-14. [Business in General and Government in General] Below is a list of institutions. For each one, please indicate how much you trust that institution to do what is right using a
9-point scale where one means that you “do not trust them at all” and nine means that you “trust them a great deal”. (Top 4 Box, Trust) Informed Publics ages 25-64 in 26-country
global total and across 26 countries
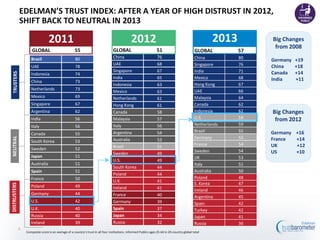
BUSINESS TRUSTED MORE THAN GOVERNMENT IN
16 OF 26 MARKETS SURVEYED
TRUST IN BUSINESS VS. GOVERNMENT - 26 MARKET OVERVIEW
Government
Business
GAP BETWEEN BUSINESS & GOVERNMENT GROWING
Globally, largest gap since 2007*
US Trust in Business: 62%
US Trust in Government: 53%
US Trust in Energy: 59%
10](https://image.slidesharecdn.com/2013edelmantrustbarometer-usenergyindustrydeck20130530-130607151111-phpapp02/85/Edelman-Trust-Barometer-U-S-Energy-Industry-10-320.jpg)
![SLIGHT UPTICKS IN MANY SCORES, INCLUDING ENERGY
TRUST IN INDUSTRIES – U.S.
Q43-60. [TRACKING] Please indicate how much you trust businesses in each of the following industries to do what is right. Again, please use the same 9-point scale where one
means that you “do not trust them at all” and nine means that you “trust them a great deal”. (Top 4 Box, Trust) Informed Public ages 25-64 in US
11
Q43-60. [TRACKING] Please indicate how much you trust businesses in each of the following industries to do what is right. Again, please use the same 9-point scale where one
means that you “do not trust them at all” and nine means that you “trust them a great deal”. (Top 4 Box, Trust) Informed Publics ages 25-64 (only industries tracked from 2012 to
2013 shown)
80%
75%
72%
70%
70%
66%
59%
55%
52%
50%
50%
Technology
Brewing and spirits
Food and beverage
Automotive
Consumer packaged goods
Telecommunications
Energy
Pharmaceuticals
Financial services
Banks
Media
20132012
41%
46%
48%
56%
56%
64%
66%
71%
74%
74%
83%
Banks
Financial services
Media
Energy
Pharmaceuticals
Telecommunications
Automotive
Brewing and spirits
Consumer packaged goods
Food and beverage
Technology
Technology #1 in all
markets surveyed](https://image.slidesharecdn.com/2013edelmantrustbarometer-usenergyindustrydeck20130530-130607151111-phpapp02/85/Edelman-Trust-Barometer-U-S-Energy-Industry-11-320.jpg)

![50%
Trust in Business
53%
Trust in the Energy Industry
THE GENERAL PUBLIC IS MORE TRUSTING OF THE ENERGY INDUSTRY THAN
BUSINESS OVERALL
TRUST IN ENERGY INDUSTRY VS. TRUST IN BUSINESS – U.S.
Q11-14. [TRACKING] Below is a list of institutions. For each one, please indicate how much you trust that institution to do what is right using a 9-point scale where one
means that you “do not trust them at all” and nine means that you “trust them a great deal”.; Q43-60. [TRACKING] Please indicate how much you trust businesses in each
of the following industries to do what is right. Again, please use the same 9-point scale where one means that you “do not trust them at all” and nine means that you
“trust them a great deal”. (Top 4 Box, Trust) General Population in US
13
0%
10%
20%
30%
40%
50%
60%
70%
80%
90%
100%
Energy Industry
Trust (53%)
Business Trust
(50%)](https://image.slidesharecdn.com/2013edelmantrustbarometer-usenergyindustrydeck20130530-130607151111-phpapp02/85/Edelman-Trust-Barometer-U-S-Energy-Industry-13-320.jpg)
![14
57%
61%
69%
55%
49%
80%
54%
80%
75%
69%
43% 42%
47%
71%
76%
67%
76%
49%
55%
49%
57%
53%
52%
37%
40%
36% 37%
50%
35%
43%
37%
32%
67%
42%
68%
64%
58%
34% 33%
38%
63%
69%
60%
69%
44%
51%
45%
53%
50%
54%
42%
48%
44%
49%
Energy Industry
Business
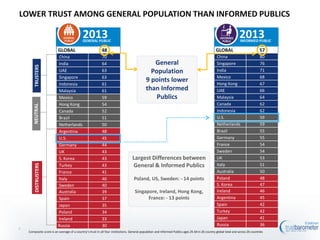
ENERGY INDUSTRY MORE TRUSTED THAN BUSINESS IN 21 OF 26 MARKETS;
LARGEST DIFFERENCES SEEN IN SOUTH KOREA AND HONG KONG
TRUST IN ENERGY INDUSTRY VS. BUSINESS IN GENERAL – 26 MARKET OVERVIEW
Q11-1[TRACKING] Below is a list of institutions. For each one, please indicate how much you trust that institution to do what is right using a 9-point scale where one
means that you “do not trust them at all” and nine means that you “trust them a great deal”.; Q43-60. [TRACKING] Please indicate how much you trust businesses in each
of the following industries to do what is right. Again, please use the same 9-point scale where one means that you “do not trust them at all” and nine means that you
“trust them a great deal”. (Top 4 Box, Trust) General Population in 26 -country global total and across 26 countries
J
US Trust in Energy :53%
US Trust in Business: 50%](https://image.slidesharecdn.com/2013edelmantrustbarometer-usenergyindustrydeck20130530-130607151111-phpapp02/85/Edelman-Trust-Barometer-U-S-Energy-Industry-14-320.jpg)
![54%
39%
50%
43%
56%
59%
10%
20%
30%
40%
50%
60%
70%
80%
2008 2009 2010 2011 2012 2013
TRUST IN ENERGY INDUSTRY RISES PAST 2008 PRE-RECESSION LEVELS
TRUST IN ENERGY INDUSTRY – (INFORMED PUBLICS AGES 35-64) – U.S.
15 Q43-60. [TRACKING] Please indicate how much you trust businesses in each of the following industries to do what is right. Again, please use the same 9-point scale where one
means that you “do not trust them at all” and nine means that you “trust them a great deal”. (Top 4 Box, Trust) Informed Public in US](https://image.slidesharecdn.com/2013edelmantrustbarometer-usenergyindustrydeck20130530-130607151111-phpapp02/85/Edelman-Trust-Barometer-U-S-Energy-Industry-15-320.jpg)
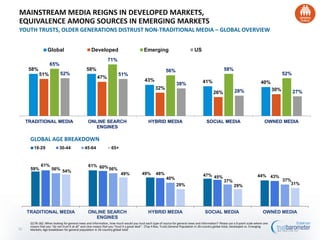
![TRUST AMONG EMERGING MARKETS HIGHER THAN TRUST AMONG
DEVELOPED MARKETS
TRUST IN ENERGY INDUSTRY BY REGION – GLOBAL OVERVIEW
53% 54%
62% 61% 61%
58%
43%
57%
53%
70%
67% 66%
61%
45%
Global US BRIC Latin America APAC North America EU
16 Q43-60. [TRACKING] Please indicate how much you trust businesses in each of the following industries to do what is right. Again, please use the same 9-point scale where one
means that you “do not trust them at all” and nine means that you “trust them a great deal”. (Top 4 Box, Trust) General Population in 26 -country global total and across APAC, BRIC,
Latin America, North America and EU region
2012 2013](https://image.slidesharecdn.com/2013edelmantrustbarometer-usenergyindustrydeck20130530-130607151111-phpapp02/85/Edelman-Trust-Barometer-U-S-Energy-Industry-16-320.jpg)
![53%
68%
74%
66% 66%
65%
68%
64%
68%
69%
56%
52%
54%
50%
54%
52%
58%
43%
38%
43%
37%
46%
30% 29% 30%
41%
57%
80% 80%
76% 76% 75%
71%
69% 69%
67%
61%
57%
55% 55%
54% 53%
52%
49%
49% 49%
47%
43%
42% 40%
37% 37% 36%
2012 2013
50%
Q43-60. [TRACKING] Please indicate how much you trust businesses in each of the following industries to do what is right. Again, please use the same 9-point scale where one means
that you “do not trust them at all” and nine means that you “trust them a great deal”. (Top 4 Box, Trust) General Population in 26 -country global total and across 26 countries
OVER THE PAST YEAR, TRUST IN THE ENERGY INDUSTRY SIGNIFICANTLY INCREASED IN
SEVERAL MARKETS WITH GREATEST INCREASES SEEN IN INDIA AND JAPAN
2012 VS. 2013 TRUST IN ENERGY INDUSTRY– 26 MARKET OVERVIEW
17
n/a
2012 US Trust in Energy :54%
2013 US Trust in Energy: 53%](https://image.slidesharecdn.com/2013edelmantrustbarometer-usenergyindustrydeck20130530-130607151111-phpapp02/85/Edelman-Trust-Barometer-U-S-Energy-Industry-17-320.jpg)
![57%
80% 80%
76% 76% 75%
71%
69% 69% 67%
61%
57%
55% 55%
54%
53% 52%
49% 49% 49%
47%
43% 42%
40%
37% 37% 36%
23%
7% 8%
13%
9%
7%
12%
16%
12%
8%
14%
23%
25% 25%
29%
26%
23%
31%
28%
21%
33%
35% 34% 34%
40% 41%
42%
Trust in Energy Industry
Distrust in Energy Industry
Q43-60. [TRACKING] Please indicate how much you trust businesses in each of the following industries to do what is right. Again, please use the same 9-point scale where one means
that you “do not trust them at all” and nine means that you “trust them a great deal”. (Top 4 Box, Trust and Bottom 4 Box, Distrust) General Population in 26 -country global total and
across 26 countries
TRUST HIGHER THAN DISTRUST IN MAJORITY OF MARKETS;
DISTRUST HIGHEST IN UK, GERMANY AND AUSTRALIA
TRUST IN ENERGY INDUSTRY VS. DISTRUST IN ENERGY INDUSTRY – 26 MARKET OVERVIEW
18
US Trust in Energy: 53%
US Distrust in Energy: 26%](https://image.slidesharecdn.com/2013edelmantrustbarometer-usenergyindustrydeck20130530-130607151111-phpapp02/85/Edelman-Trust-Barometer-U-S-Energy-Industry-18-320.jpg)
![53%
65%
54% 53%
35%
Energy Industry Renewables Natural Gas Utilities Oil
Q61C-64C. [SPLIT SAMPLE] Now thinking about specific sectors within the energy industry, please indicate how much you trust businesses in each of the following sectors to do what
is right. Again, please use the same 9-point scale where one means that you “do not trust them at all” and nine means that you “trust them a great deal”. General Population in US
TRUSTED AMONG ENERGY SECTORS –
RENEWABLES MOST TRUSTED; OIL LEAST TRUSTED
TRUST IN ENERGY INDUSTRY SECTORS – U.S.
19](https://image.slidesharecdn.com/2013edelmantrustbarometer-usenergyindustrydeck20130530-130607151111-phpapp02/85/Edelman-Trust-Barometer-U-S-Energy-Industry-19-320.jpg)
![68%
84% 84%
79% 77% 76% 76% 75%
73%72% 71% 71% 70% 70%
68%68% 65%
65% 64% 64%
61% 60% 59% 59% 57%
55% 53%
50%
20
TRUST IN ENERGY INDUSTRY SECTORS – RENEWABLES
IN ALL 26 COUNTRIES SURVEYED, OVER HALF TRUST THE RENEWABLES
SECTOR
Q61C-64C. [SPLIT SAMPLE] Now thinking about specific sectors within the energy industry, please indicate how much you trust businesses in each of the following sectors to do what
is right. Again, please use the same 9-point scale where one means that you “do not trust them at all” and nine means that you “trust them a great deal”. General Population in 26 -
country global total and across 26 countries
U.S. Trust in Renewables: 65%](https://image.slidesharecdn.com/2013edelmantrustbarometer-usenergyindustrydeck20130530-130607151111-phpapp02/85/Edelman-Trust-Barometer-U-S-Energy-Industry-20-320.jpg)
![58%
85%
80%
74% 72% 72% 71% 70% 70%
65% 65%
60%
56%55% 54% 53% 53% 53%
49%
47% 46% 45% 45%
43% 43%
37% 37%
50%
21
TRUST IN ENERGY SECTORS – NATURAL GAS
CHINA AND INDIA MOST TRUSTING OF THE NATURAL GAS SECTOR; TRUST
LOWEST IN GERMANY AND IRELAND
Q61C-64C. [SPLIT SAMPLE] Now thinking about specific sectors within the energy industry, please indicate how much you trust businesses in each of the following sectors to do what
is right. Again, please use the same 9-point scale where one means that you “do not trust them at all” and nine means that you “trust them a great deal”. General Population in 26 -
country global total and across 26 countries
U.S. Trust in Natural Gas: 54%](https://image.slidesharecdn.com/2013edelmantrustbarometer-usenergyindustrydeck20130530-130607151111-phpapp02/85/Edelman-Trust-Barometer-U-S-Energy-Industry-21-320.jpg)
![49%
77% 77%
74% 73% 72%
69% 69%
66%
62%
52%
49%
47%
42% 41%
39% 37%
35%
35%
33% 33% 33%
30% 30% 30% 29% 28%
50%
22
TRUST IN ENERGY SECTORS – OIL
COUNTRIES CLEARLY DIVIDED OVER TRUST IN THE OIL SECTOR; TRUST HIGHEST IN
EMERGING AND ASIAN MARKETS ONCE AGAIN
Q61C-64C. [SPLIT SAMPLE] Now thinking about specific sectors within the energy industry, please indicate how much you trust businesses in each of the following sectors to do what
is right. Again, please use the same 9-point scale where one means that you “do not trust them at all” and nine means that you “trust them a great deal”. General Population in 26 -
country global total and across 26 countries
U.S. Trust in Oil: 35%](https://image.slidesharecdn.com/2013edelmantrustbarometer-usenergyindustrydeck20130530-130607151111-phpapp02/85/Edelman-Trust-Barometer-U-S-Energy-Industry-22-320.jpg)
![53%
78%
75%
74% 73%
69% 69% 68% 68%
64%
57%
54% 54%53% 53%
50% 47%
40% 40% 40% 40% 39% 38%
36% 36% 35%
18%
50%
23
TRUST IN ENERGY INDUSTRY SECTORS – UTILITIES
EMERGING MARKETS TEND TO BE MOST TRUSTING OF THE UTILITIES SECTOR;
RUSSIA OUTLIER WITH ONLY ONE IN FIVE RUSSIANS TRUSTING THE SECTOR
Q61C-64C. [SPLIT SAMPLE] Now thinking about specific sectors within the energy industry, please indicate how much you trust businesses in each of the following sectors to do what
is right. Again, please use the same 9-point scale where one means that you “do not trust them at all” and nine means that you “trust them a great deal”. General Population in 26 -
country global total and across 26 countries
U.S. Trust in Utilities: 53%](https://image.slidesharecdn.com/2013edelmantrustbarometer-usenergyindustrydeck20130530-130607151111-phpapp02/85/Edelman-Trust-Barometer-U-S-Energy-Industry-23-320.jpg)

![28
40%
27%
29%
25%
39%
36%
41%
35%
27%
38%
27%
49%
23%
33%
40%
31%
38%
44%
45%
46%
54%
54%
55%
57%
65%
66%
69%
70%
71%
73%
74%
76%
PARTNERS WITH NGOS, GOVERNMENT AND THIRD PARTIES TO ADDRESS SOCIETAL
ISSUES
IS AN INNOVATOR OF NEW PRODUCTS, SERVICES OR IDEAS
RANKS ON A GLOBAL LIST OF TOP COMPANIES, SUCH AS 'BEST COMPANIES TO
WORK FOR' OR 'MOST ADMIRED COMPANIES'
WORKS TO PROTECT AND IMPROVE THE ENVIRONMENT
DELIVERS CONSISTENT FINANCIAL RETURNS TO INVESTORS
HAS HIGHLY-REGARDED AND WIDELY ADMIRED TOP LEADERSHIP
CREATES PROGRAMS THAT POSITIVELY IMPACT THE LOCAL COMMUNITY IN WHICH
THE COMPANY OPERATES
ADDRESSES SOCIETY'S NEEDS IN ITS EVERYDAY BUSINESS
HAS TRANSPARENT AND OPEN BUSINESS PRACTICES
OFFERS HIGH QUALITY PRODUCTS OR SERVICES
COMMUNICATES FREQUENTLY AND HONESTLY ON THE STATE OF ITS BUSINESS
TREATS EMPLOYEES WELL
TAKES RESPONSIBLE ACTIONS TO ADDRESS AN ISSUE OR A CRISIS
PLACES CUSTOMERS AHEAD OF PROFITS
LISTENS TO CUSTOMER NEEDS AND FEEDBACK
HAS ETHICAL BUSINESS PRACTICES -45
-34
-40
-48
-21
-42
-28
-38
-22
-14
-18
-15
-21
-16
-17
+2
Q70-85/Q86-101. Please think about businesses in the Energy Industry. How important is each of the following actions to building your trust in businesses in the Energy Industry?
Please use a nine-point scale where one means that action is 'not at all important to building your trust' and nine means it is 'extremely important to building your trust'. [Top 2
Box, Trust - Very Important (8-9)], General Population, Global 25-Country Total (Excludes Don’t Know) ;Q114-Q129. Please rate [INSERT COMPANY] on how well you think they
are performing on each of the following attributes. Use a nine-point scale where one means they are performing “extremely poorly” and nine means they are performing
“extremely well”. (Top 2 Box, Performing Very/ Extremely Well) General Population in US
*Importance attribute data used here is from the 2012 Trust Barometer
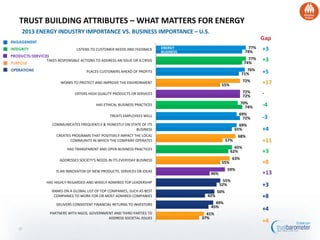
2012 ENERGY INDUSTRY IMPORTANCE VS. 2013 BLINDED ENERGY COMPANY PERFORMANCE – US (FOR ILLUSTRATION PURPOSES)
Gap
Importance
Performance
TRUST BUILDING ATTRIBUTES – LARGE GAP IN EXPECTATION VS. PERFORMANCE](https://image.slidesharecdn.com/2013edelmantrustbarometer-usenergyindustrydeck20130530-130607151111-phpapp02/85/Edelman-Trust-Barometer-U-S-Energy-Industry-28-320.jpg)
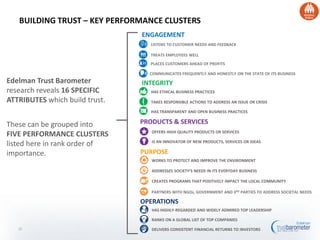
![29
PRODUCTS
& SERVICES
ENGAGEMENT
INTEGRITY
PURPOSE
OPERATIONS
Trust-Building
Opportunity Quadrant
PRIORITIZING CLUSTERS BY IMPACT POTENTIAL
Q114-Q129. Please rate [INSERT COMPANY] on how well you think they are performing on each of the following attributes. Use a nine-point scale where one means they are
performing “extremely poorly” and nine means they are performing “extremely well”. (Top 2 Box, Performing Very/ Extremely Well) General Population in 26-country
global total
*Energy importance attributes data was asked in the 2012 Trust Barometer
INTEGRITY
UNDER-PERFORMING ON HIGH PRIORITIES PERFORMING
Quality
Society
Communicates
Customers
PERCEIVED PERFORMANCE
STATEDIMPORTANCE
LOW PERFORMANCE ON LOWER EXPECTATIONS OVER-PERFORMING ON LOWER PRIORITIES
ENGAGEMENT
PRODUCTS & SERVICES
PURPOSE
OPERATIONS
2012 ENERGY IMPORTANCE VS. BLINDED ENERGY COMPANY PERFORMANCE (FOR ILLUSTRATION PURPOSES)](https://image.slidesharecdn.com/2013edelmantrustbarometer-usenergyindustrydeck20130530-130607151111-phpapp02/85/Edelman-Trust-Barometer-U-S-Energy-Industry-29-320.jpg)
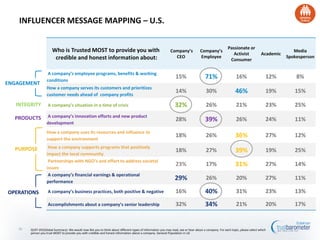
![TRUSTED SOURCES ARE EXPERTS AND PEERS
CREDIBLE SPOKESPEOPLE – U.S.
29%
37%
50%
52%
61%
66%
68%
67%
31%
34%
47%
58%
62%
68%
71%
74%
Government official or regulator
CEO
Financial or industry analyst
NGO representative
Regular employee
A technical expert
A person like yourself
Academic or expert
2012
Q130-143. [TRACKING] Below is a list of people. In general, when forming an opinion of a company, if you heard information about a company from each person, how
credible would the information be--extremely credible, very credible, somewhat credible, or not credible at all? (Top 2 Box, Very/ Extremely Credible) Informed publics
ages 25-64 in US, General Population US33](https://image.slidesharecdn.com/2013edelmantrustbarometer-usenergyindustrydeck20130530-130607151111-phpapp02/85/Edelman-Trust-Barometer-U-S-Energy-Industry-33-320.jpg)
![74%
69%
63%
56%
54%
52%
43%
41%
24%
21%
69%
66%
57%
57%
48%
49%
39%
30%
17%
16%
Academic or expert
Technical expert in the company
A person like yourself
Regular employee
NGO representative
Financial or industry analyst
CEO
Government official or regulator
Blogger
Entertainer/athlete
TRUSTED SOURCES ARE EXPERTS AND PEERS
CREDIBLE SPOKESPEOPLE – U.S.
2013
Q130-143. [TRACKING] Below is a list of people. In general, when forming an opinion of a company, if you heard information about a company from each person, how
credible would the information be--extremely credible, very credible, somewhat credible, or not credible at all? (Top 2 Box, Very/ Extremely Credible) Informed publics
ages 25-64 in US, General Population US34](https://image.slidesharecdn.com/2013edelmantrustbarometer-usenergyindustrydeck20130530-130607151111-phpapp02/85/Edelman-Trust-Barometer-U-S-Energy-Industry-34-320.jpg)
![66% 66% 67%
74% 74%
25%
19%
31%
34% 34%
43%
62%
45%
40%
32%
71%
63%
25% 26%
32%
28%
31%
41%
45%
34%
32%
23%
62%
56%
10%
20%
30%
40%
50%
60%
70%
80%
2008 2009 2010 2011 2012 2013
An academic or expert on company issues CEO
A person like yourself Government official/regulator
Regular employee
TRUSTED SPOKESPEOPLE SOLIDIFYING RANK ORDER
CREDIBILITY OF SPOKESPEOPLE – U.S. INFORMED PUBLICS AGES 35-64
Q130-143. [TRACKING] Below is a list of people. In general, when forming an opinion of a company, if you heard information about a company from each person, how credible
would the information be--extremely credible, very credible, somewhat credible, or not credible at all? (Top 2 Box, Very/ Extremely Credible) Informed publics ages 35-64 in US
35](https://image.slidesharecdn.com/2013edelmantrustbarometer-usenergyindustrydeck20130530-130607151111-phpapp02/85/Edelman-Trust-Barometer-U-S-Energy-Industry-35-320.jpg)
![50%
Q130-143. [TRACKING] (Credibility of CEOs and Government officials/regulators) Below is a list of people. In general, when forming an opinion of a company, if you heard
information about a company from each person, how credible would the information be--extremely credible, very credible, somewhat credible, or not credible at all? (Top 2 Box,
Very/ Extremely Credible) Informed publics ages 25-64 in 26 -country global total and across 26 markets (only spokespeople tracked from 2012 to 2013 included in analysis)
2013 CREDIBILITY OF CEOS VS. GOVERNMENT OFFICIALS/REGULATORS – 26 MARKET OVERVIEW
Government official or
regulator Credibility
CEO Credibility
37
MAJORITY OF MARKETS FIND BOTH GOVERNMENT AND BUSINESS LEADERS
BELOW 50% IN THEIR CREDIBILITY RATING
45%
52%
70%
55%
52%
73%
41%
52%
34%
36%
62%
55%
42%
22%
37%
39%
43%
27% 28%
56%
37%
34%
54%
26%
40%
35%
48%
38%
18%
36%
22%
32%
54%
23%
35%
22% 25%
54%
48%
35%
15%
31%
36%
41%
25%
27%
55%
37% 36%
56%
32%
47%
45%
60%
US CEO Credibility: 43%
US Gov’t Official/Regulator Credibility: 41%](https://image.slidesharecdn.com/2013edelmantrustbarometer-usenergyindustrydeck20130530-130607151111-phpapp02/85/Edelman-Trust-Barometer-U-S-Energy-Industry-37-320.jpg)
![14%
24%
13% 15%
SOLVE SOCIAL OR SOCIETAL
ISSUES
CORRECT ISSUES WITHIN
INDUSTRIES THAT ARE
EXPERIENCING PROBLEMS
MAKE ETHICAL AND MORAL
DECISIONS
TELL YOU THE TRUTH,
REGARDLESS OF HOW COMPLEX
OR UNPOPULAR IT IS
TRUST IN BUSINESS AND GOVERNMENT – A CRISIS OF LEADERSHIP
US TRUST BUSINESS AND GOVERNMENT LEADERS TO DO THE FOLLOWING:
13% 13% 11% 10%
SOLVE SOCIAL OR SOCIETAL
ISSUES
CORRECT ISSUES WITHIN
INDUSTRIES THAT ARE
EXPERIENCING PROBLEMS
MAKE ETHICAL AND MORAL
DECISIONS
TELL YOU THE TRUTH,
REGARDLESS OF HOW COMPLEX
OR UNPOPULAR IT IS
GOVERNMENT LEADERS
38
BUSINESS LEADERS
Q144A-147A. [SPLIT SAMPLE] How much do you trust business leaders to do the following? (Top Box- Trust A great Deal) General
population in US](https://image.slidesharecdn.com/2013edelmantrustbarometer-usenergyindustrydeck20130530-130607151111-phpapp02/85/Edelman-Trust-Barometer-U-S-Energy-Industry-38-320.jpg)
![6%
7%
20%
20%
45%
LACK OF REGULATION OR CONTROL
TRANSPARENCY ISSUES
WRONG INCENTIVES DRIVING POLICIES
CORRUPTION OR FRAUD
POOR PERFORMANCE/ INCOMPETENCE
4%
10%
11%
35%
36%
TRANSPARENCY ISSUES
POOR PERFORMANCE/
INCOMPETENCE
LACK OF REGULATION OR CONTROL
CORRUPTION OR FRAUD
WRONG INCENTIVES DRIVING
BUSINESS DECISIONS
CORRUPTION/FRAUD IS A KEY REASON FOR DISTRUST IN BUSINESS AND GOVERNMENT,
INCOMPETENCE IS A LEADING FACTOR FOR GOVERNMENT – U.S.
REASONS FOR DECREASED BUSINESS AND GOVERNMENT TRUST
(AMONG THOSE WHO REPORTED TRUSTING BUSINESS OR GOVERNMENT LESS OVER THE PAST YEAR)
Q22. [ASK IF TRUST GOVERNMENTLESS IN Q18] Which of the following is the main reason why your trust in government decreased over the last year?; Q24. [ASK IF TRUST BUSINESS
LESS IN Q20] Which of the following is the main reason why your trust in business decreased over the last year? General Population in US
REASONS FOR TRUSTING
GOVERNMENT LESS
REASONS FOR TRUSTING
BUSINESS LESS
71% 65%
39](https://image.slidesharecdn.com/2013edelmantrustbarometer-usenergyindustrydeck20130530-130607151111-phpapp02/85/Edelman-Trust-Barometer-U-S-Energy-Industry-39-320.jpg)
![TRUST AMONG EMERGING MARKETS HIGHER THAN TRUST AMONG
DEVELOPED MARKETS
TRUST IN ENERGY INDUSTRY BY REGION – GLOBAL OVERVIEW
53%
56%
67% 65% 63%
60%
42%
59% 59%
74%
64%
69%
64%
49%
Global US BRIC Latin America APAC North America EU
47 Q43-60. [TRACKING] Please indicate how much you trust businesses in each of the following industries to do what is right. Again, please use the same 9-point scale where one
means that you “do not trust them at all” and nine means that you “trust them a great deal”. (Top 4 Box, Trust) Informed Public in 26 -country global total and across APAC, BRIC,
Latin America, North America and EU region
2012 2013](https://image.slidesharecdn.com/2013edelmantrustbarometer-usenergyindustrydeck20130530-130607151111-phpapp02/85/Edelman-Trust-Barometer-U-S-Energy-Industry-47-320.jpg)
![53%
78%
76%
72% 71%
67%
76%
67% 66%
71%
59%
56%
51%
47%
56%
51%
65%
45%
29%
39%
37%
49%
31% 31%
24%
52%
59%
86%
84%
75%
84%
81%
69% 71% 70%
72%
66%
45%
57% 56%
55%
59%
47%
60%
53%
49% 48%
54%
45% 45%
38% 38%
33%
2012 2013
50%
Q43-60. [TRACKING] Please indicate how much you trust businesses in each of the following industries to do what is right. Again, please use the same 9-point scale where one means
that you “do not trust them at all” and nine means that you “trust them a great deal”. (Top 4 Box, Trust) Informed Publlic in 26 -country global total and across 26 countries
OVER THE PAST YEAR, TRUST IN THE ENERGY INDUSTRY SIGNIFICANTLY INCREASED IN
SEVERAL MARKETS WITH GREATEST INCREASES SEEN IN JAPAN AND POLAND
2012 VS. 2013 TRUST IN ENERGY INDUSTRY– 26 MARKET OVERVIEW
48
n/a
2012 US Trust in Energy :56%
2013 US Trust in Energy: 59%](https://image.slidesharecdn.com/2013edelmantrustbarometer-usenergyindustrydeck20130530-130607151111-phpapp02/85/Edelman-Trust-Barometer-U-S-Energy-Industry-48-320.jpg)
![TRUSTED SOURCES ARE EXPERTS AND PEERS
CREDIBLE SPOKESPEOPLE – U.S.
Q130-143. [TRACKING] Below is a list of people. In general, when forming an opinion of a company, if you heard information about a company from each person, how
credible would the information be--extremely credible, very credible, somewhat credible, or not credible at all? (Top 2 Box, Very/ Extremely Credible) General Population
in US
51
2012 2013
29%
37%
50%
52%
61%
66%
67%
68%
Government official or regulator
CEO
Financial or industry analyst
NGO representative
Regular employee
A technical expert
An academic or expert
A person like yourself 69%
66%
57%
57%
49%
48%
39%
30%
Academic or expert
Technical expert
A person like yourself
Regular employee
Financial or industry
analyst
NGO representative
CEO
Government official or
regulator](https://image.slidesharecdn.com/2013edelmantrustbarometer-usenergyindustrydeck20130530-130607151111-phpapp02/85/Edelman-Trust-Barometer-U-S-Energy-Industry-51-320.jpg)
![74%
69%
63%
56%
54%
52%
43%
41%
Academic or expert
Technical expert in the
company
A person like yourself
Regular employee
NGO representative
Financial or industry
analyst
CEO
Government official or
regulator
TRUSTED SOURCES ARE EXPERTS AND PEERS
CREDIBLE SPOKESPEOPLE – U.S.
31%
34%
47%
58%
62%
68%
71%
74%
Government official or regulator
CEO
Financial or industry analyst
NGO representative
Regular employee
A technical expert
A person like yourself
Academic or expert
20132012
Q130-143. [TRACKING] Below is a list of people. In general, when forming an opinion of a company, if you heard information about a company from each person, how
credible would the information be--extremely credible, very credible, somewhat credible, or not credible at all? (Top 2 Box, Very/ Extremely Credible) Informed publics
ages 25-64 in US52](https://image.slidesharecdn.com/2013edelmantrustbarometer-usenergyindustrydeck20130530-130607151111-phpapp02/85/Edelman-Trust-Barometer-U-S-Energy-Industry-52-320.jpg)
![Q43-60. [TRACKING] Please indicate how much you trust businesses in each of the following industries to do what is right. Again, please use the same 9-point scale
where one means that you “do not trust them at all” and nine means that you “trust them a great deal”. (Top 4 Box, Trust) General Population in US
70%
67%
64%
62%
61%
61%
60%
57%
57%
55%
54%
53%
53%
48%
44%
43%
43%
38%
Technology
Consumer Electronics…
Food and Beverage
Brewing and Spirits
Aerospace & Defense
Automotive
Consumer Packaged Goods
Food Manufacturing
Metals Industry
Telecommunications
Consumer Health Companies
Energy
Entertainment
Pharmaceuticals
Chemicals
Banks
Financial Services
Media
TIED WITH THE ENTERTAINMENT INDUSTRY THIS YEAR, TRUST IN THE
ENERGY INDUSTRY RANKS NEAR THE BOTTOM
TRUST IN INDUSTRIES – U.S.
53
20132012
78%
70%
64%
60%
59%
58%
54%
51%
42%
41%
40%
Technology
Food & Beverage
Consumer Packaged
Goods
Automotive
Brewing & Spirits
Telecommunications
Energy
Pharmaceuticals
Banks
Financial Services
Media
Technology #1 in US](https://image.slidesharecdn.com/2013edelmantrustbarometer-usenergyindustrydeck20130530-130607151111-phpapp02/85/Edelman-Trust-Barometer-U-S-Energy-Industry-53-320.jpg)
![Technology #1 in US
SLIGHT UPTICKS IN MANY SCORES, INCLUDING ENERGY
TRUST IN INDUSTRIES – U.S.
20132012
Q43-60. [TRACKING] Please indicate how much you trust businesses in each of the following industries to do what is right. Again, please use the same 9-point scale where one
means that you “do not trust them at all” and nine means that you “trust them a great deal”. (Top 4 Box, Trust) Informed Public ages 25-64 in US
54
80%
76%
75%
72%
71%
70%
70%
70%
69%
66%
64%
62%
59%
55%
55%
52%
50%
50%
Technology
Consumer electronics manufacturing
Brewing and spirits
Food and beverage4
Aerospace and defense
Metals industry
Automotive
Consumer packaged goods3
Food manufacturing
Telecommunications
Consumer health companies
Entertainment
Energy
Pharmaceuticals
Chemicals
Financial services
Banks
Media
41%
46%
48%
56%
56%
64%
66%
71%
74%
74%
83%
Banks
Financial services
Media
Energy
Pharmaceuticals
Telecommunications
Automotive
Brewing and spirits
Consumer packaged
goods
Food and beverage
Technology](https://image.slidesharecdn.com/2013edelmantrustbarometer-usenergyindustrydeck20130530-130607151111-phpapp02/85/Edelman-Trust-Barometer-U-S-Energy-Industry-54-320.jpg)

Edelman's 13th annual survey examines trust in the U.S. energy industry, revealing that trust levels have shifted back to neutral after a previously high distrust. The survey, based on responses from over 31,000 people across 26 countries, highlights that while overall trust in the energy industry is at 53%, it exceeds trust in business overall (50%) and demonstrates notable regional differences. Additionally, it indicates that trust varies significantly between informed publics and the general population, with informed publics generally exhibiting greater trust levels.


![Ahmed_SAMIR_cv[1-1]](https://cdn.slidesharecdn.com/ss_thumbnails/14ec18c4-848e-482b-b259-ca1b2434eac8-160221044027-thumbnail.jpg?width=640&height=640&fit=bounds)


