Download to read offline


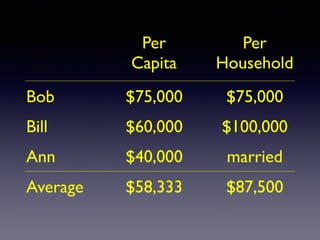


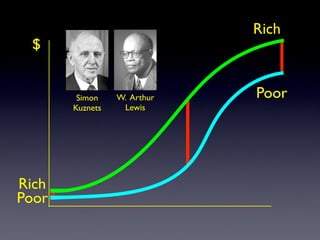
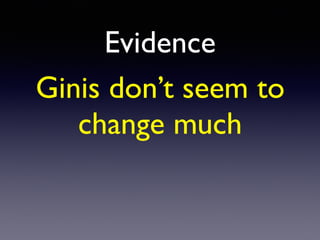
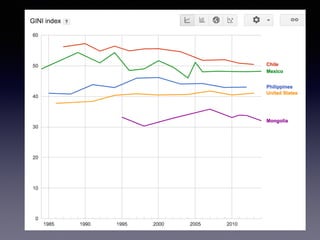

This document discusses economic inequality and related concepts. It compares income and consumption inequality between individuals and across countries. It introduces the Lorenz curve and Gini coefficient as tools to measure inequality, with the Gini ranging from 0 representing perfect equality to 1 representing perfect inequality. It also references theories about the relationship between economic growth and inequality over time according to Simon Kuznets and W. Arthur Lewis.


