Here are two key points about the industrial sector in India on the eve of independence:
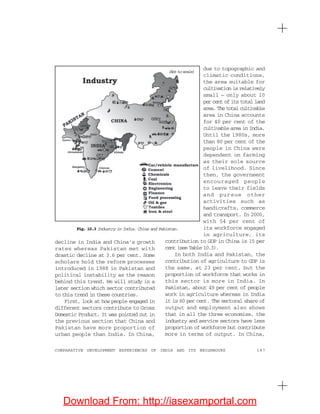
1. The colonial government pursued policies that systematically de-industrialized India's traditional handicraft industries and did not allow the development of a modern industrial base. This was done to reduce India to a supplier of raw materials for British industries and a market for their finished goods.
2. Modern industry began emerging in the late 19th century mainly in cotton and jute textiles, as well as iron and steel in the early 20th century. However, industrial growth was very slow and the sector contributed little to GDP. Capital goods industries were also lacking. The public sector was limited mainly to railways and power. Overall, India had not developed