1. INDIAN ECONOMYON
THE EVE OF
INDEPENDENCE
a. Agriculture sector during
Independence:-
Zamindari system(First
implemented in Bengal presidency)
Irrigation facilities
Commercialization of Agriculture
Lack of investments
Small and fragmented lands
b. Decay of handicrafts:-
1. Discriminatory tarrif policy
2. Competition from machine made
products
3. Disappearance of princely courts
4. Introduction of railways
c. Slow growth of Modern
Industries:-
Iron and steel industry set
up(TISC0-1907)
Lack of capital goods
industries
Participation of
government in
limited area.
Less contribution in GDP
d. India’s foreign trade:-
Britain maintained a monopoly control over India s
‟
exports and imports.
The opening of Suez Canal(1869) further intensified
British
control over India s
‟ foreign trade.
More than 50% of India s
‟ foreign trade was restricted
to Britain while the remaining was allowed with few
other
countries like china, Ceylon and Persia.
Introduction:- Main concentration of
British was to change the economic policy
of the country. India became exporter of raw
material and importer of finished goods.
GDP was less than 2% whereas Per capita
income was 0.5% only.
India s
‟ most accurate national income was
estimated by V.K.R.V.Rao.
e. Demographic condition:-(first census-1881)
1. Demographic transition (second stage of
demographic transition began after 1921)
2. Literacy level was below 16%
3. Health facilities were not available
to everyone.
4. Infant mortality rate was 218 per
thousand.
5. Life expectancy was also low-44
years
f. Infrastructure development:-
All weather roads were built.
British introduced railways in 1850.
Developed modern system of
communication.
First stamp was released in
1852.
INDIAN ECONOMIC
DEVELOPMENT
d.1. Drain of Wealth:-
1.Earned huge export surplus by
selling commodities such as food
grains, kerosene but their supply in
domestic market reduced.
2.Export surplus did not result
in inflow of gold and silver
rather it
was used to meet expenditure of
Britain government. Expenses
such
2.
2. INDIAN ECONOMY1950-1990
Development
strategy
Mixed Economy
Model
Five year plan
Mahalnobis is known as architect of planning. In 1950
planning commission was set up. First five year plan
was launched on 1 april 1950 ending 31 march 1956.
Goal of Five year plans:-
1. Growth (increase in GDP by
producing goods and services.)
2. Modernization(Adoption of new
technology & change in social
outlook)
3. Equity(Benefits of growth
should be available to everyone)
4. Self- reliance (avoiding import
of those goods which can be
produced by India)
Policies adopted during
planning period (1950-1990)
a. Agriculture problems
1. Lack of irrigation
2. Poor relation between landlord and
cultivator
3. Land revenue system
4. Old methods of farming
5. Lack of organized marketing system
b. Agricultural policy:-
A. Land reforms or Institutional reforms:-
a. Abolition of Zamindari system
b. Fixation of rent
c.Promote equity in agriculture sector (by
giving equal lands)
B. Green revolution:- use of HYV seeds(wheat&rice),
chemical fertilizers, pesticides, modern machines etc.
C. Technology was provided to farmers at subsidized
rates.
c. Industrial sector (problems)
(i)Lack of capital
goods industries
(ii) Regional imbalance
(iii)Limited
role of government.
d. Industrial sector policy:- (IPR-1956)
Categorizing industries into three parts:- A.
17 industries-government; B-12 industries
both private and public(owner);C-rest can be
opened by private only.
Obtain license for industries and given
concession to set up industries in backward
areas.
e. Small scale industries(KARVE
committee-1955) to promote industries in
villages.
f. Foreign trade:- (Problems)
(i) Reduce foreign dependence
(ii) Encourage domestic production
(iii) Import of essential products
g. Inward looking trade strategy:- (Import
substitution)
(iv)Production of goods in India to
reduce imports.
(v)Main purpose was to save foreign
currency and achieve self sufficiency
(vi) Protection of imports :- Tariffs(charging
high tax on import) and Quota (limited
quantity
that can be imported)
Conclusion:-
(i)Agriculture sector ignored and get
adversely affected.
(ii)Inefficient functioning of public sector which
result into huge losses.
(iii) Increase in poverty
(iv)Promotion of small scale industries to
encourage industries.
(v) Increase in National income
3.
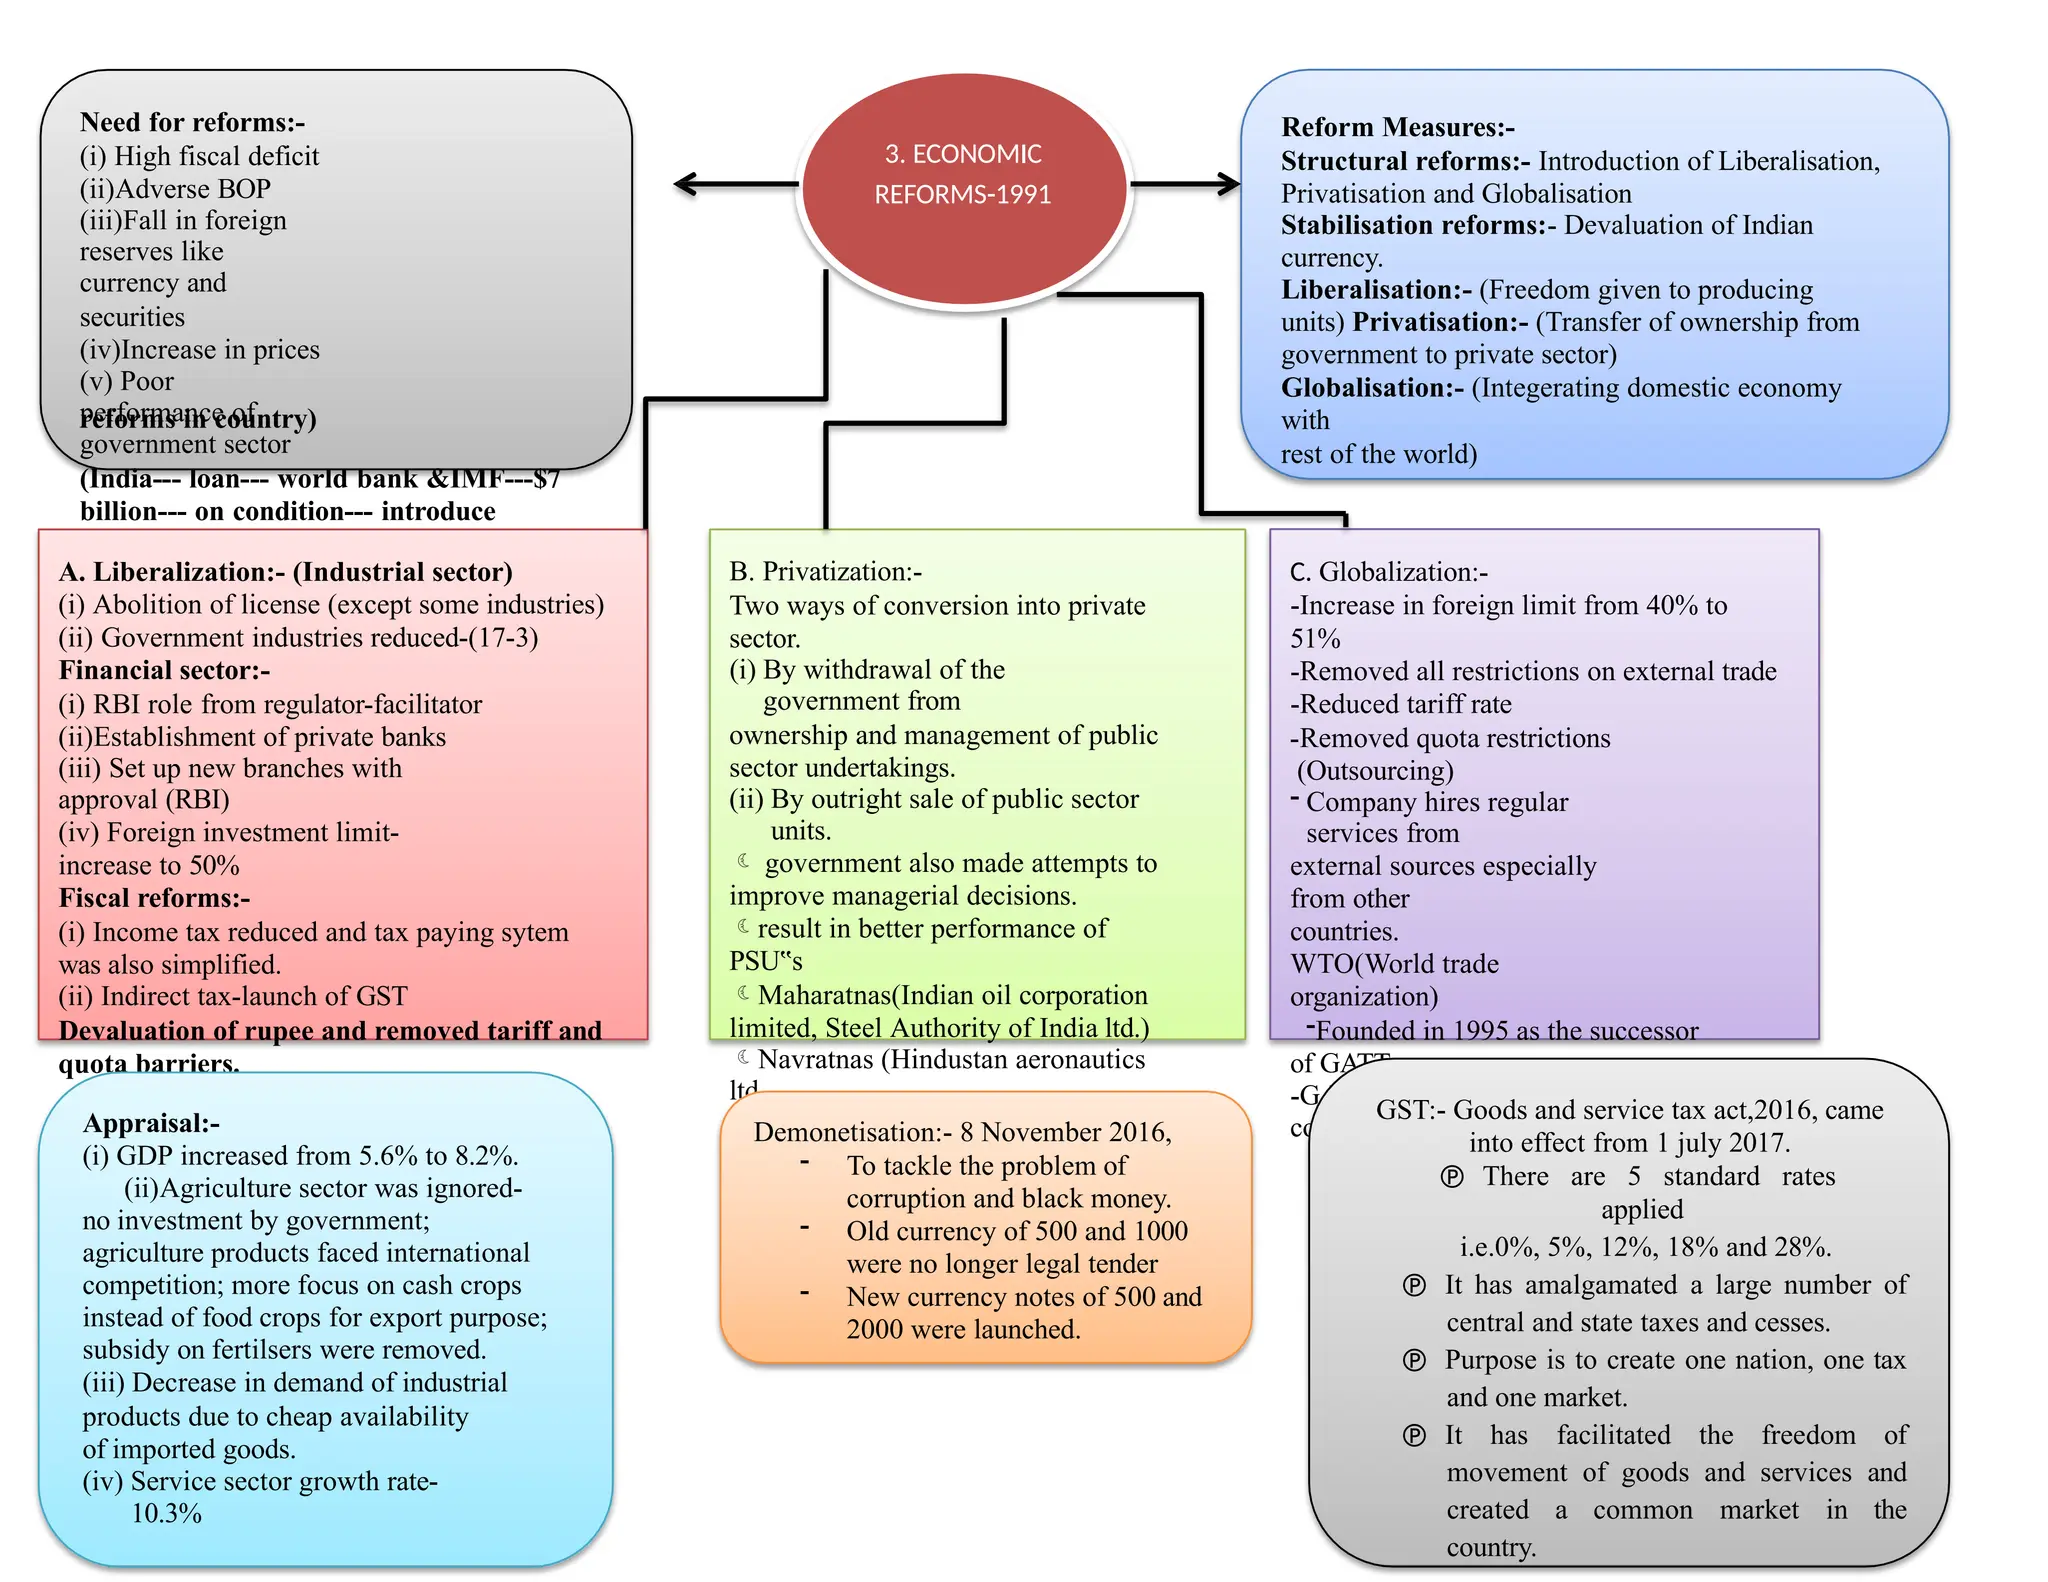
3. ECONOMIC
REFORMS-1991
Need forreforms:-
(i) High fiscal deficit
(ii)Adverse BOP
(iii)Fall in foreign
reserves like
currency and
securities
(iv)Increase in prices
(v) Poor
performance of
government sector
(India--- loan--- world bank &IMF---$7
billion--- on condition--- introduce
reforms in country)
Reform Measures:-
Structural reforms:- Introduction of Liberalisation,
Privatisation and Globalisation
Stabilisation reforms:- Devaluation of Indian
currency.
Liberalisation:- (Freedom given to producing
units) Privatisation:- (Transfer of ownership from
government to private sector)
Globalisation:- (Integerating domestic economy
with
rest of the world)
A. Liberalization:- (Industrial sector)
(i) Abolition of license (except some industries)
(ii) Government industries reduced-(17-3)
Financial sector:-
(i) RBI role from regulator-facilitator
(ii)Establishment of private banks
(iii) Set up new branches with
approval (RBI)
(iv) Foreign investment limit-
increase to 50%
Fiscal reforms:-
(i) Income tax reduced and tax paying sytem
was also simplified.
(ii) Indirect tax-launch of GST
Devaluation of rupee and removed tariff and
quota barriers.
B. Privatization:-
Two ways of conversion into private
sector.
(i) By withdrawal of the
government from
ownership and management of public
sector undertakings.
(ii) By outright sale of public sector
units.
government also made attempts to
improve managerial decisions.
result in better performance of
PSU s
‟
Maharatnas(Indian oil corporation
limited, Steel Authority of India ltd.)
Navratnas (Hindustan aeronautics
ltd.,
Mahanagar telephone nigam ltd)
C. Globalization:-
-Increase in foreign limit from 40% to
51%
-Removed all restrictions on external trade
-Reduced tariff rate
-Removed quota restrictions
(Outsourcing)
- Company hires regular
services from
external sources especially
from other
countries.
WTO(World trade
organization)
-Founded in 1995 as the successor
of GATT
-GATT founded in 1948 with 23
countries.
Appraisal:-
(i) GDP increased from 5.6% to 8.2%.
(ii)Agriculture sector was ignored-
no investment by government;
agriculture products faced international
competition; more focus on cash crops
instead of food crops for export purpose;
subsidy on fertilsers were removed.
(iii) Decrease in demand of industrial
products due to cheap availability
of imported goods.
(iv) Service sector growth rate-
10.3%
Demonetisation:- 8 November 2016,
- To tackle the problem of
corruption and black money.
- Old currency of 500 and 1000
were no longer legal tender
- New currency notes of 500 and
2000 were launched.
GST:- Goods and service tax act,2016, came
into effect from 1 july 2017.
There are 5 standard rates
applied
i.e.0%, 5%, 12%, 18% and 28%.
It has amalgamated a large number of
central and state taxes and cesses.
Purpose is to create one nation, one tax
and one market.
It has facilitated the freedom of
movement of goods and services and
created a common market in the
country.
4.
4. POVERTY:- Individualis unable to
meet its basic needs.(food, clothing,
housing, education and health)
Who are poor?
-Live in kutcha hutments
-Do not even get two
meals a day
-Unstable
employment
Beggers
Push cart
vendors
Street
cobblers
Landless
labours
Types of poverty
Relative Poverty:-
Poverty in relation
to income,
countries etc.
Absolute
poverty:-
Individual is
unable to meet
its basic needs.
Poverty Line:- Cut-off point
which divide people of a region
as poor and non-poor.
Monthly per capita
expenditure:-
Estimation on the
basis of calories
intake. Rural-2435;
Urban-2045.
Income method:-
Estimation on the
basis of income
earned. Rural:-816;
Urban:-1000
Dadabhai naroji was the first person to
discuss the concept of poverty. He
discussed it on the basis of jail cost of
living. Amartya sen also developed sen
index to measure poverty. (Head count
ratio:- %age of population below poverty
line.)
Kinds of poor:-
Chronic Poor
Always poor
Non-poor
Never poor
Casual poor
Transient poor
Churning poor(move
in & out of poverty)
Occasionally poor
(mostly rich)
Causes of poverty:-
(i)Exploitation of British Raj
caused poverty.
(ii) Less fertile lands to small
farmers.
(iii) Lack of job opportunities
(iv)Inequalities in the
distribution of income and wealth.
(v) A steep rise in the price of food
grains
caused poverty.
(vi)High growth of population
Three-dimensional
approach to poverty
B. Employment generation Programme:-
(i) Food for work-1970
(ii) Swarnajayanti gram sawrojgar yojana-
April,1999
(iii) National rural livelihood-2012
(iv)Sampoorna grameen rojgar yojana-
Sep, 2001
(v) Pardhan Mantri gramodya yojana-2001
(vi) MGNREGA-August,2005
A. Growth-oriented approach:-
Based on expectation that
increased GDP and per capita will
be distributed to everyone and will
remove poverty.
Critical evaluation:- Gap between
poor and rich increased.
C. Providing Minimum basic amenities through
public expenditure:-
(i) Public Distribution System
(ii) Integerated Child Development
(iii) Mid day meal scheme
(iv)Pradhan mantra sadak yojana, valmiki
awas yojana-Infrastructure
(iv) National social assistance programme
(vi) Pradhan mantri jan dhan yojana (2014)
Poverty alleviation programme-Criticism
(i)Unequal distribution of land and assets
benefitted non poor.
(ii) Resources were not sufficient.
(iii) Improper implementation and wastage of
resources granted by government to remove
poverty.
5.
5. Human CapitalFormation:-
Implies the addition to the stock of
abilities and skills among the
population of the country
Sources of Human capital formation:-
(i)Expenditure on Education-
(increases the efficiency and skill of
human capital)
(ii)Expenditure on health- (directly
increases the physical and mental
ability
of human beings)
(iii)On the job training-(Training
required to enhance skills and expertise
of human capital)
(iv)Expenditure on migration-
(movement from rural to urban area
in
search of job)
(v)Expenditure on
information- (expenses made to
acquire market information)
Importance:-
(i) High productivity-(productivity of
physical capital increased with the help
of human capital)
(ii) Innovative skills-(well-educated
and
trained personnel will provide new and
innovative ideas for development)
(iii)Equality-(helps in increasing
employment opportunities and provide
equality in the country)
(iv) Improvement in quality of life-
(quality of life improves due to quality
education, health etc.)
Problems:-
(i) Rising population-(less chance of
availing all the opportunities due to
increased population.)
(ii)Brain-drain-(educated and skilled
manpower moves to another countries)
(iii)Deficient manpower planning-
(imbalance between demand and
supply of human resources)
(iv)Insufficient training-(proper
training is not provided properly)
(v) Low academic standards-
(educational facilities not as per the
requirement of development)
Two independent reports on Indian economy:-
(i)Deutsche Bank, a German bank in its report on „Global Growth
Centers‟ identified that India will emerge as one among four major growth
centres in the world by the year 2020.
(ii) With reference to India it states, “Between 2005 and 2020 we expect a
40% rise in the average years of education in India.
(iii)World Bank, in its recent report, „India and the knowledge
Economy- Leveraging strengths and opportunities ,
‟ states that India should
make a transition to the knowledge economy and if it uses its knowledge as
much as Ireland does then the per capita income of India will increase from
US$1000 IN 2002 to US$3000 in 2020.
(iv) It further states that the Indian economy has all the key ingredients for
making this transition such as, a critical mass of skilled workers, a
well- functioning democracy and diversified
6.
6. Rural Development:-Helps in
formulating action plan for the development
of rural area to ensure overall development.
Challenges of Rural development:-
Lingering challenges
Agriculture marketing
Lingering challenges:- It is a
challenge refers to the credit for
farmers in rural areas to invest.
CREDIT
TYPES OF
CREDIT
SOURCES
OF CREDIT
Short Term
Credit:- Loan
ranges
between 6-12
months.
Medium Term
Credit:- Loan
ranges between
12 mths to 5 yrs
Long term
credit:- Loan
ranges 5-20
years.
Institutional
sources:- Sources
by legal authority
like banks etc.
Non-Institutional
sources:-
Traditional
sources of rural
credit who charge
high rate of
interest.
(i)Cooperative credit
societies:- credit to the
farmers at reasonable rate of
interest. (ii)RRBs &land
development bank:-credit is
granted against mortgage
(iii)SBI:- setup in 1955.
Focus on rural credit.
(iv)NABARD:- setup in
1982. Provide credit to the
credit institutions.
Self-help groups:- Promotes saving
habits by contribution from each
member. It helped in the
empowerment of women.
Kudumbashree-Kerala-1955
Rural Banking –Critical Evaluation
(i)Credit facility by keeping security which
create problem for small and poor farmers.
(ii) Relaxed recovery of loans- Bank may fall in
problem.
(iii)Farming families –failed to save money
–less deposit in commercial banks.
7.
7. Employment:- Allthose
persons who are engaged in
some work depending upon
their capacity.
A. Participation of people in
employment:-
2011-12:- 473 million workforce.
Rural workers: - 3/4th
of 473 million
70% workers are men.
B. Workforce participation
rate:-Percentage of population
that is actively contributing to
the production of goods and
services of a country.
C. Worker population ratio:-
Total
Men 54.4
Women 21.9
Rural Urban
54.3 54.6
24.8 14.7
-In rural area more people
participate in work as compare to
urban because they have to support
their family.
-Urban people look job as per their
skills.
-More women participate in rural
as compare to urban because in
urban men earn high income so
they discourage female to take up
job.
D. Distribution of workforce:- (Different
sectors)-46% employed in primary sector.
-21.8% employed in secondary sector.
-32% employed in service sector.
Gender:- Male:- primary (45%),
secondary
(19%), tertiary(25%)
Female:-primary (57%), secondary(15%),
tertiary(19%).
E. Growth and changing structure of employment:-
Two main developmental indicators:-
Growth of employment and Growth of GDP:-GDP of
India was higher
(1950-2010) than employment growth.
It shows that GDP increases through technology which shows “Jobless
growth”. It is a situation when the economy is able to produce more
goods and services without increase in employment.
F. Informalisation of Indian workforce:-
It is the situation where percentage of workforce in
formal sector declines and in informal sector rises.
Formal sector:- The sector which employs 10 or more
workers and workers enjoy all the social security benefits
is formal sector.
Informal sector:- The sector which hires less than
10 workers and workers do not enjoy any social
security
benefits. For eg:- Farmers, labours etc.
Types of Unemployment
Rural unemployment:-
Disguised unemployment ( -
employed more workers than
actually required)
Seasonal unemployment(-
Farmers are unemployed in
off-season)
Urban unemployment:-
Industrial unemployment ( who
wants to work in industries but
do not get work)
Educated unemployment (having
educational degree but still
unable to find work)
Causes of unemployment:-
(i) Slow economic growth
(ii) Rapid growth of population
(iii) Agriculture- A seasonal occupation
(iv) Joint family system
(v) Decay of cottage and small industries
(vi) Low savings and investments
Suggestions to solve the problem of
unemployment:-
(i) Increase in production of goods
and
services
(ii) High rate of capital formation
(iii)Financial assistance to
self employed persons
(iv) Labour intensive
technique instead
of capital intensive technique.
Direct generation of employment
opportunities:-
(i) The government employs
people in various
departments for administrative
purpose.
(ii) It also run industries, hotels and
transport companies and hence provide
employment directly to workers.
Indirect generation of employment
opportunities:-
(i) when the output of goods and services from
government enterprises increases, then private
enterprises which receive raw material from
government sector also raise their output and
so as employment.
8.
8. Infrastructure:- Itincludes
basic element of economics and
social aspects which provide
support to the production activity.
Types of Infrastructure:-
(i)Economic
Infrastructure:- It provide
support to the process of
economic development. For
eg:- Energy, Transport etc.
(ii)Social
Infrastructure:- It provide
support to the process
of social development. For
eg:-
Health services
Infrastructure and development:-
(i) Promotes productivity(providing
various sources of energy, irrigation
facilities etc)
(ii) Induces Investment (Good
infrastructure promotes investment
for development)
(iii)Ability to work(Health services
will
enhace capacity to work)
(iv)Linkages in
production(Economic infrastructure
and social infrastructure works in
coordination)
State of infrastructure in India:-
Public private partnership in Infrastructure
development:- Now-a-days private sector has started
playing important role in development of
infrastructure. Private sector jointly works with
public sector.
Rural infrastructure:- 56% rural household have
electricity; 20% have access to sanitation . There
is
urgent need to improve rural infrastructure in
India.
Health Services-Social
infrastructure
Health care system in India:-
Tier-I PHC,CHC & sub
centres:- Small hospitals set
up in small areas manage by
doctors. They educate people
about health care.
Tier-II Secondary healthcare
institutions:- These are set up
in big cities and have facilities
for surgery.
Tier-III Tertiary health care
centres:- These are fully
equipped medical centres. It
also undertake research
facilities.
State of Health infrastructure-India
Public Health
Infrastructure:-
Government has
responsibility to
guide and regulate
health services.
During 1951-2017
the number of govt.
hospital and
dispensaries
increased to 51300.
Private health
infrastructure:-
More than 70 %
hospitals are private.
In 2001-02,13 lakh
medical enterprises
employed 22 lakh
people. Some private
practitioners are not
even registered
doctors
known as:-
ISM:- Indian
system of
medicines: It
include six sytems:-
Ayurveda, Yogs,
Unani, Siddha,
Naturopathy and
homeopathy.
AYUSH hospital:-
3943.
Women’s Health:-
-Women suffer many
disadvantages as compared to
men in the areas of education,
activities and health care.
-The decrease in the child sex
ratio from 927 in 2001 to 914 in
2011shows increase in female
foeticide.
-Approx.3,00,000 girls aged
below 15 years are not only
married but already have children.
-More than 50% of married
women in the age group of 15-49
years suffer from anaemia.
Health as an emerging challenge:-
(i) Unequal distribution of health care centre
(ii)Poor management of hospitals
(iii) Private health services are expensive.
(iv)Maintenance of public health care
centres is very poor.
Suggestions to improve health care system:-
(i)Reduce gap between urban and rural health
care system.
(ii) Accessibility and Affordability of basic health
care
9.
CH-12 ENVIRONMENT ANDSUSTAINABLE
DEVELOPMENT
Environment
Significance of
Environment:-
(i) Supply
Resources:-
Provide resources such as
renewable and non-
renewable resources.
(ii)Sustains life:-
Provides basic elements for
survival.
(iii) Assimilates waste:- It
absorb wastes generated by
entire population.
(iv)Enhances
quality of life:- Element
which improve quality of
life.
Current Environmental
crisis:-
Opportunity cost of
negative
environmental impacts is
high.
-- Many resources become
extinct and wastes are beyond
absorptive capacity of
environment.
-- Huge amount of money to be
spend by government to explore
new resources.
--Expenditure on health
increases due to pollution.
-- Huge expenditure to be
incurred on issues such as ozone
depletion etc.
Supply-demand reversal:-
(i) In early days , demand was
less as compare to supply of
resources. It means pollution
was not much and waste
generation was within
absorptive capacity of
environment.
(ii) But with population
explosion, demand was more
than supply of resources which
created huge environmental
problem.
(iv) Waste generation was also
beyond the absorptive capacity
of environment.
State of India’s Environment:-
--The black soil of the Deccan
Plateau is suitable for cultivation
of cotton helping textile
industries.
-- The Indo-Gagnetic plains---
spread from the Arabian sea to
the Bay of Bengal is most fertile
land.
--India s
‟ forests provide green
cover to its population and natural
wildlife.
--20% of world s
‟ total iron ore
reserves is in India.
Challenges to India’s
Environment:-
(i) Land
degradation(declin
e in
fertility of land and
soil)
(ii)Soil erosion(loss of upper
layer of soil)
(iii) Deforestation:- (decrease in
forest area)
(iv)Pollution:- (CPCB
identified 17 industries as most
polluted)
Sustainable development
It refers to development strategy
to meet the needs of present
generation without
compromising the needs of
future generation.
Strategies for sustainable
development:-
(i) Solar Energy:- India
can produce
solar energy with the help of sunlight
and photovoltaic cells helps in
conversion of electricity.
(ii)Wind power:- Wind turbines
move with wind and electricity is
generated.
(iii) Mini-hydel plants:- Use the
energy of streams to move small
turbines.
(iv)Organic farming:- Focus on
soil health and prevents water
pollution.
(v) LPG, Gobar gas:- It is a clean
fuel which prevents pollution.
10.
India, China &Pakistan-
Comparison
A. Growth Strategy-India,
China & Pakistan:-
(i) India and Pakistan
became independent in
1947; People s
‟ Republic of
China-1949
(ii) Five year plans-
India(1951); China(1953);
Pakistan:- (1956)
(iii)Till 1980 s
‟ all the
country were at same pace as
per GDP and per capita
income.
B. Growth story of China:-
People s
‟ Republic:- All enterprises brought
under government control.
Great leap forward campaign-1958(To boost up
industrialization in country)
1958:- Commune system started( People
collectively
cultivated land) 26000 communes were made.
Great Proletarian cultural revolution:- 1965, by Mao
(students and professionals were sent to work and learn
from country side.)
1978:- Economic reforms initiated in two phase
(Initial:- Focused on agriculture, Lateral phase:-
Focused on
industries and dual pricing)
C. Growth story of Pakistan:-
--Followed Mixed economy
model.
1988- Economic reforms
were
initiated due to which
economic situations were
affected adversely.
--Growing dependence on
foreign loan.
--Unable to earn foreign
currency through exports.
Economic development indicators
Salient Demographic Indicators:-
--China has the highest population followed
by India. . If we look at the global
population, out of every six persons in the
world one is Indian and another is Chinese.
--The population growth is highest in
Pakistan followed by India and China. --
Major reason for low population growth in
China was „One Child Policy‟ norm
initiated in late 1970 s.
‟
--Sex ratio is low in all the three countries.
Preference for sons, in all these countries
is the reason for low sex ratio.
--The fertility rate is also low in China and
very high in Pakistan.
--Urbanization is high in China with India
having 33% of its people living in urban
areas
GDP growth rate:-
--China has the second largest GDP of $
19.8 trillion whereas India and
Pakistan s
‟ GDP is $8.07 and $0.97
trillion.
--When many countries were finding it
difficult to maintain a growth rate of even
5%, China was able to maintain near
double
digit growth rate for one decade.
--In the 1980 s,
‟ Pakistan was ahead of
India, China was having double-digit
growth and India was at the bottom.
--In 2011-15, there has been a decline
in
China s
‟ growth rates whereas, Pakistan met
with drastic decline at 4%.
--Some scholars hold economic reforms
in 1988 and political instability
responsible behind the trend.
Sectoral contribution towards GDP:-
--Share of agriculture sector:- In China, the
contribution of agriculture to GDP was 9% in
2015-17, in India it was 17% and in Pakistan, it
was 25%.
--Share of Manufacturing and service sector:- In
China, manufacturing and service sectors
contribute the highest to GDP at 43% and 48%
respectively whereas in India and Pakistan, it is
the service sector which contributes the highest.
Sectoral share of employment:-
--In China, only 17.5% of the workforce was
engaged in agriculture in 2015-17.
--In Pakistan, 42 % of people work in
agriculture
sector whereas in India it is 42.7%
--In all three countries workforce in Industry
and Services sectors is less.
--In China, workforce in service sector is high as
compared to India and Pakistan.