SlideShare a Scribd company logo
1 of 57
ECO 480 Econometrics I
Problem Set 5
Due: Monday, November 30, 2015 (beginning of the class)
1
Instruction: The problem sets are designed to be difficult and
very time-intensive, so plan ahead. The
problem sets consists of solving theoretical problems and
analyzing real data. You may discuss the
questions with your classmates, but you are required to hand in
your own independently written solutions,
do-files, and log-files. No late work will be accepted and I do
NOT accept any electronic copy. All the
data necessary for the problem set is available under UBlearns.
Important: It is extremely important to write a clean well-
commented program for transparency and
replication purposes. In any empirical work, you should always
be able to reproduce your result from raw
data to support your claim.
What to hand in: Typed write-up answering the assigned
questions and interpreting your findings, do-file,
and log-file (you MUST use Stata). For questions involving data
analysis, you will NOT get any credit if
you do not provide a program code. You may NOT use Excel.
1. How are returns on common stocks in overseas markets
related to returns in U.S. markets? Consider
measuring U.S. returns by the annual rate of returns on the
Standard & Poor’s (S&P) 500 stock index
and overseas returns by the annual rate of returns on the Morgan
Stanley Europe, Australia, Asia, Far
East (EAFE) index. Both are recorded in percent. Regressing
the EAFE returns on the S&P 500
returns for the 20 years 1989 to 2008. Here is part of the output
for this regression:
The regression equation is EAFE = -2.58 + 0.775 S&P
Analysis of Variance
Source df SS MS
Model 4560.6
Residual
Total 19 8556.0
a. Complete the analysis of variance table by filling in the
missing entries. Show (Justify) how you
came up with that answer.
b. What are the values of the regression standard error and the
R2?
c. Find the standard error for the least-squares slope. Show your
work.
d. If I tell you that the standard deviation of the S&P 500
returns for these years is 19.99%. How
would you use this information to find the standard error for the
least-squares slope you found in
part c?
e. Give a 95% confidence interval for the slope β1 of the
population regression line. Show your
work.
ECO 480 Econometrics I
Problem Set 5
Due: Monday, November 30, 2015 (beginning of the class)
2
2. An electronic survey of 7,061 players of Guitar Hero and
Rock Band reported that 67% of those who
do not currently play a musical instrument said that they are
likely to begin playing a real musical
instrument in the next two years. The reports describing the
survey do not give the number of
respondents who do not currently play a musical instrument.
a. Explain why it is important to know the number of
respondents who do not currently play a
musical instrument.
b. Assume that half of the respondents do not currently play a
musical instrument. Find the count of
players who said that they are likely to begin playing a real
musical instrument in the next two
years.
c. Give a 99% confidence interval for the population proportion
who would say that they are likely
to begin playing real musical instrument in the next two years.
d. How would the result that you reported in part (c) change if
only 25% of the respondents said that
they do not currently play a musical instrument?
e. Do the same calculations if 75% of the respondents said that
they do not currently play a musical
instrument?
f. The main conclusion of the survey that appeared in many
news stories was that 67% of players of
Guitar Hero and Rock Band who do not currently play a musical
instrument said that they are
likely to begin playing a real musical instrument in the next two
years. What can you conclude
about the effect of the three scenarios [part c, d, and e] on the
margin of error for the main result?
3. The average undergraduate GPA for American colleges and
universities was estimated based on a
sample of institutions that published this information. Here are
the data for public schools in that
report:
Year 1992 1996 2002 2007
GPA 2.85 2.90 2.97 3.01
a. Find the equation of the least-squares regression line by hand
or with a calculator for predicting
GPA from year. Show your work.
b. Verify your results with a software package. Show the output.
c. Compute a 95% confidence interval for the slope by hand and
interpret what this interval tells you
about the increase in GPA over time. Show your work.
ECO 480 Econometrics I
Problem Set 5
Due: Monday, November 30, 2015 (beginning of the class)
3
4. A study that evaluated the effects of a reduction in exposure
to traffic-related air pollutants compared
respiratory symptoms of 283 residents of an area with congested
streets with 165 residents in a
similar area where the congestion was removed because a
bypass was constructed. The symptoms of
the residents of both areas were evaluated at baseline and again
a year after the bypass was
completed. For the residents of the congested streets, 17
reported that their symptoms of wheezing
improved between baseline and one year later, while 35 of the
residents of the bypass streets reported
improvement.
a. Find the two sample proportions.
b. Report the difference in the proportions and the standard
error of the difference.
c. What are the appropriate null and alternative hypotheses for
examining the question of interest?
Be sure to explain your choice of the alternative hypothesis.
d. Find the test statistic. Construct a sketch of the distribution
of the test statistic under the
assumption that the null hypothesis is true. Find the P-value and
use your sketch to explain its
meaning.
e. Is no evidence of an effect the same as evidence that there is
no effect? Use a 95% confidence
interval to answer this question. Summarize your ideas in a way
that could be understood by
someone who has very little experience with statistics.
5. According to literature on brand loyalty, consumers who are
loyal to a brand are likely to consistently
select the same product. This type of consistency could come
from a positive childhood association.
To examine brand loyalty among fans of the Chicago Cubs, 371
Cubs fans among patrons of a
restaurant located in Wrigleyville were surveyed prior to a game
at Wrigley Field, the Cubs’ home
field. The respondents were classified as “die-hard fans” or
“less loyal fans.” Of the 134 die-hard
fans, 90.3% reported that they had watched or listened to cubs
games when they were children.
Among the 237 less loyal fans, 67.9% said that they had
watched or listened as children.
a. Find the numbers of die-hard Cubs fans who watched or
listened to games when they were
children. Do the same for the less loyal fans.
b. Use a significance test to compare the die-hard fans with the
less loyal fans with respect to their
childhood experiences relative to the team.
c. Express the results with a 95% confidence interval for the
difference in proportions.
ECO 480 Econometrics I
Problem Set 5
Due: Monday, November 30, 2015 (beginning of the class)
4
6. In a survey of 1430 undergraduate students, 1087 reported
that they had one or more credit cards.
Give a 95% confidence interval for the proportion of all college
students who have at least one credit
card.
7. The summary of the surveyed described in the question #6
reported that 43% of undergraduates
reported that they had four or more credit cards.
a. Give a 95% confidence interval for the proportion of all
college students who have four or more
credit cards.
b. Would a 99% confidence interval be wider or narrower than
the one that you found in part a?
Verify your results by computing the interval.
c. Would a 90% confidence interval be wider or narrower than
the one that you found in part a?
Verify your results by computing the interval.
8. Use the data in WAGE2.dta to estimate a simple regression
explaining monthly salary(wage) in terms
of IQ score (IQ).
a. Find the average salary and average IQ in the sample. What is
the sample standard deviation of
IQ? (IQ scores are standardized so that the average in the
population is 100 with a standard
deviation equal to 15.)
b. Estimate a simple regression model where a one-point
increase in IQ changes wage by a constant
dollar amount. Use this model to find the predicted increase in
wage for an increase in IQ of 15
points. Does IQ explain most of the variation in wage? ? Is the
coefficient statistically
significantly different from zero at the 1% level?
c. Now, estimate a model where each one-point increase in IQ
has the same percentage effect on
wage. If IQ increases by 15 points, what is the approximate
percentage increase in predicted
wage? Use the 95% confidence interval to conclude whether the
coefficient statistically
significantly different from zero at the 5% level and explain.
9. Use MEAP93.dta to explore the relationship between the
math pass rate (math10) and spending per
student (expend). math10 denote the percentage of tenth graders
at a high school receiving a passing
score on a standardized mathematics exam. Suppose we wish to
estimate the effect of spending per
student (expend) on student performance. If anything, we expect
the spending per student to have a
positive ceteris paribus (i.e., all other factors being equal)
effect on performance because money can
go toward purchasing more books and computers, hiring better
qualified teachers, implementing nicer
facilities, and so on.
a. Do you think each additional dollar spent has the same effect
on the pass rate, or does a
diminishing effect seem more appropriate? Explain.
ECO 480 Econometrics I
Problem Set 5
Due: Monday, November 30, 2015 (beginning of the class)
5
b. In the population model math10 = β0 + β1log(expend) + u,
argue that β1/10 is the percentage point
change in math10 given a 10% increase in expend.
c. Use the data in MEAP93.RAW to estimate the model from
part (b). Report the estimated
equation in the usual way, including the standard error, sample
size and R-squared.
d. Is the effect statistically significant at the 10, 5, and 5%
level? Explain.
e. Interpret the coefficient and the R-squared.
f. How big is the estimated spending effect? Namely, if
spending increases by 10%, what is the
estimated percentage point increase in math10?
g. One might worry that regression analysis can produce fitted
values for math10 that are greater
than 100. Why is this not much of a worry in this data set?
[Hint: What is the largest value of
math10?]
Passenger and Cell Phone Conversations in Simulated Driving
Frank A. Drews, Monisha Pasupathi, and David L. Strayer
University of Utah
This study examines how conversing with passengers in a
vehicle differs from conversing on a cell phone
while driving. We compared how well drivers were able to deal
with the demands of driving when
conversing on a cell phone, conversing with a passenger, and
when driving without any distraction. In
the conversation conditions, participants were instructed to
converse with a friend about past experiences
in which their life was threatened. The results show that the
number of driving errors was highest in the
cell phone condition; in passenger conversations more
references were made to traffic, and the production
rate of the driver and the complexity of speech of both
interlocutors dropped in response to an increase
in the demand of the traffic. The results indicate that passenger
conversations differ from cell phone
conversations because the surrounding traffic not only becomes
a topic of the conversation, helping
driver and passenger to share situation awareness, but the
driving condition also has a direct influence
on the complexity of the conversation, thereby mitigating the
potential negative effects of a conversation
on driving.
Keywords: shared attention, driver distraction, cell phone
conversation, passenger conversation
Driving is a complex perceptual and cognitive task. There is
ample evidence that driving performance is negatively affected
by
simultaneously conversing on a cell phone. Previous studies
found
that cell phone use impairs the driving performance of younger
(Alm & Nilsson, 1995; Briem & Hedman, 1995; Brookhuis, De
Vries, & De Waard, 1991; Brown, Tickner, & Simmonds, 1969;
Goodman et al., 1999; McKnight & McKnight, 1993;
Redelmeier
& Tibshirani, 1997; Strayer, Drews, & Johnston, 2003; Strayer
&
Johnston, 2001), and older drivers (Alm & Nilsson, 1995;
Strayer
et al., 2003). These impairments have been studied using a wide
range of methodological paradigms including computer-based
tracking tasks (Strayer & Johnston, 2001), high-fidelity
simulation
(Strayer et al., 2003), driving of vehicles on a closed circuit
(Treffner & Barrett, 2005), on-road studies (Crudall, Bains,
Chap-
man, & Underwood, 2005), and epidemiological studies of car
crashes (McEvoy et al., 2005; Redelmeier & Tibshirani, 1997).
The level of impairment is comparable to being intoxicated at a
blood alcohol level of .08 (Strayer, Drews, & Crouch, 2006).
Considering Distracted Driving Impairment With
Greater Specificity
To understand the implications of performing a secondary task
while driving, it is useful to apply a conceptualization of the
driving task that can guide the analysis of performance deficits.
In
his task analysis of driving, Groeger (1999) described three
levels
of performance (see Michon, 1979, 1985, for similar proposals).
The first level of performance is an operational or control level,
which involves elements that serve the task of keeping a vehicle
on
a predetermined course. A deficit at this level is shown, for
example, in a reduction of lateral control, that is, the vehicle
may
drift to the side of the road. A number of studies demonstrated
that
this operational level is negatively affected by performing an
additional task like conversing on a cell phone (Alm & Nilsson,
1995; Haigney & Westerman, 2001; Stein, Parseghian, & Allen,
1987).
The second level of performance involves skills needed for
maneuvering the vehicle in traffic. This level is called tactical
behavior and examples for deficits at this level are approaching
other vehicles too closely or ignoring approaching vehicles
while
turning left at an intersection. Studies that have found deficits
on
this level of driving performance describe changes in speed
(Burns, Parkes, Burton, & Smith, 2002; Horberry, Anderson,
Regan, Triggs, & Brown, 2006), changes in acceleration
(Strayer
& Drews, 2006), and delayed reaction times (Consiglio,
Driscoll,
Witte, & Berg, 2003) when drivers are engaged in a cell phone
conversation. The characterization of driving behavior as “slug-
gish” (Strayer et al., 2003) refers to both operational and
tactical
levels of driving behavior with driving performance changing
such
that drivers drive and accelerate slower and show longer
reaction
times when braking (see Drews & Strayer, 2008; Svenson &
Patten, 2005, for reviews).
The third level involves more executive, goal-directed aspects
of
driving and reflects strategic performance (Barkley, 2004).
Exam-
ples for problems at this level are failures in the execution of
navigation tasks or trip-related planning tasks. Currently, there
is
only indirect evidence that deficits on this level can be observed
when drivers converse on a cell phone. In their simulator study
Ma
and Kaber (2005) measured situation awareness—a precondition
Frank A. Drews, Monisha Pasupathi, and David L. Strayer,
Department
of Psychology, University of Utah.
Portions of the data presented in this paper have been
previously
presented at the Annual Human Factors and Ergonomics
Conference and
been published in the proceedings to this conference (for further
reference,
see Drews, Pasupathi, & Strayer, 2004). We thank two
anonymous review-
ers for their helpful comments that significantly improved this
article.
Correspondence concerning this article should be addressed to
Frank A. Drews,
Department of Psychology, University of Utah, 380 South 1530
East, Room 502,
Salt Lake City, UT 84112. E-mail: [email protected]
Journal of Experimental Psychology: Applied Copyright 2008
by the American Psychological Association
2008, Vol. 14, No. 4, 392– 400 1076-898X/08/$12.00 DOI:
10.1037/a0013119
392
for strategic performance— of drivers conversing on a cell
phone
while driving compared to a group using an adaptive cruise
control
system. The authors found that the use of a cell phone while
driving significantly reduced driver situation awareness and sig-
nificantly increased the perceived mental workload relative to
no
phone and adaptive cruise control conditions. The application of
Groeger’s (1999) framework highlights a gap of empirical work
investigating the strategic level of performance of drivers
engaged
in a cell phone conversation. Thus, at this point it is unclear if
the
deficits observed on the operational and tactical level also
extend
to the strategic level, or if this level of performance is
unaffected
by a cell phone conversation. Based on the assumptions of
Michon
(1979, 1985), lower level deficits ought to affect higher level
performance, and we would expect the suggestive findings of
Ma
and Kaber to be evident in a task that is more representative of
typical driving.
Allocation of Attention and the Distracted Driver
Most work on driver distraction focused on the assessment of
the impairment rather than on a delineation of the cognitive
mech-
anisms underlying deficits in driving performance. The small
number of studies that has focused on this theoretically
important
question point to a reduction in attention directed toward the
driving task as partly responsible for the deficits. Strayer et al.
(2003) examined the hypothesis that the observed impairment
could be attributed to a withdrawal of attention from the visual
scene resulting in a form of inattention blindness (i.e., a fixated
object is not being processed resulting in either an incomplete
or
no mental representation of the object). Their findings indicated
that cell phone conversations impaired both implicit and
explicit
recognition memory of visual information even when
participants
had fixated upon it. Strayer et al. suggested that the impairment
of
driving performance resulting from cell phone conversations is
mediated, at least in part, by reduced attention to visual inputs
in
the driving environment. More evidence was presented recently
by
Strayer and Drews (2007) demonstrating a reduction in the
ampli-
tude of the P300 as a result of a cell phone conversation in
response to the onset of braking lights of a car that had to be
followed. The P300 component of event-related brain potentials
(ERP) is sensitive to the attention that is allocated to a task
(Sirevaag, Kramer, Coles, & Donchin, 1989), and has been
shown
to allow discrimination between levels of task difficulty,
decreas-
ing as the task demand increases (Kramer, Sirevaag, & Braun,
1987). Finally, more evidence for deficits in allocation of
attention
comes from investigations of scanning behavior of traffic
scenes.
McCarley et al. (2004) showed that conversations result in
higher
error rates for change detection and higher numbers of saccades
to
locate a changing item. The authors also found reduced fixation
times under dual-task conditions and interpret this as evidence
that
a conversation while scanning traffic scenes impacts the
peripheral
guidance of attention.
To summarize, the allocation of attention to the driving task is
central to the issues related to driving performance deficits ob-
served in the context of cell phone use. Thus, the literature
appears
to suggest that nearly any task that diverts attention away from
the
driving task will cause impairment. Indeed, supporting this
asser-
tion are epidemiological studies (see McEvoy et al., 2005; Re-
delmeier & Tibshirani, 1997) that indicate that the relative risk
of
being in a motor vehicle accident quadruples when a driver con-
verses on a cell phone (i.e., odds ratio of an accident when
conversing on a cell phone is 4.2). By contrast, other epidemio-
logical studies (Rueda-Domingo et al., 2004; see also Vollrath,
Meilinger & Krüger, 2002) have found a strikingly different
pat-
tern for situations in which an adult passenger is in the vehicle.
In
particular, when drivers have a passenger in the vehicle, the
relative risk of a motor vehicle accident is lower than when the
driver drives by him or her self (i.e., the odds ratio of an
accident
with a passenger in the vehicle is 0.7). Given that in many
instances the passenger and the driver are conversing, these
find-
ings appear to be at odds with the suggestion that any task that
diverts attention away from driving causes impairment. What
accounts for the seemingly paradoxical finding that a
conversation
on a cell phone interferes with driving, whereas having a
conver-
sation with a passenger in the vehicle improves driving perfor-
mance? Are differences in the allocation of attention partly
respon-
sible for these differences?
How passenger and cell phone conversations differ in their
implications for attention and driving performance is a question
of
theoretical and applied importance. It is of theoretical
importance
because a comparison between cell phone and passenger conver-
sation revolves around the similarities or differences between
the
two contexts’ impact on the attentional resources of a driver. In
this paper we suggest that the different contexts affect the
ability
to allocate attention to a task differently, that is, the allocation
of
attention is not independent of contextual variables, even if the
task at the onset seems identical. The question is also of applied
importance because it may help to understand better what
contexts
have an impact on a driver’s ability to allocate attention to the
task
of driving.
Conversing
From one vantage point a conversation is a conversation. Con-
versations require attention from their participants for
monitoring
the topic and content, coordinating turn taking, and so on
(Clark,
1996). Thus, all conversations are presumably diverting
attention
from a driving task and should create at least some impairment.
An alternative perspective, drawn from psycholinguistics, em-
phasizes conversations as joint activities that involve shared
atten-
tion from all participants, and as dynamic activities that unfold
over time (Clark, 1996). This perspective emphasizes that
partic-
ipants in a conversation move forward in the joint activity of
conversing by adding to their shared understandings of what is
being talked about. This process is called grounding (Clark &
Schaefer, 1989) and it involves establishing that all parties in a
conversation share relevant knowledge, beliefs, and
assumptions.
It also includes awareness of the current context that provides
many cues that can aid in grounding, such as shared visual
atten-
tion (Richardson, Dale, & Kirkham, 2007) and shared awareness
of distractions. The critical difference between a cell phone
con-
versation and an in-vehicle conversation revolves around this
shared awareness of the driving context. That shared awareness
leads to the prediction that in-vehicle conversation will not have
the same detrimental impact on driving performance that cell
phone conversations have. It also opens the possibility for in-
vehicle conversation to have a positive impact on driving
perfor-
mance, as is suggested by epidemiological data. Moreover, in
393CONVERSATIONS IN SIMULATED DRIVING
pointing to conversation as a joint activity unfolding over time,
it
suggests two nonexclusive proposals about how conversations
affect the allocation of the driver’s attention to the driving task.
One is simply that an in-vehicle passenger responds to the de-
mands of the driving context by reducing demand for the
conver-
sation task (e.g., by changing the production rate—a modulation
hypothesis, see Gugerty, Rakauskas, & Brooks, 2004). The
second
is that the passenger adopts the driving task as part of the
overall
joint activity in which driver and passenger are mutually
engaged.
In both cases, the assumption is that this is not likely or
possible
for a cell phone conversational partner because they do not have
direct access to the real-time driving conditions.
Another point about this perspective on conversation bears
mention, and it is that many tasks employed to simulate conver-
sation in studies of cell phone use while driving suffer from
serious
ecological validity concerns. Some investigators used putative
conversations in which the participants and a confederate alter-
nately generated a word and the other person had to generate a
word that began with the last letter of the previous spoken word
(Gugerty et al., 2004). Treffner and Barrett (2004) had
participants
perform summations or categorizations. Others identified topics
of
interest for the participant by questionnaire and had an experi-
menter converse with the participant about such topics (Strayer
et
al., 2003). These approaches are limited because they fail, to a
larger or smaller extent, to mimic the coordinated, joint activity
features of naturalistic conversations. In a meta-analysis,
Horrey
and Wickens (2006) found that more naturalistic conversations
produced greater interference with driving than did more “syn-
thetic” information processing tasks, suggesting a greater
engage-
ment for the former. Although not a central aim of this study,
we
made a serious effort to develop a conversational task that was
truly applicable to the applied context. Following Bavelas,
Coates,
and Johnson (2000), close-call stories as the topic of the
conver-
sation were used in studying the impact of conversations on
driving. Bavelas et al. defined close-call stories as stories about
times when your life was threatened. The advantage of using
such
close-call conversations is that they involve the kinds of stories
that are often told among friends and produce a conversation
that
is engaging. In addition, unlike in other studies in which at least
one of the partners of the conversation was a confederate, we
asked
participants to bring friends with the intention of having them
converse about previously untold close-call stories.
Few authors have studied how passenger conversations affect
driv-
ing performance. In their on road study, Crundall et al. (2005)
pro-
vided initial evidence that passenger and driver responded to
changes
in the cognitive demand of driving when playing a “competitive
[word] game between driver and the partner” (Crundall et al.,
2005,
p. 201) that simulated a conversation. For example, passenger
conversations were suppressed during more demanding urban
driving and there was no impact of the driving context on the
conversation during cell phone conversations. It appears as if
the cell phone task imposed a cognitive load independent of the
cognitive demand resulting from the driving conditions, making
it
likely that the driver’s cognitive limits were exceeded.
Gugerty et al. (2004) investigated the impact of passenger
conversations on driving performance in a low-fidelity driving
simulator. To simulate a conversation the authors used a word
game task in which the participants took turns saying words
with
the constraint that a new word had to begin with the last letter
of
the word spoken by the partner. Gugerty et al. tested driving
performance by assessing the driver’s situation awareness for
the
surrounding traffic but also measured performance on the verbal
task. Overall there was no evidence that passengers slowed the
verbal task more than remotely communicating participants, and
in
Experiment 1 the opposite effect was found, despite the fact that
only the passengers shared visual information about the driving
conditions. Also, the verbal interaction negatively affected
situa-
tion awareness in both the passenger and the cell phone
condition,
equally impacting a precursor for strategic performance.
More interesting, Amado and Ulupinar (2005) reported a neg-
ative impact of passenger conversation on a driving surrogate:
The
authors compared the impact of a hands-free cell phone conver-
sation, a passenger conversation, and a control condition on
atten-
tion in a peripheral detection task that simulated driving. To
simulate the cognitive demand of a conversation, the authors
asked
participants questions of low or high complexity. Both
simulated
conversation conditions had a similar negative impact on
perfor-
mance in a peripheral detection task as compared to the control
condition. The lack of a difference between the cell phone con-
versation condition and the passenger conversation condition is
notable. One potential reason for the absence of a difference is
that
in this study the conversation pace was kept constant artificially
not allowing for modulation. Moreover, the perceptual detection
task is much less complex than the driving task, indicating data
limits in this study.
The limited literature on cell phone and passenger conversa-
tions suggests that modulation (i.e., slowing) of a conversation
is possible, and may occur under natural driving conditions.
However, one of the problems of the existing studies is that the
conversations were highly scripted and often simulated only the
cognitive demand of a conversation. Driving performance
seems to be affected by passenger conversations by reduced
situation awareness and a reduction in the ability to detect
peripheral objects. It appears that there is no difference between
passenger conversations compared to remote conversations in
their negative impact on driving performance.
In the present paper we examined the impact of cell phone and
passenger conversations on driving performance, applying
Groeger’s (1999) conceptualization to guide the
operationalization
of driving. Consequently, we used measures of driving perfor-
mance that reflect the operational, the tactical, and the strategic
level of driving behavior. In addition, we examined features of
the
conversation that shed light on how conversations on cell
phones
and conversations with a passenger differ in ways that bear on
attention allocation. We hypothesize that a passenger—provided
he or she has at least minimal driving expertise—monitors the
driving environment. Consequently, when a driver faces an in-
creasing demand of the driving task, both passenger and driver
may respond by reducing the cognitive demand of the conversa-
tion. These changes can manifest themselves in switching the
topic
of the conversation to the driving conditions and the
surrounding
traffic (e.g., by pointing out potential hazards) that directs the
driver’s attention toward the surrounding traffic. Also, it is
possi-
ble that a reduction of the production rate of speech or its com-
plexity reflects a response to increases in the cognitive demand
for
the driver.
In sum, the goal of this research is to increase our
understanding
of how conversing on a cell phone while driving compares with
394 DREWS, PASUPATHI, AND STRAYER
conversing with a passenger while driving. This research uses
naturalistic conversations and measures driving performance at
the
operational, tactical, and strategic levels, and also focuses on
measures that reflect changes in the dynamics of the
conversation.
Method
Participants
Ninety six adults were recruited in a total of 48 friend dyads
and
received course credit for participation. Participants ranged in
age
from 18 to 49 with 20 being the average age. Forty-seven
partic-
ipants were women and 49 participants were men. All
participants
had normal or corrected-to-normal visual acuity, normal color
vision (Ishihara, 1993), and a valid Utah driver’s license.
Stimuli and Apparatus
A PatrolSim™ high-fidelity driving simulator, manufactured by
L3 Communications I-Sim (Salt Lake City, UT, USA) was used
in
the present study (see Figure 1). The simulated vehicle is based
on
the vehicle dynamics of a Crown Victoria® model with
automatic
transition built by the Ford Motor Company.
A freeway road database simulated a 24-mile multilane beltway
with on- and off-ramps, overpasses, and two-lane traffic in each
direction. Participants were driving under an irregular-flow
driv-
ing condition (Drews, Strayer, Uchino, & Smith, in press). The
irregular-flow driving condition can be characterized as a
situation
in which other vehicles, in compliance with traffic laws,
changed
lanes and speeds. This traffic requires the participant to pay
atten-
tion to the surrounding traffic as opposed to a situation in which
the driver can minimize the attentional requirements and the
cog-
nitive demand by driving exclusively in one lane of travel. In
addition, slow-moving vehicles were sometimes unsuccessfully
attempting to pass vehicles on the left side, significantly
slowing
down the overall traffic flow. The speed limit was 65 mph.
Visibility in all scenarios was optimal.
Procedure
After providing informed consent, participants were familiar-
ized with the driving simulator using a standardized 15-min
adap-
tation sequence. The adaptation sequence consisted of three 5-
min
driving scenarios, one being located in a rural area at night,
another
one located in a downtown area, involving some minimal
naviga-
tion around traffic barricades, and a final scenario located on a
highway with optimal driving conditions at daytime. After
famil-
iarization, one participant of a dyad was randomly selected to
drive
the vehicle, the other, based on experimental condition, was
either
the passenger or talking on the cell phone to the driver from a
different location. The assignment of speaker and listener was
counterbalanced over driver and nondriving interlocutor, and
the
speaker provided the close-call story. Participants were
instructed
to provide a story they had not shared with the partner in the
past.
In the single-task condition, the driver was instructed to drive
safely and to follow all the traffic rules. In addition, in the
dual-
task condition they were instructed that their task was having a
conversation about a close-call story with their friend who was
either seated next to them as a passenger or conversing on a cell
phone. Finally, the drivers were instructed to leave the highway
once they arrived at a rest area located approximately eight
miles
after the beginning of the drive. The passenger/cell phone inter-
locutor was instructed to participate actively in the conversation
and told that the driver had the task of leaving the highway
when
approaching a rest area. In the dual-task portion of the
experiment,
half of the driving participants were either conversing on a cell
phone or talking to a passenger while driving; in the single-task
condition, participants were driving only. The order of the
single
and dual-task conditions was counterbalanced and the
assignment
to cell phone and in-person conversation was randomized. The
individual driving sequences (single/dual task) took about 10
min
to finish. The entire experiment took approximately 60 min to
completion.
Measures
Driving performance. Multiple measures of driving perfor-
mance were taken, distinguishing between measures dealing
with
the operational level, the tactical level, and those reflecting
more
strategic processes involved in driving. A measure of the opera-
tional level was how well participants stayed in the center of the
lane without lateral movements and drifting. For this purpose,
we
defined the lane center of the road and calculated the root mean
standard error (RMSE) between center and the center position
of
the car. On the tactical level, we analyzed speed and following
distance. Speed was measured as the average speed of the driver
for the road segment they were driving until they reached the
rest
area exit, whereas following distance was measured as the
average
distance between the driver’s car and a car that was directly
ahead
of them. On the strategic level of performance we were
interested
in participants’ ability to follow the instruction of a navigation
task—more specifically— did they take the correct exit?
Conversation. The transcribed conversations between interlocu-
tors in the dual-task conditions were coded by two independent
Navigation task
0
5
10
15
20
25
enohp llecregnessap
n
u
m
b
er
o
f
p
ar
ti
ci
p
an
ts
s
u
cc
ee
d
in
g
Figure 1. Frequency of successful task completion in the
navigation task.
395CONVERSATIONS IN SIMULATED DRIVING
coders. Though the instruction for participants was for one
person
to tell a story about close calls, in all cases after a short time
both
participants were lively engaged in the conversation. The
coding of
the conversations focused on the number of references to
traffic,
intercoder-reliability Pearson’s r(47) � .92; who initiated the
reference (driver and nondriver; Cohen’s kappa(47) � 1), and
the
number of turn takes with reference to the traffic event after a
reference to traffic was made, intercoder-reliability Pearson’s
r(47) � .98. All conversations were analyzed from transcripts of
the conversations by trained coders who were blind to the
condi-
tion under which the conversation took place.
The rationale for analyzing traffic references was that referring
to the surrounding traffic is an attempt to create shared situation
awareness and indicates support for the driving task. The
number
of turn takes after a reference to traffic was made was analyzed
because it is a reflection of the willingness of both partners to
engage in a conversation about traffic rather than the close-call
story. Included in this analysis were only turn takes with state-
ments about the event that provoked the initial traffic reference.
A second analysis focused on the impact of the driving envi-
ronment. Because the impact on driving has been well
documented
in the past (e.g., Brookhuis et al., 1991) this analysis focuses on
the
impact of traffic complexity on the conversation. For this
purpose
two independent coders coded the traffic as low or moderately
demanding, intercoder-reliability Cohen’s kappa(47) � .98.
Low
demanding traffic was defined as a situation in which the partic-
ipant’s vehicle was surrounded by maximally one vehicle (either
in
front, behind, or on the left lane), in which a situation of
moder-
ately demanding traffic involved more than one other vehicle in
close proximity to the participant’s vehicle. For both types of
driving situations, the speech production rate of the driver and
the
interlocutor in syllables per second was analyzed. The
production
rate of the driver and the passenger in this context reflects the
degree to which the cognitive demand imposed by the traffic
context has an impact on the conversation, potentially leading
to
some modulation of the conversation (see Berthold, 1998;
Müller,
Gro�mann-Hutter, Jameson, Rummer, & Wittig, 2001). As an
additional measure, the number of syllables per word for the
driver
and the interlocutor was analyzed. The number of syllables per
word is thought to measure the complexity of an utterance
(Berthold, 1998). Production rate and complexity of utterance
are
used to test the hypothesis that both conversation partners in the
passenger condition adjust their conversation in response to
changes in the cognitive demand of the traffic imposed on the
driver, reflecting implicit collaboration on the driving task (see
Crundall et al., 2005). Due to the lack of situation awareness of
the
interlocutor on a cell phone, modulation is unlikely in the cell
phone condition.
Design
The design of the study was a between-subject design with
dual-task condition (cell phone vs. passenger conversation) as a
between-subjects factor. Each participant’s driving performance
was also assessed in the single-task condition (driving only). To
control for any between-subject variability we analyzed driving
behavior using the difference scores between single- and dual-
task
performance for each participant.
Results
Driving Performance
The following analyses of driving performance include data
from 41 dyads (21 passenger conversation) due to technical
prob-
lems with data collection in the driving simulator.
Counterbalanc-
ing of the task order for both conditions was not affected by this
data loss, because these dyads had identical task sequences. All
of
the following driving performance analyses that compare the
cell
phone and passenger conversation use difference scores between
the single- and dual-task condition for each participant, thus re-
flecting the difference in impact of the two dual-task
conditions.
The use of difference scores was indicated because the initial
analyses revealed some minor differences in single-task driving
performance between groups (see Table 1). Analyses of the de-
mographic variables revealed that the average age of driving
participants in the cell phone condition was 19.6 years (range
18 to
23) and in the passenger condition was 20.1 years (range 18 to
26).
In the cell phone condition, 10 female and 10 male drivers
partic-
ipated, whereas in the passenger conversation condition, 11
female
and 10 male drivers participated. Thus, it is possible that the
initial
differences in driving performance as reported in Table 1 can be
attributed to slight differences in driving experience.
Operational level of driving performance. The first analysis
focused on the drivers’ ability to stay in the center of the lane
without drifting sideways. Focusing on the RMSE between
actual
vehicle position and center of the lane, we analyzed the
differences
between cell phone and passenger conversation condition using
a
Table 1
Means and Standard Deviations for Lane Keeping, Driving
Speed, and Distance for Both
Experimental Conditions and Single and Dual Task
Passenger Cell phone
Single task Dual task Single task Dual task
M (SD) M (SD) M (SD) M (SD)
Lane keeping (RMSE) 0.4 (0.8) 0.4 (1.0) 0.5 (0.5) 1.0 (0.9)
Mean speed (mph) 63.8 (4.2) 63.9 (3.8) 65.8 (3.5) 65.9 (3.7)
Mean distance (meters) 72.3 (27.4) 62.1 (21.0) 63.9 (17.8) 85.3
(47.0)
Note. RMSE � root mean standard error; mph � miles per hour.
396 DREWS, PASUPATHI, AND STRAYER
t test. The analysis revealed a significant difference between
con-
ditions, t(39) � �2.1, p � .05, Cohen’s d � 0.7, with drivers
showing a more pronounced tendency to drift during cell phone
conversations compared to the passenger conversation condition
(see Table 1).
Tactical level of driving performance. We used a t test iden-
tical to the one described above to analyze the differences for
average speed. The analyses revealed no changes in driving
speed,
t(39) � .1 in both conditions (see Table 1).
The next analysis focused on the distance drivers kept between
their own vehicle and vehicles ahead of them. The t test
revealed
a significant difference between the two conditions, t(39) � 2.4,
p � .05, Cohen’s d � 0.8, with following distance being greater
in
the cell phone condition (see Table 1).
Strategic level of driving performance: Navigation. The last
part of the analysis of driving performance focused on behavior
on
the strategic level (i.e., successfully accomplishing the driving
task
by exiting the highway at the rest area). Figure 2 shows the
number
of participants who finished the task successfully. Analyzing
task
completion for cell phone conversation and passenger conversa-
tion condition revealed a difference between the two conditions,
�2(1, N � 40) � 7.9, p � .05, w � 0.6: drivers in the cell
phone
condition were four times more likely to fail task completion
than
drivers in the passenger condition.
Conversation
References to traffic and turn taking. The transcripts of the
conversations were analyzed for references to traffic and
number of
turns taken following an initial traffic reference that still
centered on
the traffic topic. The latter indicates the extent to which the
driving
task became a conversational topic in its own right, temporarily
superseding the close-call stories. The number of traffic
references
in the passenger conversation condition and the cell phone con-
versation condition are shown in Table 2. Clearly, fewer
references
to traffic were made in the cell phone condition, t(46) � 3.0, p
�
.01, Cohen’s d � 0.9.
To determine who initiated the reference to traffic, we analyzed
the number of initializations made in the cell phone
conversation
condition and the passenger conversing condition using t tests.
The
number of references by the driver did not differ, t(46) � 1.7, p
�
.1, although there was a reliable difference in the number of
references initiated by the nondriving interlocutor, t(46) � 2.4,
p � .05, Cohen’s d � 0.7; with fewer references initiated in the
cell phone condition.
The next analysis focused on the number of turns between the
interlocutors who continued conversing about traffic after an
initial
reference to traffic was made. The number of turns for both
conditions is shown in Table 2. Overall more than twice as
many
turns occurred in the passenger condition as compared to the
cell
phone condition, t(46) � 3.4, p � .01, Cohen’s d � 1.0.
Production rate and complexity of speech. The final analyses
focused on the production rate of the driver and interlocutor and
the complexity of their speech (see Table 3) as a function of the
demand of the driving conditions. Because driving condition
(low
and moderate demand) is added to the analyses as independent
variable analyses of variance (ANOVA) were performed. In
mod-
erately demanding driving conditions, the production rate of the
driver decreased when talking to a passenger but increased
when
talking on a cell phone as indicated by a significant interaction
between driving condition and conversation condition, F(1, 39)
�
4.3, p � .05, partial �2 � 0.1. No differences were observed in
the
nondriving interlocutors production rates for conversation
condi-
tion, demand, and the interaction (the F values for the main
effects
and the interaction were all � .16 and effect sizes, partial �2 �
.03). Analyzing the complexity of speech indicated that both
driver, F(1, 43) � 5.5, p � .05, partial �2 � 0.1 and
interlocutor,
F(1, 43) � 4.8; p � .05; partial �2 � 0.1, responded to an
increase
in the cognitive demand of driving by reducing the number of
syllables per word. Neither the main effect of conversation con-
dition nor the interaction reached significance.
Discussion
The present study investigated how conversing with a passenger
differs from talking on a hands-free cell phone in terms of its
impact on driving performance at the operational, tactical, and
strategic level and how the dynamics of the conversations are
affected by contextual factors elicited by the driving task.
Michon (1979, 1985) suggested that lower level deficits of
driving
behavior ought to affect higher level performance. The present
study
provides evidence in support of this hypothesis under dual-
tasking
conditions. For the cell phone condition, the data suggest that
deficits
on lower levels of driving behavior also are present (though in
different form) at higher levels. For example, drivers
conversing on a
cell phone showed more lane keeping variability (operational
level)
than participants conversing with a passenger.
Figure 2. Participant talking on a cell phone in the I-Sim
driving
simulator.
Table 2
Means and Standard Deviations of References to Traffic and
Turns for Both Experimental Conditions
Passenger Cell phone
M (SD) M (SD)
References 3.8 (2.4) 2.1 (1.6)
Turns at speech 19.2 (13.8) 8.6 (6.7)
397CONVERSATIONS IN SIMULATED DRIVING
Similarly, on the tactical level, cell phone drivers do differ from
participants in the passenger condition on some measures (e.g.,
changes in following distance). However, no changes in driving
speed were observed in the dual-task condition, seemingly at
odds
with previous findings of slower driving cell phone drivers
(e.g.,
Strayer & Drews, 2007; Strayer et al., 2003). One explanation
for
this discrepancy could be procedural differences, with studies
demonstrating slower driving speed using a car following para-
digm as opposed to the free driving paradigm that was used
here.
On the strategic level of performance, cell phone drivers per-
formed poorly at the navigation task. Two nonmutually
exclusive
explanations can be provided for this deficit: First, drivers con-
versing on a cell phone may experience problems with keeping
the
intention of exiting at the rest area in working memory, or
second,
drivers may not sufficiently process information from the
driving
environment (exit signs). Some support for the latter hypothesis
comes from studies demonstrating inattention blindness in cell
phone drivers (Strayer et al., 2003). The performance of partici-
pants in the passenger conversation condition indicates that
these
drivers may have paid more attention to the navigation task,
partly
due to the passenger. Indeed, examination of the video taped
driving segments found several instances in which the passenger
helped the driver navigate to the rest area.
Overall, the study clearly documents that relative to a driving
only condition, cell phone use negatively impacts lane keeping,
increases the headway and leads to an impairment in a
navigation
task while passenger conversations have only little effect on all
of
the three measures.
Contrary to prior suggestions (e.g., Crundall et al., 2005;
Gugerty, Rando, Rakauskas, Brooks, & Olson, 2003), we did
not
find evidence that in-vehicle drivers and passengers were better
able to modulate their production speed to match changes in the
complexity of the driving task. Instead, we found some evidence
of
modulation of the complexity of speech, indicated by syllables-
per-word, in response to the demand of the driving task. Thus,
the
present findings suggest a process of modulation, but this
process
is not tied to production rate as it is in the original proposal of
Gugerty et al. (2003). Contrary to Gugerty et al. this study
reports
an increase in performance on the strategic level in the
passenger
condition, which should not have been observed if situation
aware-
ness had been negatively affected in both conversation
conditions.
Also, quite surprisingly drivers conversing on the cell phone
increased their production rate when talking on the cell phone,
which is contrary to the predictions of the modulation
hypothesis.
More interesting, this happened even as those drivers in the pas-
senger condition tended to reduce their production rate.
Some of the differences in findings may be explained by im-
portant methodological differences related to the study of
conver-
sation behavior in the context of driving. To realistically
measure
the impact of a conversation on driving performance, tasks that
are
not conversation tasks but traditional information processing
tasks
may miss central compensatory mechanisms of conversations,
thus
underestimating a conversations complex nature. Also, the use
of
low-fidelity simulations in passenger conversations may have a
significant impact on the process of grounding in a
conversation,
thereby not reflecting a conversation’s context that is central
for
processes of allocation of attention. One issue in naturalistic
con-
versation revolves around managing turn-taking—and these dif-
ferential changes in production rates for drivers, changes that
depended on the nature of the conversation—may reflect differ-
ences in how participants attempted to manage turn-taking.
Drivers
on cell phones may have attempted to dominate the conversation
to
avoid having to engage in speech comprehension, whereas with
in-vehicle partners, it may be easier to relinquish control, given
that the partner can be relied on to accommodate with his or her
contributions.
The conversation data suggest that passengers take an active
role in supporting the driver as indicated by passengers more
frequently talking about the surrounding traffic. It seems likely
that
a passenger supports the driver by directing attention to the sur-
rounding traffic when perceived necessary. As mentioned
above,
this conclusion is also supported by the analysis of the video
recordings (in some cases passengers mentioned the exit sign or
pointed to the exit). Thus, the higher driving performance in the
passenger condition is due in part to the shared situation
awareness
between driver and passenger due to grounding. This
interpretation
is also supported by the reliable difference in traffic references
initiated by the passenger and the cell phone interlocutor.
In addition, the results provide evidence for even more subtle
support between interlocutors. In both dual-task conditions,
there
is evidence that interlocutors respond to an increase in the
cogni-
tive demand from the driving context by reducing the
complexity
of their utterances. This difference seems to be driven by
changes
in the complexity of utterances by the driver because the
conver-
sation partner on the cell phone cannot be aware of changes in
the
driving environment.
Table 3
Means and Standard Deviations for Production and Complexity
for Driver and Passenger in
Both Experimental Conditions and Low Demand and Moderate
Demand Driving Scenarios
Passenger Cell phone
Low demand Moderate demand Low demand Moderate demand
M (SD) M (SD) M (SD) M (SD)
Driver Productiona 4.1 (1.0) 3.6 (1.0) 3.8 (0.9) 4.2 (1.8)
Complexityb 1.3 (0.2) 1.1 (0.3) 1.2 (0.1) 1.0 (0.4)
Passenger Productiona 3.7 (1.6) 4.0 (1.2) 3.8 (1.4) 3.6 (0.9)
Complexityb 1.2 (0.1) 1.1 (0.3) 1.3 (0.2) 1.1 (0.4)
a Given in syllable per second. b Given in syllable per word.
398 DREWS, PASUPATHI, AND STRAYER
The results also draw an intriguing picture about the allocation
of attention under dual-tasking conditions: Two similar
situations
with identical tasks and instructions lead to fundamentally
differ-
ent performance outcomes indicating that contextual variables
can
have a significant impact on overall performance.
The present findings are of theoretical and applied importance.
On the theoretical side they raise general questions about how
much current models of attention predict performance of dyads
or
groups in complex environments with regard to the allocation of
attention (see Cooke, Salas, Cannon-Bowers, & Stout, 2000).
Models of attention traditionally focus on individuals; however,
conceptualizing shared attention is of importance for any
general
theory of attention. Of more specific theoretical importance
here,
is the question of the mechanisms involved in the above
processes:
Does a passenger just provide cues that help to optimize the
allocation of attention or does the passenger qualitatively
change
the way that a driver allocates attention, thereby creating a form
of
joint or distributed attention?
On the practical side, the findings allow predictions about how
contexts can negatively affect dual-task performance. On one
hand, passengers not engaged in the driving task either because
they are not able to direct the attention of the driver toward
traffic,
or do not know how to identify important events in the driving
environment (e.g., children in the vehicle) have a potentially
negative impact on driving performance. On the other hand, it is
possible that overengagement can also have a potentially
negative
impact. For example a passenger who is too “supportive” by
constantly commenting and directing attention in an
overcontrol-
ling fashion has a potentially negative impact on performance.
In conclusion, the data indicate that cell phone and passenger
conversation differ in their impact on a driver’s performance
and that these differences are apparent at the operational, tac-
tical, and strategic levels of performance. The difference be-
tween these two modes of communication stems in large part
from the changes in the difference in the structure of cell phone
and passenger conversation and the degree to which the con-
versing dyad shares attention.
References
Alm, H., & Nilsson, L. (1995). The effects of a mobile
telephone task on
driver behaviour in a car following situation. Accident Analysis
&
Prevention, 27, 707–715.
Amado, S., & Ulupinar, P. (2005). The effects of conversation
on attention
and peripheral detection: Is talking with a passenger and talking
on the
cell phone different? Transportation Research Part F: Traffic
Psychol-
ogy and Behaviour, 8, 383–395.
Barkley, R. A. (2004). Driving impairments in teens and adults
with
attention-deficit/hyperactivity disorder. Psychiatric Clinics of
North
America, 27, 233–260.
Bavelas, J. B., Coates, L., & Johnson, T. (2000). Listeners as
co-narrators.
Journal of Personality and Social Psychology, 79, 941–952.
Berthold, A. (1998). Representation und Verarbeitung
sprachlicher In-
dikatoren fuer kognitive Ressourcenbeschraenkungen
(Representation
and processing of language-based indicators for cognitive
resource lim-
itations). Unpublished master’s thesis. University of
Saarbruecken, Saar-
bruecken, Germany.
Briem, V., & Hedman, L. R. (1995). Behavioural effects of
mobile tele-
phone use during simulated driving. Ergonomics, 38, 2536 –
2562.
Brookhuis, K. A., De Vries, G., & De Waard, D. (1991). The
effects of
mobile telephoning on driving performance. Accident Analysis
& Pre-
vention, 23, 309 –316.
Brown, I. D., Tickner, A. H., & Simmonds, D. C. V., (1969),
Interference
between concurrent tasks of driving and telephoning, Journal of
Applied
Psychology, 5, 419 – 431.
Burns, P. C., Parkes, A., Burton, S., & Smith, R. K., (2002).
How
dangerous is driving with a mobile phone? Benchmarking the
impair-
ment to alcohol. TRL Report 547. Berkshire, England:
Transport Re-
search Laboratory.
Clark, H. H. (1996). Using language. Cambridge, England:
Cambridge
University Press.
Clark, H. H., &. Schaefer, E. F. (1989). Contributing to
discourse. Cog-
nitive Science, 13, 259 –294.
Consiglio, W., Driscoll, P., Witte, M., & Berg, W. P. (2003).
Effect of
cellular telephone conversations and other potential interference
on
reaction time in a braking response. Accident Analysis &
Prevention, 35,
495–500.
Cooke, N. J., Salas, E., Cannon-Bowers, J. A., & Stout, R.
(2000). Mea-
suring team knowledge. Human Factors, 42, 151–173.
Crundall, D., Bains, M., Chapman, P., & Underwood, G. (2005).
Regulat-
ing conversation during driving: A problem for mobile
telephone?
Transportation Research Part F: Traffic Psychology and
Behaviour, 8,
197–211.
Drews, F. A., Pasupathi, M., & Strayer, D. L. (2004). Passenger
and
cell-phone conversations in simulated driving. Proceedings of
the 48nd
Annual Meeting of the Human Factors and Ergonomics Society,
1,
2210 –2212.
Drews, F. A., & Strayer, D. L. (2008). Mobile phones. In M.
Regan, J. D.
Lee, & K. Young (Eds.), Driver distraction: Theory, effects and
miti-
gation (pp 169 –189). CRC.
Drews, F. A., Strayer, D. L., Uchino, B. N., & Smith, T. W. (in
press). On
the fast lane to road rage. In A. G. Gale, S. P. Taylor, & C.
Castro (Eds.),
Vision in vehicles X. Amsterdam, Netherlands: Elsevier.
Goodman, M. F., Bents, F. D., Tijerina, L., Wierwille, W.,
Lerner, N., &
Benel, D. (1999). An investigation of the safety implications of
wireless
communication in vehicles. Report summary. Report summary
available
at
http://www.nhtsa.dot.gov/people/injury/research/wireless/#rep
Groeger, J. A. (1999). Expectancy and control: Perceptual and
cognitive
aspects of the driving task. In P. A. Hancock (Ed.), Human
performance
and ergonomics. San Diego, CA: Academic.
Gugerty, L., Rakauskas, M., & Brooks, J. (2004). Effects of
remote and
in-person verbal interactions on verbalization rates and
attention to dynamic
spatial scenes. Accident Analysis & Prevention, 36, 1029 –
1043.
Gugerty, L., Rando, C., Rakauskas, M., Brooks, J., & Olson, H.,
(2003).
Differences in remote versus in-person communications while
perform-
ing a driving task. Proceedings of the 47th Annual Meeting of
the Human
Factors and Ergonomics Society, 1, 1855–1859.
Haigney, D. E., & Westerman, S. J. (2001). Mobile (cellular)
phone use
and driving: A critical review of research methodology.
Ergonomics, 44,
132–148.
Horberry, T., Anderson, J., Regan, M. A., Triggs, T. J., &
Brown, J. (2006).
Driver distraction: The effects of concurrent in-vehicle tasks,
road en-
vironment complexity and age on driving performance. Accident
Anal-
ysis & Prevention, 38, 185.
Horrey, W. J., & Wickens, C. D. (2006). Examining the impact
of cell
phone conversations on driving using meta-analytic techniques.
Human
Factors, 48, 196 –205.
Ishihara, S. (1993). Ishihara’s test for color-blindness. Tokyo:
Kanehara.
Kramer, A. F., Sirevaag, E. J., & Braun, R. (1987). A
psychophysiological
assessment of operator workload during simulated flight
missions. Hu-
man Factors, 29, 145–160.
Ma, R., & Kaber, D. B. (2005). Situation awareness and
workload in
driving while using adaptive cruise control and a cell phone.
Interna-
tional Journal of Industrial Ergonomics, 35, 939 –953.
399CONVERSATIONS IN SIMULATED DRIVING
McCarley, J. S., Vais, M. J., Pringle, H., Kramer, A. F., Irwin,
D. E., &
Strayer, D. L. (2004). Conversation disrupts change detection in
com-
plex traffic scenes. Human Factors, 46, 424 – 436.
McEvoy, S. P., Stevenson, M. R., McCartt, A. T., Woodward,
M.,
Haworth, C. Palamara, P., et al. (2005). Role of mobile phones
in motor
vehicle crashes resulting in hospital attendance: A case-
crossover study.
British Journal of Medicine, 331, 428 – 434.
McKnight, A. J., & McKnight, A. S. (1993). The effect of
cellular phone
use upon driver attention. Accident Analysis & Prevention, 25,
259 –265.
Michon, J. A. (1979). Dealing with danger (Traffic Safety
Research
Center, Report No. VK–79 –1). State University, Groningen,
The
Netherlands.
Michon, J. A. (1985). A critical review of driver behavior
models: What we
do know, what should we do? In L. Evans & R. C. Schwing
(Eds.),
Human behavior and traffic safety. New York: Plenum.
Müller, C., Gro�mann-Hutter, B., Jameson, A., Rummer, R., &
Wittig, F.
(2001). Recognizing time pressure and cognitive load on the
basis of
speech: An experimental study. In M. Bauer, P. J.
Gmytrasiewicz, & J.
Vassileva (Eds.). User modelling (pp. 24 –33). Berlin,
Germany:
Springer.
Redelmeier, D. A., & Tibshirani, R. J. (1997). Association
between
cellular-telephone calls and motor vehicle collisions. The New
England
Journal of Medicine, 336, 453– 458.
Reuda-Domingo, T., Lardelli-Claret, P., Luna-del-Castillo Jde,
D.,
Jiménez-Moleón, J. J., Garcı́a-Martı́n, M., & Bueno-Cavanillas,
A.
(2004). The influence of passengers on the risk of the driver
causing a
car collision in Spain: Analysis of collisions from 1990 to 1999.
Acci-
dent Analysis & Prevention, 36, 481– 489.
Richardson, D. C., Dale, R., & Kirkham, N. Z. (2007). The art
of conver-
sation is coordination. Psychological Science, 18, 407– 413.
Sirevaag, E. J., Kramer, A. F., Coles, M. G., & Donchin, E.
(1989).
Resource reciprocity: An event-related brain potentials analysis.
Acta
Psychologica, 70, 77–97.
Stein, A. C., Parseghian, Z., & Allen, R. W. (1987). A simulator
study of
the safety implications of cellular mobile phone use. In
Proceedings of
the 31st Annual Conference of the Association for the
Advancement of
Automotive Medicine (p. 181). Des Plaines, IL.
Strayer, D. L., & Drews, F. A. (2006). Multi-tasking in the
automobile. In
A. Kramer, D. Wiegmann, & A. Kirlik (Eds.), Applied attention:
From
theory to practice (pp. 121–133). New York: Oxford University
Press.
Strayer, D. L., & Drews, F. A. (2007). Cell phone induced
driver distrac-
tion. Current Directions in Psychological Science, 16, 128 –131.
Strayer, D. L., Drews, F. A., & Crouch, D. (2006). A
comparison of the
cell-phone driver and the drunk driver. Human Factors, 48, 381–
391.
Strayer, D. L., Drews, F. A., & Johnston, W. A. (2003). Cell
phone induced
failures of visual attention during simulated driving. Journal of
Exper-
imental Psychology: Applied, 9, 23–32.
Strayer, D. L., & Johnston, W. A. (2001). Driven to distraction:
Dual-task
studies of simulated driving and conversing on a cellular phone.
Psy-
chological Science, 12, 462– 466.
Svenson, O., & Patten, C. J. D. (2005). Mobile phones and
driving: Review of
contemporary research. Cognition, Technology and Work, 7,
182–197.
Treffner, P. J., & Barrett, R. (2004). Hands-free mobile phone
speech while
driving degrades coordination and control. Transportation
Research
Part F, 7, 229 –246.
Vollrath, M., Meilinger, T., & Krüger, H. P. (2002). How the
presence of
passengers influences the risk of a collision with another
vehicle. Acci-
dent Analysis and Prevention, 34, 649 – 654.
Received January 26, 2007
Revision received June 5, 2008
Accepted June 9, 2008 �
Call for Nominations
The Publications and Communications (P&C) Board of the
American Psychological Association
has opened nominations for the editorships of Developmental
Psychology, Journal of Consulting
and Clinical Psychology, and Psychological Review for the
years 2011–2016. Cynthia Garcı́a
Coll, PhD, Annette M. La Greca, PhD, and Keith Rayner, PhD,
respectively, are the incumbent
editors.
Candidates should be members of APA and should be available
to start receiving manuscripts in
early 2010 to prepare for issues published in 2011. Please note
that the P&C Board encourages
participation by members of underrepresented groups in the
publication process and would partic-
ularly welcome such nominees. Self-nominations are also
encouraged.
Search chairs have been appointed as follows:
● Developmental Psychology, Peter A. Ornstein, PhD, and
Valerie Reyna, PhD
● Journal of Consulting and Clinical Psychology, Norman
Abeles, PhD
● Psychological Review, David C. Funder, PhD, and Leah L.
Light, PhD
Candidates should be nominated by accessing APA’s
EditorQuest site on the Web. Using your
Web browser, go to http://editorquest.apa.org. On the Home
menu on the left, find “Guests.” Next,
click on the link “Submit a Nomination,” enter your nominee’s
information, and click “Submit.”
Prepared statements of one page or less in support of a nominee
can also be submitted by e-mail
to Emnet Tesfaye, P&C Board Search Liaison, at
[email protected]
Deadline for accepting nominations is January 10, 2009, when
reviews will begin.
400 DREWS, PASUPATHI, AND STRAYER

More Related Content

Similar to ECO 480 Econometrics I Problem Set 5 Due Monday, Nove.docx

Unlocking Success A Comprehensive Guide to the CORe Certification Exam
Unlocking Success A Comprehensive Guide to the CORe Certification ExamUnlocking Success A Comprehensive Guide to the CORe Certification Exam
Unlocking Success A Comprehensive Guide to the CORe Certification ExamAliza Oscar
 
STAT 200 Introduction to Statistics Final Examination, Spri.docx
STAT 200 Introduction to Statistics Final Examination, Spri.docxSTAT 200 Introduction to Statistics Final Examination, Spri.docx
STAT 200 Introduction to Statistics Final Examination, Spri.docxrafaelaj1
 
Mth 540 Massive Success / snaptutorial.com
Mth 540 Massive Success / snaptutorial.comMth 540 Massive Success / snaptutorial.com
Mth 540 Massive Success / snaptutorial.comReynoldsha
 
Mth 540 Success Begins / snaptutorial.com
Mth 540  Success Begins / snaptutorial.comMth 540  Success Begins / snaptutorial.com
Mth 540 Success Begins / snaptutorial.comWilliamsTaylor63
 
Answer SheetInstructions This is an open-book exam. Yo.docx
Answer SheetInstructions  This is an open-book exam. Yo.docxAnswer SheetInstructions  This is an open-book exam. Yo.docx
Answer SheetInstructions This is an open-book exam. Yo.docxfestockton
 
Busi 620 Enhance teaching / snaptutorial.com
Busi 620  Enhance teaching / snaptutorial.comBusi 620  Enhance teaching / snaptutorial.com
Busi 620 Enhance teaching / snaptutorial.comHarrisGeorg50
 
Part ASome questions in Part A require that you access dat.docx
Part ASome questions in Part A require that you access dat.docxPart ASome questions in Part A require that you access dat.docx
Part ASome questions in Part A require that you access dat.docxbridgelandying
 
STAT 200 Final ExaminationFall 2016 OL1US1Page 9 of 9STAT 200.docx
STAT 200 Final ExaminationFall 2016 OL1US1Page 9 of 9STAT 200.docxSTAT 200 Final ExaminationFall 2016 OL1US1Page 9 of 9STAT 200.docx
STAT 200 Final ExaminationFall 2016 OL1US1Page 9 of 9STAT 200.docxwhitneyleman54422
 
This is an open-book exam. You may refer to your text and other .docx
This is an open-book exam. You may refer to your text and other .docxThis is an open-book exam. You may refer to your text and other .docx
This is an open-book exam. You may refer to your text and other .docxchristalgrieg
 

Similar to ECO 480 Econometrics I Problem Set 5 Due Monday, Nove.docx (11)

Unlocking Success A Comprehensive Guide to the CORe Certification Exam
Unlocking Success A Comprehensive Guide to the CORe Certification ExamUnlocking Success A Comprehensive Guide to the CORe Certification Exam
Unlocking Success A Comprehensive Guide to the CORe Certification Exam
 
STAT 200 Introduction to Statistics Final Examination, Spri.docx
STAT 200 Introduction to Statistics Final Examination, Spri.docxSTAT 200 Introduction to Statistics Final Examination, Spri.docx
STAT 200 Introduction to Statistics Final Examination, Spri.docx
 
Mth 540 Massive Success / snaptutorial.com
Mth 540 Massive Success / snaptutorial.comMth 540 Massive Success / snaptutorial.com
Mth 540 Massive Success / snaptutorial.com
 
Mth 540 Success Begins / snaptutorial.com
Mth 540  Success Begins / snaptutorial.comMth 540  Success Begins / snaptutorial.com
Mth 540 Success Begins / snaptutorial.com
 
Answer SheetInstructions This is an open-book exam. Yo.docx
Answer SheetInstructions  This is an open-book exam. Yo.docxAnswer SheetInstructions  This is an open-book exam. Yo.docx
Answer SheetInstructions This is an open-book exam. Yo.docx
 
Practice final answer
Practice final answerPractice final answer
Practice final answer
 
Busi 620 Enhance teaching / snaptutorial.com
Busi 620  Enhance teaching / snaptutorial.comBusi 620  Enhance teaching / snaptutorial.com
Busi 620 Enhance teaching / snaptutorial.com
 
Part ASome questions in Part A require that you access dat.docx
Part ASome questions in Part A require that you access dat.docxPart ASome questions in Part A require that you access dat.docx
Part ASome questions in Part A require that you access dat.docx
 
STAT 200 Final ExaminationFall 2016 OL1US1Page 9 of 9STAT 200.docx
STAT 200 Final ExaminationFall 2016 OL1US1Page 9 of 9STAT 200.docxSTAT 200 Final ExaminationFall 2016 OL1US1Page 9 of 9STAT 200.docx
STAT 200 Final ExaminationFall 2016 OL1US1Page 9 of 9STAT 200.docx
 
This is an open-book exam. You may refer to your text and other .docx
This is an open-book exam. You may refer to your text and other .docxThis is an open-book exam. You may refer to your text and other .docx
This is an open-book exam. You may refer to your text and other .docx
 
Qnt275 qnt 275
Qnt275 qnt 275Qnt275 qnt 275
Qnt275 qnt 275
 

More from jack60216

Anorexia1-Definition2-Epidemiology in united states2.docx
Anorexia1-Definition2-Epidemiology in united states2.docxAnorexia1-Definition2-Epidemiology in united states2.docx
Anorexia1-Definition2-Epidemiology in united states2.docxjack60216
 
Annotated BibliographyIn preparation of next weeks final as.docx
Annotated BibliographyIn preparation of next weeks final as.docxAnnotated BibliographyIn preparation of next weeks final as.docx
Annotated BibliographyIn preparation of next weeks final as.docxjack60216
 
Annual Report to the Nation on the Status of Cancer,Part I .docx
Annual Report to the Nation on the Status of Cancer,Part I .docxAnnual Report to the Nation on the Status of Cancer,Part I .docx
Annual Report to the Nation on the Status of Cancer,Part I .docxjack60216
 
Annotated BibliographyDue 1212019 @ 12pm Eastern Time (Unite.docx
Annotated BibliographyDue 1212019 @ 12pm Eastern Time (Unite.docxAnnotated BibliographyDue 1212019 @ 12pm Eastern Time (Unite.docx
Annotated BibliographyDue 1212019 @ 12pm Eastern Time (Unite.docxjack60216
 
Annotated BibliographyFor this assignment, you will create an .docx
Annotated BibliographyFor this assignment, you will create an .docxAnnotated BibliographyFor this assignment, you will create an .docx
Annotated BibliographyFor this assignment, you will create an .docxjack60216
 
Annotated bibliography due in 36 hours. MLA format Must incl.docx
Annotated bibliography due in 36 hours. MLA format Must incl.docxAnnotated bibliography due in 36 hours. MLA format Must incl.docx
Annotated bibliography due in 36 hours. MLA format Must incl.docxjack60216
 
Analyzing a Short Story- The Necklace by Guy de MaupassantIntro.docx
Analyzing a Short Story- The Necklace by Guy de MaupassantIntro.docxAnalyzing a Short Story- The Necklace by Guy de MaupassantIntro.docx
Analyzing a Short Story- The Necklace by Guy de MaupassantIntro.docxjack60216
 
Andy Sylvan was the assistant director of the community developm.docx
Andy Sylvan was the assistant director of the community developm.docxAndy Sylvan was the assistant director of the community developm.docx
Andy Sylvan was the assistant director of the community developm.docxjack60216
 
Annotated Bibliography Althaus, F. U.S. Maternal Morta.docx
Annotated Bibliography  Althaus, F. U.S. Maternal Morta.docxAnnotated Bibliography  Althaus, F. U.S. Maternal Morta.docx
Annotated Bibliography Althaus, F. U.S. Maternal Morta.docxjack60216
 
Ann, a community nurse, made an afternoon home visit with Susan and .docx
Ann, a community nurse, made an afternoon home visit with Susan and .docxAnn, a community nurse, made an afternoon home visit with Susan and .docx
Ann, a community nurse, made an afternoon home visit with Susan and .docxjack60216
 
Andrea Walters Week 2 Main Post       The key functional area of n.docx
Andrea Walters Week 2 Main Post       The key functional area of n.docxAndrea Walters Week 2 Main Post       The key functional area of n.docx
Andrea Walters Week 2 Main Post       The key functional area of n.docxjack60216
 
and emergency CPR all changed ways of thinking about risk of death.docx
and emergency CPR all changed ways of thinking about risk of death.docxand emergency CPR all changed ways of thinking about risk of death.docx
and emergency CPR all changed ways of thinking about risk of death.docxjack60216
 
analyze, and discuss emerging ICT tools and technologies present.docx
analyze, and discuss emerging ICT tools and technologies present.docxanalyze, and discuss emerging ICT tools and technologies present.docx
analyze, and discuss emerging ICT tools and technologies present.docxjack60216
 
Analyzing a Research ArticleNote Please complete this dis.docx
Analyzing a Research ArticleNote Please complete this dis.docxAnalyzing a Research ArticleNote Please complete this dis.docx
Analyzing a Research ArticleNote Please complete this dis.docxjack60216
 
Analyze the Civil Rights Movement of the 1950s and 1960s. What p.docx
Analyze the Civil Rights Movement of the 1950s and 1960s. What p.docxAnalyze the Civil Rights Movement of the 1950s and 1960s. What p.docx
Analyze the Civil Rights Movement of the 1950s and 1960s. What p.docxjack60216
 
Analytical Research Project InstructionsINFA 630 – Intrusion.docx
Analytical Research Project InstructionsINFA 630 – Intrusion.docxAnalytical Research Project InstructionsINFA 630 – Intrusion.docx
Analytical Research Project InstructionsINFA 630 – Intrusion.docxjack60216
 
Analyze the performance of the leadership of an organization (Netfli.docx
Analyze the performance of the leadership of an organization (Netfli.docxAnalyze the performance of the leadership of an organization (Netfli.docx
Analyze the performance of the leadership of an organization (Netfli.docxjack60216
 
Analyze the subjective portion of the note. List additiona.docx
Analyze the subjective portion of the note. List additiona.docxAnalyze the subjective portion of the note. List additiona.docx
Analyze the subjective portion of the note. List additiona.docxjack60216
 
Analyze the measures your state and local community have in pl.docx
Analyze the measures your state and local community have in pl.docxAnalyze the measures your state and local community have in pl.docx
Analyze the measures your state and local community have in pl.docxjack60216
 
Analyze two (2) advantages and two (2) disadvantages of creati.docx
Analyze two (2) advantages and two (2) disadvantages of creati.docxAnalyze two (2) advantages and two (2) disadvantages of creati.docx
Analyze two (2) advantages and two (2) disadvantages of creati.docxjack60216
 

More from jack60216 (20)

Anorexia1-Definition2-Epidemiology in united states2.docx
Anorexia1-Definition2-Epidemiology in united states2.docxAnorexia1-Definition2-Epidemiology in united states2.docx
Anorexia1-Definition2-Epidemiology in united states2.docx
 
Annotated BibliographyIn preparation of next weeks final as.docx
Annotated BibliographyIn preparation of next weeks final as.docxAnnotated BibliographyIn preparation of next weeks final as.docx
Annotated BibliographyIn preparation of next weeks final as.docx
 
Annual Report to the Nation on the Status of Cancer,Part I .docx
Annual Report to the Nation on the Status of Cancer,Part I .docxAnnual Report to the Nation on the Status of Cancer,Part I .docx
Annual Report to the Nation on the Status of Cancer,Part I .docx
 
Annotated BibliographyDue 1212019 @ 12pm Eastern Time (Unite.docx
Annotated BibliographyDue 1212019 @ 12pm Eastern Time (Unite.docxAnnotated BibliographyDue 1212019 @ 12pm Eastern Time (Unite.docx
Annotated BibliographyDue 1212019 @ 12pm Eastern Time (Unite.docx
 
Annotated BibliographyFor this assignment, you will create an .docx
Annotated BibliographyFor this assignment, you will create an .docxAnnotated BibliographyFor this assignment, you will create an .docx
Annotated BibliographyFor this assignment, you will create an .docx
 
Annotated bibliography due in 36 hours. MLA format Must incl.docx
Annotated bibliography due in 36 hours. MLA format Must incl.docxAnnotated bibliography due in 36 hours. MLA format Must incl.docx
Annotated bibliography due in 36 hours. MLA format Must incl.docx
 
Analyzing a Short Story- The Necklace by Guy de MaupassantIntro.docx
Analyzing a Short Story- The Necklace by Guy de MaupassantIntro.docxAnalyzing a Short Story- The Necklace by Guy de MaupassantIntro.docx
Analyzing a Short Story- The Necklace by Guy de MaupassantIntro.docx
 
Andy Sylvan was the assistant director of the community developm.docx
Andy Sylvan was the assistant director of the community developm.docxAndy Sylvan was the assistant director of the community developm.docx
Andy Sylvan was the assistant director of the community developm.docx
 
Annotated Bibliography Althaus, F. U.S. Maternal Morta.docx
Annotated Bibliography  Althaus, F. U.S. Maternal Morta.docxAnnotated Bibliography  Althaus, F. U.S. Maternal Morta.docx
Annotated Bibliography Althaus, F. U.S. Maternal Morta.docx
 
Ann, a community nurse, made an afternoon home visit with Susan and .docx
Ann, a community nurse, made an afternoon home visit with Susan and .docxAnn, a community nurse, made an afternoon home visit with Susan and .docx
Ann, a community nurse, made an afternoon home visit with Susan and .docx
 
Andrea Walters Week 2 Main Post       The key functional area of n.docx
Andrea Walters Week 2 Main Post       The key functional area of n.docxAndrea Walters Week 2 Main Post       The key functional area of n.docx
Andrea Walters Week 2 Main Post       The key functional area of n.docx
 
and emergency CPR all changed ways of thinking about risk of death.docx
and emergency CPR all changed ways of thinking about risk of death.docxand emergency CPR all changed ways of thinking about risk of death.docx
and emergency CPR all changed ways of thinking about risk of death.docx
 
analyze, and discuss emerging ICT tools and technologies present.docx
analyze, and discuss emerging ICT tools and technologies present.docxanalyze, and discuss emerging ICT tools and technologies present.docx
analyze, and discuss emerging ICT tools and technologies present.docx
 
Analyzing a Research ArticleNote Please complete this dis.docx
Analyzing a Research ArticleNote Please complete this dis.docxAnalyzing a Research ArticleNote Please complete this dis.docx
Analyzing a Research ArticleNote Please complete this dis.docx
 
Analyze the Civil Rights Movement of the 1950s and 1960s. What p.docx
Analyze the Civil Rights Movement of the 1950s and 1960s. What p.docxAnalyze the Civil Rights Movement of the 1950s and 1960s. What p.docx
Analyze the Civil Rights Movement of the 1950s and 1960s. What p.docx
 
Analytical Research Project InstructionsINFA 630 – Intrusion.docx
Analytical Research Project InstructionsINFA 630 – Intrusion.docxAnalytical Research Project InstructionsINFA 630 – Intrusion.docx
Analytical Research Project InstructionsINFA 630 – Intrusion.docx
 
Analyze the performance of the leadership of an organization (Netfli.docx
Analyze the performance of the leadership of an organization (Netfli.docxAnalyze the performance of the leadership of an organization (Netfli.docx
Analyze the performance of the leadership of an organization (Netfli.docx
 
Analyze the subjective portion of the note. List additiona.docx
Analyze the subjective portion of the note. List additiona.docxAnalyze the subjective portion of the note. List additiona.docx
Analyze the subjective portion of the note. List additiona.docx
 
Analyze the measures your state and local community have in pl.docx
Analyze the measures your state and local community have in pl.docxAnalyze the measures your state and local community have in pl.docx
Analyze the measures your state and local community have in pl.docx
 
Analyze two (2) advantages and two (2) disadvantages of creati.docx
Analyze two (2) advantages and two (2) disadvantages of creati.docxAnalyze two (2) advantages and two (2) disadvantages of creati.docx
Analyze two (2) advantages and two (2) disadvantages of creati.docx
 

Recently uploaded

Employee wellbeing at the workplace.pptx
Employee wellbeing at the workplace.pptxEmployee wellbeing at the workplace.pptx
Employee wellbeing at the workplace.pptxNirmalaLoungPoorunde1
 
The Most Excellent Way | 1 Corinthians 13
The Most Excellent Way | 1 Corinthians 13The Most Excellent Way | 1 Corinthians 13
The Most Excellent Way | 1 Corinthians 13Steve Thomason
 
Micromeritics - Fundamental and Derived Properties of Powders
Micromeritics - Fundamental and Derived Properties of PowdersMicromeritics - Fundamental and Derived Properties of Powders
Micromeritics - Fundamental and Derived Properties of PowdersChitralekhaTherkar
 
The basics of sentences session 2pptx copy.pptx
The basics of sentences session 2pptx copy.pptxThe basics of sentences session 2pptx copy.pptx
The basics of sentences session 2pptx copy.pptxheathfieldcps1
 
POINT- BIOCHEMISTRY SEM 2 ENZYMES UNIT 5.pptx
POINT- BIOCHEMISTRY SEM 2 ENZYMES UNIT 5.pptxPOINT- BIOCHEMISTRY SEM 2 ENZYMES UNIT 5.pptx
POINT- BIOCHEMISTRY SEM 2 ENZYMES UNIT 5.pptxSayali Powar
 
Accessible design: Minimum effort, maximum impact
Accessible design: Minimum effort, maximum impactAccessible design: Minimum effort, maximum impact
Accessible design: Minimum effort, maximum impactdawncurless
 
Call Girls in Dwarka Mor Delhi Contact Us 9654467111
Call Girls in Dwarka Mor Delhi Contact Us 9654467111Call Girls in Dwarka Mor Delhi Contact Us 9654467111
Call Girls in Dwarka Mor Delhi Contact Us 9654467111Sapana Sha
 
Mastering the Unannounced Regulatory Inspection
Mastering the Unannounced Regulatory InspectionMastering the Unannounced Regulatory Inspection
Mastering the Unannounced Regulatory InspectionSafetyChain Software
 
Industrial Policy - 1948, 1956, 1973, 1977, 1980, 1991
Industrial Policy - 1948, 1956, 1973, 1977, 1980, 1991Industrial Policy - 1948, 1956, 1973, 1977, 1980, 1991
Industrial Policy - 1948, 1956, 1973, 1977, 1980, 1991RKavithamani
 
URLs and Routing in the Odoo 17 Website App
URLs and Routing in the Odoo 17 Website AppURLs and Routing in the Odoo 17 Website App
URLs and Routing in the Odoo 17 Website AppCeline George
 
Presiding Officer Training module 2024 lok sabha elections
Presiding Officer Training module 2024 lok sabha electionsPresiding Officer Training module 2024 lok sabha elections
Presiding Officer Training module 2024 lok sabha electionsanshu789521
 
A Critique of the Proposed National Education Policy Reform
A Critique of the Proposed National Education Policy ReformA Critique of the Proposed National Education Policy Reform
A Critique of the Proposed National Education Policy ReformChameera Dedduwage
 
Arihant handbook biology for class 11 .pdf
Arihant handbook biology for class 11 .pdfArihant handbook biology for class 11 .pdf
Arihant handbook biology for class 11 .pdfchloefrazer622
 
MENTAL STATUS EXAMINATION format.docx
MENTAL     STATUS EXAMINATION format.docxMENTAL     STATUS EXAMINATION format.docx
MENTAL STATUS EXAMINATION format.docxPoojaSen20
 
mini mental status format.docx
mini    mental       status     format.docxmini    mental       status     format.docx
mini mental status format.docxPoojaSen20
 
Paris 2024 Olympic Geographies - an activity
Paris 2024 Olympic Geographies - an activityParis 2024 Olympic Geographies - an activity
Paris 2024 Olympic Geographies - an activityGeoBlogs
 
APM Welcome, APM North West Network Conference, Synergies Across Sectors
APM Welcome, APM North West Network Conference, Synergies Across SectorsAPM Welcome, APM North West Network Conference, Synergies Across Sectors
APM Welcome, APM North West Network Conference, Synergies Across SectorsAssociation for Project Management
 

Recently uploaded (20)

Employee wellbeing at the workplace.pptx
Employee wellbeing at the workplace.pptxEmployee wellbeing at the workplace.pptx
Employee wellbeing at the workplace.pptx
 
The Most Excellent Way | 1 Corinthians 13
The Most Excellent Way | 1 Corinthians 13The Most Excellent Way | 1 Corinthians 13
The Most Excellent Way | 1 Corinthians 13
 
Micromeritics - Fundamental and Derived Properties of Powders
Micromeritics - Fundamental and Derived Properties of PowdersMicromeritics - Fundamental and Derived Properties of Powders
Micromeritics - Fundamental and Derived Properties of Powders
 
The basics of sentences session 2pptx copy.pptx
The basics of sentences session 2pptx copy.pptxThe basics of sentences session 2pptx copy.pptx
The basics of sentences session 2pptx copy.pptx
 
Model Call Girl in Tilak Nagar Delhi reach out to us at 🔝9953056974🔝
Model Call Girl in Tilak Nagar Delhi reach out to us at 🔝9953056974🔝Model Call Girl in Tilak Nagar Delhi reach out to us at 🔝9953056974🔝
Model Call Girl in Tilak Nagar Delhi reach out to us at 🔝9953056974🔝
 
POINT- BIOCHEMISTRY SEM 2 ENZYMES UNIT 5.pptx
POINT- BIOCHEMISTRY SEM 2 ENZYMES UNIT 5.pptxPOINT- BIOCHEMISTRY SEM 2 ENZYMES UNIT 5.pptx
POINT- BIOCHEMISTRY SEM 2 ENZYMES UNIT 5.pptx
 
Accessible design: Minimum effort, maximum impact
Accessible design: Minimum effort, maximum impactAccessible design: Minimum effort, maximum impact
Accessible design: Minimum effort, maximum impact
 
Call Girls in Dwarka Mor Delhi Contact Us 9654467111
Call Girls in Dwarka Mor Delhi Contact Us 9654467111Call Girls in Dwarka Mor Delhi Contact Us 9654467111
Call Girls in Dwarka Mor Delhi Contact Us 9654467111
 
TataKelola dan KamSiber Kecerdasan Buatan v022.pdf
TataKelola dan KamSiber Kecerdasan Buatan v022.pdfTataKelola dan KamSiber Kecerdasan Buatan v022.pdf
TataKelola dan KamSiber Kecerdasan Buatan v022.pdf
 
Staff of Color (SOC) Retention Efforts DDSD
Staff of Color (SOC) Retention Efforts DDSDStaff of Color (SOC) Retention Efforts DDSD
Staff of Color (SOC) Retention Efforts DDSD
 
Mastering the Unannounced Regulatory Inspection
Mastering the Unannounced Regulatory InspectionMastering the Unannounced Regulatory Inspection
Mastering the Unannounced Regulatory Inspection
 
Industrial Policy - 1948, 1956, 1973, 1977, 1980, 1991
Industrial Policy - 1948, 1956, 1973, 1977, 1980, 1991Industrial Policy - 1948, 1956, 1973, 1977, 1980, 1991
Industrial Policy - 1948, 1956, 1973, 1977, 1980, 1991
 
URLs and Routing in the Odoo 17 Website App
URLs and Routing in the Odoo 17 Website AppURLs and Routing in the Odoo 17 Website App
URLs and Routing in the Odoo 17 Website App
 
Presiding Officer Training module 2024 lok sabha elections
Presiding Officer Training module 2024 lok sabha electionsPresiding Officer Training module 2024 lok sabha elections
Presiding Officer Training module 2024 lok sabha elections
 
A Critique of the Proposed National Education Policy Reform
A Critique of the Proposed National Education Policy ReformA Critique of the Proposed National Education Policy Reform
A Critique of the Proposed National Education Policy Reform
 
Arihant handbook biology for class 11 .pdf
Arihant handbook biology for class 11 .pdfArihant handbook biology for class 11 .pdf
Arihant handbook biology for class 11 .pdf
 
MENTAL STATUS EXAMINATION format.docx
MENTAL     STATUS EXAMINATION format.docxMENTAL     STATUS EXAMINATION format.docx
MENTAL STATUS EXAMINATION format.docx
 
mini mental status format.docx
mini    mental       status     format.docxmini    mental       status     format.docx
mini mental status format.docx
 
Paris 2024 Olympic Geographies - an activity
Paris 2024 Olympic Geographies - an activityParis 2024 Olympic Geographies - an activity
Paris 2024 Olympic Geographies - an activity
 
APM Welcome, APM North West Network Conference, Synergies Across Sectors
APM Welcome, APM North West Network Conference, Synergies Across SectorsAPM Welcome, APM North West Network Conference, Synergies Across Sectors
APM Welcome, APM North West Network Conference, Synergies Across Sectors
 

ECO 480 Econometrics I Problem Set 5 Due Monday, Nove.docx

  • 1. ECO 480 Econometrics I Problem Set 5 Due: Monday, November 30, 2015 (beginning of the class) 1 Instruction: The problem sets are designed to be difficult and very time-intensive, so plan ahead. The problem sets consists of solving theoretical problems and analyzing real data. You may discuss the questions with your classmates, but you are required to hand in your own independently written solutions, do-files, and log-files. No late work will be accepted and I do NOT accept any electronic copy. All the data necessary for the problem set is available under UBlearns. Important: It is extremely important to write a clean well- commented program for transparency and replication purposes. In any empirical work, you should always be able to reproduce your result from raw
  • 2. data to support your claim. What to hand in: Typed write-up answering the assigned questions and interpreting your findings, do-file, and log-file (you MUST use Stata). For questions involving data analysis, you will NOT get any credit if you do not provide a program code. You may NOT use Excel. 1. How are returns on common stocks in overseas markets related to returns in U.S. markets? Consider measuring U.S. returns by the annual rate of returns on the Standard & Poor’s (S&P) 500 stock index and overseas returns by the annual rate of returns on the Morgan Stanley Europe, Australia, Asia, Far East (EAFE) index. Both are recorded in percent. Regressing the EAFE returns on the S&P 500 returns for the 20 years 1989 to 2008. Here is part of the output for this regression: The regression equation is EAFE = -2.58 + 0.775 S&P Analysis of Variance Source df SS MS
  • 3. Model 4560.6 Residual Total 19 8556.0 a. Complete the analysis of variance table by filling in the missing entries. Show (Justify) how you came up with that answer. b. What are the values of the regression standard error and the R2? c. Find the standard error for the least-squares slope. Show your work. d. If I tell you that the standard deviation of the S&P 500 returns for these years is 19.99%. How would you use this information to find the standard error for the least-squares slope you found in part c? e. Give a 95% confidence interval for the slope β1 of the population regression line. Show your work.
  • 4. ECO 480 Econometrics I Problem Set 5 Due: Monday, November 30, 2015 (beginning of the class) 2 2. An electronic survey of 7,061 players of Guitar Hero and Rock Band reported that 67% of those who do not currently play a musical instrument said that they are likely to begin playing a real musical instrument in the next two years. The reports describing the survey do not give the number of respondents who do not currently play a musical instrument. a. Explain why it is important to know the number of respondents who do not currently play a musical instrument. b. Assume that half of the respondents do not currently play a musical instrument. Find the count of players who said that they are likely to begin playing a real
  • 5. musical instrument in the next two years. c. Give a 99% confidence interval for the population proportion who would say that they are likely to begin playing real musical instrument in the next two years. d. How would the result that you reported in part (c) change if only 25% of the respondents said that they do not currently play a musical instrument? e. Do the same calculations if 75% of the respondents said that they do not currently play a musical instrument? f. The main conclusion of the survey that appeared in many news stories was that 67% of players of Guitar Hero and Rock Band who do not currently play a musical instrument said that they are likely to begin playing a real musical instrument in the next two years. What can you conclude about the effect of the three scenarios [part c, d, and e] on the margin of error for the main result?
  • 6. 3. The average undergraduate GPA for American colleges and universities was estimated based on a sample of institutions that published this information. Here are the data for public schools in that report: Year 1992 1996 2002 2007 GPA 2.85 2.90 2.97 3.01 a. Find the equation of the least-squares regression line by hand or with a calculator for predicting GPA from year. Show your work. b. Verify your results with a software package. Show the output. c. Compute a 95% confidence interval for the slope by hand and interpret what this interval tells you about the increase in GPA over time. Show your work.
  • 7. ECO 480 Econometrics I Problem Set 5 Due: Monday, November 30, 2015 (beginning of the class) 3 4. A study that evaluated the effects of a reduction in exposure to traffic-related air pollutants compared respiratory symptoms of 283 residents of an area with congested streets with 165 residents in a similar area where the congestion was removed because a bypass was constructed. The symptoms of the residents of both areas were evaluated at baseline and again a year after the bypass was completed. For the residents of the congested streets, 17 reported that their symptoms of wheezing improved between baseline and one year later, while 35 of the residents of the bypass streets reported improvement. a. Find the two sample proportions. b. Report the difference in the proportions and the standard
  • 8. error of the difference. c. What are the appropriate null and alternative hypotheses for examining the question of interest? Be sure to explain your choice of the alternative hypothesis. d. Find the test statistic. Construct a sketch of the distribution of the test statistic under the assumption that the null hypothesis is true. Find the P-value and use your sketch to explain its meaning. e. Is no evidence of an effect the same as evidence that there is no effect? Use a 95% confidence interval to answer this question. Summarize your ideas in a way that could be understood by someone who has very little experience with statistics. 5. According to literature on brand loyalty, consumers who are loyal to a brand are likely to consistently select the same product. This type of consistency could come from a positive childhood association. To examine brand loyalty among fans of the Chicago Cubs, 371 Cubs fans among patrons of a
  • 9. restaurant located in Wrigleyville were surveyed prior to a game at Wrigley Field, the Cubs’ home field. The respondents were classified as “die-hard fans” or “less loyal fans.” Of the 134 die-hard fans, 90.3% reported that they had watched or listened to cubs games when they were children. Among the 237 less loyal fans, 67.9% said that they had watched or listened as children. a. Find the numbers of die-hard Cubs fans who watched or listened to games when they were children. Do the same for the less loyal fans. b. Use a significance test to compare the die-hard fans with the less loyal fans with respect to their childhood experiences relative to the team. c. Express the results with a 95% confidence interval for the difference in proportions.
  • 10. ECO 480 Econometrics I Problem Set 5 Due: Monday, November 30, 2015 (beginning of the class) 4 6. In a survey of 1430 undergraduate students, 1087 reported that they had one or more credit cards. Give a 95% confidence interval for the proportion of all college students who have at least one credit card. 7. The summary of the surveyed described in the question #6 reported that 43% of undergraduates reported that they had four or more credit cards. a. Give a 95% confidence interval for the proportion of all college students who have four or more credit cards. b. Would a 99% confidence interval be wider or narrower than the one that you found in part a? Verify your results by computing the interval.
  • 11. c. Would a 90% confidence interval be wider or narrower than the one that you found in part a? Verify your results by computing the interval. 8. Use the data in WAGE2.dta to estimate a simple regression explaining monthly salary(wage) in terms of IQ score (IQ). a. Find the average salary and average IQ in the sample. What is the sample standard deviation of IQ? (IQ scores are standardized so that the average in the population is 100 with a standard deviation equal to 15.) b. Estimate a simple regression model where a one-point increase in IQ changes wage by a constant dollar amount. Use this model to find the predicted increase in wage for an increase in IQ of 15 points. Does IQ explain most of the variation in wage? ? Is the coefficient statistically significantly different from zero at the 1% level? c. Now, estimate a model where each one-point increase in IQ has the same percentage effect on wage. If IQ increases by 15 points, what is the approximate percentage increase in predicted wage? Use the 95% confidence interval to conclude whether the
  • 12. coefficient statistically significantly different from zero at the 5% level and explain. 9. Use MEAP93.dta to explore the relationship between the math pass rate (math10) and spending per student (expend). math10 denote the percentage of tenth graders at a high school receiving a passing score on a standardized mathematics exam. Suppose we wish to estimate the effect of spending per student (expend) on student performance. If anything, we expect the spending per student to have a positive ceteris paribus (i.e., all other factors being equal) effect on performance because money can go toward purchasing more books and computers, hiring better qualified teachers, implementing nicer facilities, and so on. a. Do you think each additional dollar spent has the same effect on the pass rate, or does a diminishing effect seem more appropriate? Explain.
  • 13. ECO 480 Econometrics I Problem Set 5 Due: Monday, November 30, 2015 (beginning of the class) 5 b. In the population model math10 = β0 + β1log(expend) + u, argue that β1/10 is the percentage point change in math10 given a 10% increase in expend. c. Use the data in MEAP93.RAW to estimate the model from part (b). Report the estimated equation in the usual way, including the standard error, sample size and R-squared. d. Is the effect statistically significant at the 10, 5, and 5% level? Explain. e. Interpret the coefficient and the R-squared. f. How big is the estimated spending effect? Namely, if spending increases by 10%, what is the estimated percentage point increase in math10?
  • 14. g. One might worry that regression analysis can produce fitted values for math10 that are greater than 100. Why is this not much of a worry in this data set? [Hint: What is the largest value of math10?] Passenger and Cell Phone Conversations in Simulated Driving Frank A. Drews, Monisha Pasupathi, and David L. Strayer University of Utah This study examines how conversing with passengers in a vehicle differs from conversing on a cell phone while driving. We compared how well drivers were able to deal with the demands of driving when conversing on a cell phone, conversing with a passenger, and when driving without any distraction. In the conversation conditions, participants were instructed to converse with a friend about past experiences in which their life was threatened. The results show that the number of driving errors was highest in the cell phone condition; in passenger conversations more references were made to traffic, and the production rate of the driver and the complexity of speech of both interlocutors dropped in response to an increase in the demand of the traffic. The results indicate that passenger conversations differ from cell phone conversations because the surrounding traffic not only becomes a topic of the conversation, helping
  • 15. driver and passenger to share situation awareness, but the driving condition also has a direct influence on the complexity of the conversation, thereby mitigating the potential negative effects of a conversation on driving. Keywords: shared attention, driver distraction, cell phone conversation, passenger conversation Driving is a complex perceptual and cognitive task. There is ample evidence that driving performance is negatively affected by simultaneously conversing on a cell phone. Previous studies found that cell phone use impairs the driving performance of younger (Alm & Nilsson, 1995; Briem & Hedman, 1995; Brookhuis, De Vries, & De Waard, 1991; Brown, Tickner, & Simmonds, 1969; Goodman et al., 1999; McKnight & McKnight, 1993; Redelmeier & Tibshirani, 1997; Strayer, Drews, & Johnston, 2003; Strayer & Johnston, 2001), and older drivers (Alm & Nilsson, 1995; Strayer et al., 2003). These impairments have been studied using a wide range of methodological paradigms including computer-based tracking tasks (Strayer & Johnston, 2001), high-fidelity simulation (Strayer et al., 2003), driving of vehicles on a closed circuit (Treffner & Barrett, 2005), on-road studies (Crudall, Bains, Chap- man, & Underwood, 2005), and epidemiological studies of car crashes (McEvoy et al., 2005; Redelmeier & Tibshirani, 1997). The level of impairment is comparable to being intoxicated at a blood alcohol level of .08 (Strayer, Drews, & Crouch, 2006). Considering Distracted Driving Impairment With
  • 16. Greater Specificity To understand the implications of performing a secondary task while driving, it is useful to apply a conceptualization of the driving task that can guide the analysis of performance deficits. In his task analysis of driving, Groeger (1999) described three levels of performance (see Michon, 1979, 1985, for similar proposals). The first level of performance is an operational or control level, which involves elements that serve the task of keeping a vehicle on a predetermined course. A deficit at this level is shown, for example, in a reduction of lateral control, that is, the vehicle may drift to the side of the road. A number of studies demonstrated that this operational level is negatively affected by performing an additional task like conversing on a cell phone (Alm & Nilsson, 1995; Haigney & Westerman, 2001; Stein, Parseghian, & Allen, 1987). The second level of performance involves skills needed for maneuvering the vehicle in traffic. This level is called tactical behavior and examples for deficits at this level are approaching other vehicles too closely or ignoring approaching vehicles while turning left at an intersection. Studies that have found deficits on this level of driving performance describe changes in speed (Burns, Parkes, Burton, & Smith, 2002; Horberry, Anderson, Regan, Triggs, & Brown, 2006), changes in acceleration (Strayer & Drews, 2006), and delayed reaction times (Consiglio, Driscoll,
  • 17. Witte, & Berg, 2003) when drivers are engaged in a cell phone conversation. The characterization of driving behavior as “slug- gish” (Strayer et al., 2003) refers to both operational and tactical levels of driving behavior with driving performance changing such that drivers drive and accelerate slower and show longer reaction times when braking (see Drews & Strayer, 2008; Svenson & Patten, 2005, for reviews). The third level involves more executive, goal-directed aspects of driving and reflects strategic performance (Barkley, 2004). Exam- ples for problems at this level are failures in the execution of navigation tasks or trip-related planning tasks. Currently, there is only indirect evidence that deficits on this level can be observed when drivers converse on a cell phone. In their simulator study Ma and Kaber (2005) measured situation awareness—a precondition Frank A. Drews, Monisha Pasupathi, and David L. Strayer, Department of Psychology, University of Utah. Portions of the data presented in this paper have been previously presented at the Annual Human Factors and Ergonomics Conference and been published in the proceedings to this conference (for further reference, see Drews, Pasupathi, & Strayer, 2004). We thank two anonymous review- ers for their helpful comments that significantly improved this
  • 18. article. Correspondence concerning this article should be addressed to Frank A. Drews, Department of Psychology, University of Utah, 380 South 1530 East, Room 502, Salt Lake City, UT 84112. E-mail: [email protected] Journal of Experimental Psychology: Applied Copyright 2008 by the American Psychological Association 2008, Vol. 14, No. 4, 392– 400 1076-898X/08/$12.00 DOI: 10.1037/a0013119 392 for strategic performance— of drivers conversing on a cell phone while driving compared to a group using an adaptive cruise control system. The authors found that the use of a cell phone while driving significantly reduced driver situation awareness and sig- nificantly increased the perceived mental workload relative to no phone and adaptive cruise control conditions. The application of Groeger’s (1999) framework highlights a gap of empirical work investigating the strategic level of performance of drivers engaged in a cell phone conversation. Thus, at this point it is unclear if the deficits observed on the operational and tactical level also extend to the strategic level, or if this level of performance is unaffected by a cell phone conversation. Based on the assumptions of Michon
  • 19. (1979, 1985), lower level deficits ought to affect higher level performance, and we would expect the suggestive findings of Ma and Kaber to be evident in a task that is more representative of typical driving. Allocation of Attention and the Distracted Driver Most work on driver distraction focused on the assessment of the impairment rather than on a delineation of the cognitive mech- anisms underlying deficits in driving performance. The small number of studies that has focused on this theoretically important question point to a reduction in attention directed toward the driving task as partly responsible for the deficits. Strayer et al. (2003) examined the hypothesis that the observed impairment could be attributed to a withdrawal of attention from the visual scene resulting in a form of inattention blindness (i.e., a fixated object is not being processed resulting in either an incomplete or no mental representation of the object). Their findings indicated that cell phone conversations impaired both implicit and explicit recognition memory of visual information even when participants had fixated upon it. Strayer et al. suggested that the impairment of driving performance resulting from cell phone conversations is mediated, at least in part, by reduced attention to visual inputs in the driving environment. More evidence was presented recently by Strayer and Drews (2007) demonstrating a reduction in the ampli- tude of the P300 as a result of a cell phone conversation in
  • 20. response to the onset of braking lights of a car that had to be followed. The P300 component of event-related brain potentials (ERP) is sensitive to the attention that is allocated to a task (Sirevaag, Kramer, Coles, & Donchin, 1989), and has been shown to allow discrimination between levels of task difficulty, decreas- ing as the task demand increases (Kramer, Sirevaag, & Braun, 1987). Finally, more evidence for deficits in allocation of attention comes from investigations of scanning behavior of traffic scenes. McCarley et al. (2004) showed that conversations result in higher error rates for change detection and higher numbers of saccades to locate a changing item. The authors also found reduced fixation times under dual-task conditions and interpret this as evidence that a conversation while scanning traffic scenes impacts the peripheral guidance of attention. To summarize, the allocation of attention to the driving task is central to the issues related to driving performance deficits ob- served in the context of cell phone use. Thus, the literature appears to suggest that nearly any task that diverts attention away from the driving task will cause impairment. Indeed, supporting this asser- tion are epidemiological studies (see McEvoy et al., 2005; Re- delmeier & Tibshirani, 1997) that indicate that the relative risk of being in a motor vehicle accident quadruples when a driver con-
  • 21. verses on a cell phone (i.e., odds ratio of an accident when conversing on a cell phone is 4.2). By contrast, other epidemio- logical studies (Rueda-Domingo et al., 2004; see also Vollrath, Meilinger & Krüger, 2002) have found a strikingly different pat- tern for situations in which an adult passenger is in the vehicle. In particular, when drivers have a passenger in the vehicle, the relative risk of a motor vehicle accident is lower than when the driver drives by him or her self (i.e., the odds ratio of an accident with a passenger in the vehicle is 0.7). Given that in many instances the passenger and the driver are conversing, these find- ings appear to be at odds with the suggestion that any task that diverts attention away from driving causes impairment. What accounts for the seemingly paradoxical finding that a conversation on a cell phone interferes with driving, whereas having a conver- sation with a passenger in the vehicle improves driving perfor- mance? Are differences in the allocation of attention partly respon- sible for these differences? How passenger and cell phone conversations differ in their implications for attention and driving performance is a question of theoretical and applied importance. It is of theoretical importance because a comparison between cell phone and passenger conver- sation revolves around the similarities or differences between the two contexts’ impact on the attentional resources of a driver. In this paper we suggest that the different contexts affect the ability
  • 22. to allocate attention to a task differently, that is, the allocation of attention is not independent of contextual variables, even if the task at the onset seems identical. The question is also of applied importance because it may help to understand better what contexts have an impact on a driver’s ability to allocate attention to the task of driving. Conversing From one vantage point a conversation is a conversation. Con- versations require attention from their participants for monitoring the topic and content, coordinating turn taking, and so on (Clark, 1996). Thus, all conversations are presumably diverting attention from a driving task and should create at least some impairment. An alternative perspective, drawn from psycholinguistics, em- phasizes conversations as joint activities that involve shared atten- tion from all participants, and as dynamic activities that unfold over time (Clark, 1996). This perspective emphasizes that partic- ipants in a conversation move forward in the joint activity of conversing by adding to their shared understandings of what is being talked about. This process is called grounding (Clark & Schaefer, 1989) and it involves establishing that all parties in a conversation share relevant knowledge, beliefs, and assumptions. It also includes awareness of the current context that provides many cues that can aid in grounding, such as shared visual atten-
  • 23. tion (Richardson, Dale, & Kirkham, 2007) and shared awareness of distractions. The critical difference between a cell phone con- versation and an in-vehicle conversation revolves around this shared awareness of the driving context. That shared awareness leads to the prediction that in-vehicle conversation will not have the same detrimental impact on driving performance that cell phone conversations have. It also opens the possibility for in- vehicle conversation to have a positive impact on driving perfor- mance, as is suggested by epidemiological data. Moreover, in 393CONVERSATIONS IN SIMULATED DRIVING pointing to conversation as a joint activity unfolding over time, it suggests two nonexclusive proposals about how conversations affect the allocation of the driver’s attention to the driving task. One is simply that an in-vehicle passenger responds to the de- mands of the driving context by reducing demand for the conver- sation task (e.g., by changing the production rate—a modulation hypothesis, see Gugerty, Rakauskas, & Brooks, 2004). The second is that the passenger adopts the driving task as part of the overall joint activity in which driver and passenger are mutually engaged. In both cases, the assumption is that this is not likely or possible for a cell phone conversational partner because they do not have direct access to the real-time driving conditions. Another point about this perspective on conversation bears
  • 24. mention, and it is that many tasks employed to simulate conver- sation in studies of cell phone use while driving suffer from serious ecological validity concerns. Some investigators used putative conversations in which the participants and a confederate alter- nately generated a word and the other person had to generate a word that began with the last letter of the previous spoken word (Gugerty et al., 2004). Treffner and Barrett (2004) had participants perform summations or categorizations. Others identified topics of interest for the participant by questionnaire and had an experi- menter converse with the participant about such topics (Strayer et al., 2003). These approaches are limited because they fail, to a larger or smaller extent, to mimic the coordinated, joint activity features of naturalistic conversations. In a meta-analysis, Horrey and Wickens (2006) found that more naturalistic conversations produced greater interference with driving than did more “syn- thetic” information processing tasks, suggesting a greater engage- ment for the former. Although not a central aim of this study, we made a serious effort to develop a conversational task that was truly applicable to the applied context. Following Bavelas, Coates, and Johnson (2000), close-call stories as the topic of the conver- sation were used in studying the impact of conversations on driving. Bavelas et al. defined close-call stories as stories about times when your life was threatened. The advantage of using such close-call conversations is that they involve the kinds of stories that are often told among friends and produce a conversation that
  • 25. is engaging. In addition, unlike in other studies in which at least one of the partners of the conversation was a confederate, we asked participants to bring friends with the intention of having them converse about previously untold close-call stories. Few authors have studied how passenger conversations affect driv- ing performance. In their on road study, Crundall et al. (2005) pro- vided initial evidence that passenger and driver responded to changes in the cognitive demand of driving when playing a “competitive [word] game between driver and the partner” (Crundall et al., 2005, p. 201) that simulated a conversation. For example, passenger conversations were suppressed during more demanding urban driving and there was no impact of the driving context on the conversation during cell phone conversations. It appears as if the cell phone task imposed a cognitive load independent of the cognitive demand resulting from the driving conditions, making it likely that the driver’s cognitive limits were exceeded. Gugerty et al. (2004) investigated the impact of passenger conversations on driving performance in a low-fidelity driving simulator. To simulate a conversation the authors used a word game task in which the participants took turns saying words with the constraint that a new word had to begin with the last letter of the word spoken by the partner. Gugerty et al. tested driving performance by assessing the driver’s situation awareness for the surrounding traffic but also measured performance on the verbal
  • 26. task. Overall there was no evidence that passengers slowed the verbal task more than remotely communicating participants, and in Experiment 1 the opposite effect was found, despite the fact that only the passengers shared visual information about the driving conditions. Also, the verbal interaction negatively affected situa- tion awareness in both the passenger and the cell phone condition, equally impacting a precursor for strategic performance. More interesting, Amado and Ulupinar (2005) reported a neg- ative impact of passenger conversation on a driving surrogate: The authors compared the impact of a hands-free cell phone conver- sation, a passenger conversation, and a control condition on atten- tion in a peripheral detection task that simulated driving. To simulate the cognitive demand of a conversation, the authors asked participants questions of low or high complexity. Both simulated conversation conditions had a similar negative impact on perfor- mance in a peripheral detection task as compared to the control condition. The lack of a difference between the cell phone con- versation condition and the passenger conversation condition is notable. One potential reason for the absence of a difference is that in this study the conversation pace was kept constant artificially not allowing for modulation. Moreover, the perceptual detection task is much less complex than the driving task, indicating data limits in this study. The limited literature on cell phone and passenger conversa- tions suggests that modulation (i.e., slowing) of a conversation
  • 27. is possible, and may occur under natural driving conditions. However, one of the problems of the existing studies is that the conversations were highly scripted and often simulated only the cognitive demand of a conversation. Driving performance seems to be affected by passenger conversations by reduced situation awareness and a reduction in the ability to detect peripheral objects. It appears that there is no difference between passenger conversations compared to remote conversations in their negative impact on driving performance. In the present paper we examined the impact of cell phone and passenger conversations on driving performance, applying Groeger’s (1999) conceptualization to guide the operationalization of driving. Consequently, we used measures of driving perfor- mance that reflect the operational, the tactical, and the strategic level of driving behavior. In addition, we examined features of the conversation that shed light on how conversations on cell phones and conversations with a passenger differ in ways that bear on attention allocation. We hypothesize that a passenger—provided he or she has at least minimal driving expertise—monitors the driving environment. Consequently, when a driver faces an in- creasing demand of the driving task, both passenger and driver may respond by reducing the cognitive demand of the conversa- tion. These changes can manifest themselves in switching the topic of the conversation to the driving conditions and the surrounding traffic (e.g., by pointing out potential hazards) that directs the driver’s attention toward the surrounding traffic. Also, it is possi- ble that a reduction of the production rate of speech or its com- plexity reflects a response to increases in the cognitive demand for
  • 28. the driver. In sum, the goal of this research is to increase our understanding of how conversing on a cell phone while driving compares with 394 DREWS, PASUPATHI, AND STRAYER conversing with a passenger while driving. This research uses naturalistic conversations and measures driving performance at the operational, tactical, and strategic levels, and also focuses on measures that reflect changes in the dynamics of the conversation. Method Participants Ninety six adults were recruited in a total of 48 friend dyads and received course credit for participation. Participants ranged in age from 18 to 49 with 20 being the average age. Forty-seven partic- ipants were women and 49 participants were men. All participants had normal or corrected-to-normal visual acuity, normal color vision (Ishihara, 1993), and a valid Utah driver’s license. Stimuli and Apparatus A PatrolSim™ high-fidelity driving simulator, manufactured by L3 Communications I-Sim (Salt Lake City, UT, USA) was used
  • 29. in the present study (see Figure 1). The simulated vehicle is based on the vehicle dynamics of a Crown Victoria® model with automatic transition built by the Ford Motor Company. A freeway road database simulated a 24-mile multilane beltway with on- and off-ramps, overpasses, and two-lane traffic in each direction. Participants were driving under an irregular-flow driv- ing condition (Drews, Strayer, Uchino, & Smith, in press). The irregular-flow driving condition can be characterized as a situation in which other vehicles, in compliance with traffic laws, changed lanes and speeds. This traffic requires the participant to pay atten- tion to the surrounding traffic as opposed to a situation in which the driver can minimize the attentional requirements and the cog- nitive demand by driving exclusively in one lane of travel. In addition, slow-moving vehicles were sometimes unsuccessfully attempting to pass vehicles on the left side, significantly slowing down the overall traffic flow. The speed limit was 65 mph. Visibility in all scenarios was optimal. Procedure After providing informed consent, participants were familiar- ized with the driving simulator using a standardized 15-min adap- tation sequence. The adaptation sequence consisted of three 5- min
  • 30. driving scenarios, one being located in a rural area at night, another one located in a downtown area, involving some minimal naviga- tion around traffic barricades, and a final scenario located on a highway with optimal driving conditions at daytime. After famil- iarization, one participant of a dyad was randomly selected to drive the vehicle, the other, based on experimental condition, was either the passenger or talking on the cell phone to the driver from a different location. The assignment of speaker and listener was counterbalanced over driver and nondriving interlocutor, and the speaker provided the close-call story. Participants were instructed to provide a story they had not shared with the partner in the past. In the single-task condition, the driver was instructed to drive safely and to follow all the traffic rules. In addition, in the dual- task condition they were instructed that their task was having a conversation about a close-call story with their friend who was either seated next to them as a passenger or conversing on a cell phone. Finally, the drivers were instructed to leave the highway once they arrived at a rest area located approximately eight miles after the beginning of the drive. The passenger/cell phone inter- locutor was instructed to participate actively in the conversation and told that the driver had the task of leaving the highway when approaching a rest area. In the dual-task portion of the experiment, half of the driving participants were either conversing on a cell phone or talking to a passenger while driving; in the single-task
  • 31. condition, participants were driving only. The order of the single and dual-task conditions was counterbalanced and the assignment to cell phone and in-person conversation was randomized. The individual driving sequences (single/dual task) took about 10 min to finish. The entire experiment took approximately 60 min to completion. Measures Driving performance. Multiple measures of driving perfor- mance were taken, distinguishing between measures dealing with the operational level, the tactical level, and those reflecting more strategic processes involved in driving. A measure of the opera- tional level was how well participants stayed in the center of the lane without lateral movements and drifting. For this purpose, we defined the lane center of the road and calculated the root mean standard error (RMSE) between center and the center position of the car. On the tactical level, we analyzed speed and following distance. Speed was measured as the average speed of the driver for the road segment they were driving until they reached the rest area exit, whereas following distance was measured as the average distance between the driver’s car and a car that was directly ahead of them. On the strategic level of performance we were interested in participants’ ability to follow the instruction of a navigation task—more specifically— did they take the correct exit?
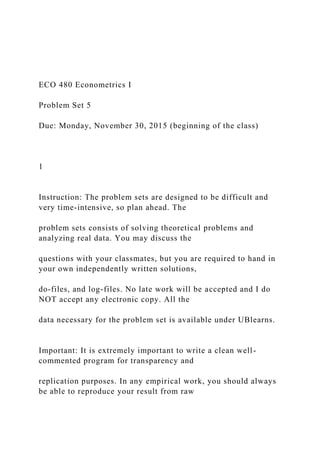
  • 32. Conversation. The transcribed conversations between interlocu- tors in the dual-task conditions were coded by two independent Navigation task 0 5 10 15 20 25 enohp llecregnessap n u m b er o f p ar ti ci
  • 33. p an ts s u cc ee d in g Figure 1. Frequency of successful task completion in the navigation task. 395CONVERSATIONS IN SIMULATED DRIVING coders. Though the instruction for participants was for one person to tell a story about close calls, in all cases after a short time both participants were lively engaged in the conversation. The coding of the conversations focused on the number of references to traffic, intercoder-reliability Pearson’s r(47) � .92; who initiated the reference (driver and nondriver; Cohen’s kappa(47) � 1), and the number of turn takes with reference to the traffic event after a
  • 34. reference to traffic was made, intercoder-reliability Pearson’s r(47) � .98. All conversations were analyzed from transcripts of the conversations by trained coders who were blind to the condi- tion under which the conversation took place. The rationale for analyzing traffic references was that referring to the surrounding traffic is an attempt to create shared situation awareness and indicates support for the driving task. The number of turn takes after a reference to traffic was made was analyzed because it is a reflection of the willingness of both partners to engage in a conversation about traffic rather than the close-call story. Included in this analysis were only turn takes with state- ments about the event that provoked the initial traffic reference. A second analysis focused on the impact of the driving envi- ronment. Because the impact on driving has been well documented in the past (e.g., Brookhuis et al., 1991) this analysis focuses on the impact of traffic complexity on the conversation. For this purpose two independent coders coded the traffic as low or moderately demanding, intercoder-reliability Cohen’s kappa(47) � .98. Low demanding traffic was defined as a situation in which the partic- ipant’s vehicle was surrounded by maximally one vehicle (either in front, behind, or on the left lane), in which a situation of moder- ately demanding traffic involved more than one other vehicle in close proximity to the participant’s vehicle. For both types of driving situations, the speech production rate of the driver and the interlocutor in syllables per second was analyzed. The
  • 35. production rate of the driver and the passenger in this context reflects the degree to which the cognitive demand imposed by the traffic context has an impact on the conversation, potentially leading to some modulation of the conversation (see Berthold, 1998; Müller, Gro�mann-Hutter, Jameson, Rummer, & Wittig, 2001). As an additional measure, the number of syllables per word for the driver and the interlocutor was analyzed. The number of syllables per word is thought to measure the complexity of an utterance (Berthold, 1998). Production rate and complexity of utterance are used to test the hypothesis that both conversation partners in the passenger condition adjust their conversation in response to changes in the cognitive demand of the traffic imposed on the driver, reflecting implicit collaboration on the driving task (see Crundall et al., 2005). Due to the lack of situation awareness of the interlocutor on a cell phone, modulation is unlikely in the cell phone condition. Design The design of the study was a between-subject design with dual-task condition (cell phone vs. passenger conversation) as a between-subjects factor. Each participant’s driving performance was also assessed in the single-task condition (driving only). To control for any between-subject variability we analyzed driving behavior using the difference scores between single- and dual- task performance for each participant. Results
  • 36. Driving Performance The following analyses of driving performance include data from 41 dyads (21 passenger conversation) due to technical prob- lems with data collection in the driving simulator. Counterbalanc- ing of the task order for both conditions was not affected by this data loss, because these dyads had identical task sequences. All of the following driving performance analyses that compare the cell phone and passenger conversation use difference scores between the single- and dual-task condition for each participant, thus re- flecting the difference in impact of the two dual-task conditions. The use of difference scores was indicated because the initial analyses revealed some minor differences in single-task driving performance between groups (see Table 1). Analyses of the de- mographic variables revealed that the average age of driving participants in the cell phone condition was 19.6 years (range 18 to 23) and in the passenger condition was 20.1 years (range 18 to 26). In the cell phone condition, 10 female and 10 male drivers partic- ipated, whereas in the passenger conversation condition, 11 female and 10 male drivers participated. Thus, it is possible that the initial differences in driving performance as reported in Table 1 can be attributed to slight differences in driving experience. Operational level of driving performance. The first analysis focused on the drivers’ ability to stay in the center of the lane
  • 37. without drifting sideways. Focusing on the RMSE between actual vehicle position and center of the lane, we analyzed the differences between cell phone and passenger conversation condition using a Table 1 Means and Standard Deviations for Lane Keeping, Driving Speed, and Distance for Both Experimental Conditions and Single and Dual Task Passenger Cell phone Single task Dual task Single task Dual task M (SD) M (SD) M (SD) M (SD) Lane keeping (RMSE) 0.4 (0.8) 0.4 (1.0) 0.5 (0.5) 1.0 (0.9) Mean speed (mph) 63.8 (4.2) 63.9 (3.8) 65.8 (3.5) 65.9 (3.7) Mean distance (meters) 72.3 (27.4) 62.1 (21.0) 63.9 (17.8) 85.3 (47.0) Note. RMSE � root mean standard error; mph � miles per hour. 396 DREWS, PASUPATHI, AND STRAYER t test. The analysis revealed a significant difference between con- ditions, t(39) � �2.1, p � .05, Cohen’s d � 0.7, with drivers showing a more pronounced tendency to drift during cell phone conversations compared to the passenger conversation condition (see Table 1).
  • 38. Tactical level of driving performance. We used a t test iden- tical to the one described above to analyze the differences for average speed. The analyses revealed no changes in driving speed, t(39) � .1 in both conditions (see Table 1). The next analysis focused on the distance drivers kept between their own vehicle and vehicles ahead of them. The t test revealed a significant difference between the two conditions, t(39) � 2.4, p � .05, Cohen’s d � 0.8, with following distance being greater in the cell phone condition (see Table 1). Strategic level of driving performance: Navigation. The last part of the analysis of driving performance focused on behavior on the strategic level (i.e., successfully accomplishing the driving task by exiting the highway at the rest area). Figure 2 shows the number of participants who finished the task successfully. Analyzing task completion for cell phone conversation and passenger conversa- tion condition revealed a difference between the two conditions, �2(1, N � 40) � 7.9, p � .05, w � 0.6: drivers in the cell phone condition were four times more likely to fail task completion than drivers in the passenger condition. Conversation References to traffic and turn taking. The transcripts of the conversations were analyzed for references to traffic and number of
  • 39. turns taken following an initial traffic reference that still centered on the traffic topic. The latter indicates the extent to which the driving task became a conversational topic in its own right, temporarily superseding the close-call stories. The number of traffic references in the passenger conversation condition and the cell phone con- versation condition are shown in Table 2. Clearly, fewer references to traffic were made in the cell phone condition, t(46) � 3.0, p � .01, Cohen’s d � 0.9. To determine who initiated the reference to traffic, we analyzed the number of initializations made in the cell phone conversation condition and the passenger conversing condition using t tests. The number of references by the driver did not differ, t(46) � 1.7, p � .1, although there was a reliable difference in the number of references initiated by the nondriving interlocutor, t(46) � 2.4, p � .05, Cohen’s d � 0.7; with fewer references initiated in the cell phone condition. The next analysis focused on the number of turns between the interlocutors who continued conversing about traffic after an initial reference to traffic was made. The number of turns for both conditions is shown in Table 2. Overall more than twice as many turns occurred in the passenger condition as compared to the cell phone condition, t(46) � 3.4, p � .01, Cohen’s d � 1.0.
  • 40. Production rate and complexity of speech. The final analyses focused on the production rate of the driver and interlocutor and the complexity of their speech (see Table 3) as a function of the demand of the driving conditions. Because driving condition (low and moderate demand) is added to the analyses as independent variable analyses of variance (ANOVA) were performed. In mod- erately demanding driving conditions, the production rate of the driver decreased when talking to a passenger but increased when talking on a cell phone as indicated by a significant interaction between driving condition and conversation condition, F(1, 39) � 4.3, p � .05, partial �2 � 0.1. No differences were observed in the nondriving interlocutors production rates for conversation condi- tion, demand, and the interaction (the F values for the main effects and the interaction were all � .16 and effect sizes, partial �2 � .03). Analyzing the complexity of speech indicated that both driver, F(1, 43) � 5.5, p � .05, partial �2 � 0.1 and interlocutor, F(1, 43) � 4.8; p � .05; partial �2 � 0.1, responded to an increase in the cognitive demand of driving by reducing the number of syllables per word. Neither the main effect of conversation con- dition nor the interaction reached significance. Discussion The present study investigated how conversing with a passenger differs from talking on a hands-free cell phone in terms of its impact on driving performance at the operational, tactical, and
  • 41. strategic level and how the dynamics of the conversations are affected by contextual factors elicited by the driving task. Michon (1979, 1985) suggested that lower level deficits of driving behavior ought to affect higher level performance. The present study provides evidence in support of this hypothesis under dual- tasking conditions. For the cell phone condition, the data suggest that deficits on lower levels of driving behavior also are present (though in different form) at higher levels. For example, drivers conversing on a cell phone showed more lane keeping variability (operational level) than participants conversing with a passenger. Figure 2. Participant talking on a cell phone in the I-Sim driving simulator. Table 2 Means and Standard Deviations of References to Traffic and Turns for Both Experimental Conditions Passenger Cell phone M (SD) M (SD) References 3.8 (2.4) 2.1 (1.6) Turns at speech 19.2 (13.8) 8.6 (6.7) 397CONVERSATIONS IN SIMULATED DRIVING
  • 42. Similarly, on the tactical level, cell phone drivers do differ from participants in the passenger condition on some measures (e.g., changes in following distance). However, no changes in driving speed were observed in the dual-task condition, seemingly at odds with previous findings of slower driving cell phone drivers (e.g., Strayer & Drews, 2007; Strayer et al., 2003). One explanation for this discrepancy could be procedural differences, with studies demonstrating slower driving speed using a car following para- digm as opposed to the free driving paradigm that was used here. On the strategic level of performance, cell phone drivers per- formed poorly at the navigation task. Two nonmutually exclusive explanations can be provided for this deficit: First, drivers con- versing on a cell phone may experience problems with keeping the intention of exiting at the rest area in working memory, or second, drivers may not sufficiently process information from the driving environment (exit signs). Some support for the latter hypothesis comes from studies demonstrating inattention blindness in cell phone drivers (Strayer et al., 2003). The performance of partici- pants in the passenger conversation condition indicates that these drivers may have paid more attention to the navigation task, partly due to the passenger. Indeed, examination of the video taped driving segments found several instances in which the passenger helped the driver navigate to the rest area.
  • 43. Overall, the study clearly documents that relative to a driving only condition, cell phone use negatively impacts lane keeping, increases the headway and leads to an impairment in a navigation task while passenger conversations have only little effect on all of the three measures. Contrary to prior suggestions (e.g., Crundall et al., 2005; Gugerty, Rando, Rakauskas, Brooks, & Olson, 2003), we did not find evidence that in-vehicle drivers and passengers were better able to modulate their production speed to match changes in the complexity of the driving task. Instead, we found some evidence of modulation of the complexity of speech, indicated by syllables- per-word, in response to the demand of the driving task. Thus, the present findings suggest a process of modulation, but this process is not tied to production rate as it is in the original proposal of Gugerty et al. (2003). Contrary to Gugerty et al. this study reports an increase in performance on the strategic level in the passenger condition, which should not have been observed if situation aware- ness had been negatively affected in both conversation conditions. Also, quite surprisingly drivers conversing on the cell phone increased their production rate when talking on the cell phone, which is contrary to the predictions of the modulation hypothesis. More interesting, this happened even as those drivers in the pas- senger condition tended to reduce their production rate.
  • 44. Some of the differences in findings may be explained by im- portant methodological differences related to the study of conver- sation behavior in the context of driving. To realistically measure the impact of a conversation on driving performance, tasks that are not conversation tasks but traditional information processing tasks may miss central compensatory mechanisms of conversations, thus underestimating a conversations complex nature. Also, the use of low-fidelity simulations in passenger conversations may have a significant impact on the process of grounding in a conversation, thereby not reflecting a conversation’s context that is central for processes of allocation of attention. One issue in naturalistic con- versation revolves around managing turn-taking—and these dif- ferential changes in production rates for drivers, changes that depended on the nature of the conversation—may reflect differ- ences in how participants attempted to manage turn-taking. Drivers on cell phones may have attempted to dominate the conversation to avoid having to engage in speech comprehension, whereas with in-vehicle partners, it may be easier to relinquish control, given that the partner can be relied on to accommodate with his or her contributions. The conversation data suggest that passengers take an active role in supporting the driver as indicated by passengers more frequently talking about the surrounding traffic. It seems likely
  • 45. that a passenger supports the driver by directing attention to the sur- rounding traffic when perceived necessary. As mentioned above, this conclusion is also supported by the analysis of the video recordings (in some cases passengers mentioned the exit sign or pointed to the exit). Thus, the higher driving performance in the passenger condition is due in part to the shared situation awareness between driver and passenger due to grounding. This interpretation is also supported by the reliable difference in traffic references initiated by the passenger and the cell phone interlocutor. In addition, the results provide evidence for even more subtle support between interlocutors. In both dual-task conditions, there is evidence that interlocutors respond to an increase in the cogni- tive demand from the driving context by reducing the complexity of their utterances. This difference seems to be driven by changes in the complexity of utterances by the driver because the conver- sation partner on the cell phone cannot be aware of changes in the driving environment. Table 3 Means and Standard Deviations for Production and Complexity for Driver and Passenger in Both Experimental Conditions and Low Demand and Moderate Demand Driving Scenarios Passenger Cell phone
  • 46. Low demand Moderate demand Low demand Moderate demand M (SD) M (SD) M (SD) M (SD) Driver Productiona 4.1 (1.0) 3.6 (1.0) 3.8 (0.9) 4.2 (1.8) Complexityb 1.3 (0.2) 1.1 (0.3) 1.2 (0.1) 1.0 (0.4) Passenger Productiona 3.7 (1.6) 4.0 (1.2) 3.8 (1.4) 3.6 (0.9) Complexityb 1.2 (0.1) 1.1 (0.3) 1.3 (0.2) 1.1 (0.4) a Given in syllable per second. b Given in syllable per word. 398 DREWS, PASUPATHI, AND STRAYER The results also draw an intriguing picture about the allocation of attention under dual-tasking conditions: Two similar situations with identical tasks and instructions lead to fundamentally differ- ent performance outcomes indicating that contextual variables can have a significant impact on overall performance. The present findings are of theoretical and applied importance. On the theoretical side they raise general questions about how much current models of attention predict performance of dyads or groups in complex environments with regard to the allocation of attention (see Cooke, Salas, Cannon-Bowers, & Stout, 2000). Models of attention traditionally focus on individuals; however, conceptualizing shared attention is of importance for any general theory of attention. Of more specific theoretical importance
  • 47. here, is the question of the mechanisms involved in the above processes: Does a passenger just provide cues that help to optimize the allocation of attention or does the passenger qualitatively change the way that a driver allocates attention, thereby creating a form of joint or distributed attention? On the practical side, the findings allow predictions about how contexts can negatively affect dual-task performance. On one hand, passengers not engaged in the driving task either because they are not able to direct the attention of the driver toward traffic, or do not know how to identify important events in the driving environment (e.g., children in the vehicle) have a potentially negative impact on driving performance. On the other hand, it is possible that overengagement can also have a potentially negative impact. For example a passenger who is too “supportive” by constantly commenting and directing attention in an overcontrol- ling fashion has a potentially negative impact on performance. In conclusion, the data indicate that cell phone and passenger conversation differ in their impact on a driver’s performance and that these differences are apparent at the operational, tac- tical, and strategic levels of performance. The difference be- tween these two modes of communication stems in large part from the changes in the difference in the structure of cell phone and passenger conversation and the degree to which the con- versing dyad shares attention. References
  • 48. Alm, H., & Nilsson, L. (1995). The effects of a mobile telephone task on driver behaviour in a car following situation. Accident Analysis & Prevention, 27, 707–715. Amado, S., & Ulupinar, P. (2005). The effects of conversation on attention and peripheral detection: Is talking with a passenger and talking on the cell phone different? Transportation Research Part F: Traffic Psychol- ogy and Behaviour, 8, 383–395. Barkley, R. A. (2004). Driving impairments in teens and adults with attention-deficit/hyperactivity disorder. Psychiatric Clinics of North America, 27, 233–260. Bavelas, J. B., Coates, L., & Johnson, T. (2000). Listeners as co-narrators. Journal of Personality and Social Psychology, 79, 941–952. Berthold, A. (1998). Representation und Verarbeitung sprachlicher In- dikatoren fuer kognitive Ressourcenbeschraenkungen (Representation and processing of language-based indicators for cognitive resource lim- itations). Unpublished master’s thesis. University of Saarbruecken, Saar- bruecken, Germany. Briem, V., & Hedman, L. R. (1995). Behavioural effects of mobile tele-
  • 49. phone use during simulated driving. Ergonomics, 38, 2536 – 2562. Brookhuis, K. A., De Vries, G., & De Waard, D. (1991). The effects of mobile telephoning on driving performance. Accident Analysis & Pre- vention, 23, 309 –316. Brown, I. D., Tickner, A. H., & Simmonds, D. C. V., (1969), Interference between concurrent tasks of driving and telephoning, Journal of Applied Psychology, 5, 419 – 431. Burns, P. C., Parkes, A., Burton, S., & Smith, R. K., (2002). How dangerous is driving with a mobile phone? Benchmarking the impair- ment to alcohol. TRL Report 547. Berkshire, England: Transport Re- search Laboratory. Clark, H. H. (1996). Using language. Cambridge, England: Cambridge University Press. Clark, H. H., &. Schaefer, E. F. (1989). Contributing to discourse. Cog- nitive Science, 13, 259 –294. Consiglio, W., Driscoll, P., Witte, M., & Berg, W. P. (2003). Effect of cellular telephone conversations and other potential interference on
  • 50. reaction time in a braking response. Accident Analysis & Prevention, 35, 495–500. Cooke, N. J., Salas, E., Cannon-Bowers, J. A., & Stout, R. (2000). Mea- suring team knowledge. Human Factors, 42, 151–173. Crundall, D., Bains, M., Chapman, P., & Underwood, G. (2005). Regulat- ing conversation during driving: A problem for mobile telephone? Transportation Research Part F: Traffic Psychology and Behaviour, 8, 197–211. Drews, F. A., Pasupathi, M., & Strayer, D. L. (2004). Passenger and cell-phone conversations in simulated driving. Proceedings of the 48nd Annual Meeting of the Human Factors and Ergonomics Society, 1, 2210 –2212. Drews, F. A., & Strayer, D. L. (2008). Mobile phones. In M. Regan, J. D. Lee, & K. Young (Eds.), Driver distraction: Theory, effects and miti- gation (pp 169 –189). CRC. Drews, F. A., Strayer, D. L., Uchino, B. N., & Smith, T. W. (in press). On the fast lane to road rage. In A. G. Gale, S. P. Taylor, & C. Castro (Eds.), Vision in vehicles X. Amsterdam, Netherlands: Elsevier.
  • 51. Goodman, M. F., Bents, F. D., Tijerina, L., Wierwille, W., Lerner, N., & Benel, D. (1999). An investigation of the safety implications of wireless communication in vehicles. Report summary. Report summary available at http://www.nhtsa.dot.gov/people/injury/research/wireless/#rep Groeger, J. A. (1999). Expectancy and control: Perceptual and cognitive aspects of the driving task. In P. A. Hancock (Ed.), Human performance and ergonomics. San Diego, CA: Academic. Gugerty, L., Rakauskas, M., & Brooks, J. (2004). Effects of remote and in-person verbal interactions on verbalization rates and attention to dynamic spatial scenes. Accident Analysis & Prevention, 36, 1029 – 1043. Gugerty, L., Rando, C., Rakauskas, M., Brooks, J., & Olson, H., (2003). Differences in remote versus in-person communications while perform- ing a driving task. Proceedings of the 47th Annual Meeting of the Human Factors and Ergonomics Society, 1, 1855–1859. Haigney, D. E., & Westerman, S. J. (2001). Mobile (cellular) phone use and driving: A critical review of research methodology. Ergonomics, 44, 132–148.
  • 52. Horberry, T., Anderson, J., Regan, M. A., Triggs, T. J., & Brown, J. (2006). Driver distraction: The effects of concurrent in-vehicle tasks, road en- vironment complexity and age on driving performance. Accident Anal- ysis & Prevention, 38, 185. Horrey, W. J., & Wickens, C. D. (2006). Examining the impact of cell phone conversations on driving using meta-analytic techniques. Human Factors, 48, 196 –205. Ishihara, S. (1993). Ishihara’s test for color-blindness. Tokyo: Kanehara. Kramer, A. F., Sirevaag, E. J., & Braun, R. (1987). A psychophysiological assessment of operator workload during simulated flight missions. Hu- man Factors, 29, 145–160. Ma, R., & Kaber, D. B. (2005). Situation awareness and workload in driving while using adaptive cruise control and a cell phone. Interna- tional Journal of Industrial Ergonomics, 35, 939 –953. 399CONVERSATIONS IN SIMULATED DRIVING McCarley, J. S., Vais, M. J., Pringle, H., Kramer, A. F., Irwin, D. E., & Strayer, D. L. (2004). Conversation disrupts change detection in
  • 53. com- plex traffic scenes. Human Factors, 46, 424 – 436. McEvoy, S. P., Stevenson, M. R., McCartt, A. T., Woodward, M., Haworth, C. Palamara, P., et al. (2005). Role of mobile phones in motor vehicle crashes resulting in hospital attendance: A case- crossover study. British Journal of Medicine, 331, 428 – 434. McKnight, A. J., & McKnight, A. S. (1993). The effect of cellular phone use upon driver attention. Accident Analysis & Prevention, 25, 259 –265. Michon, J. A. (1979). Dealing with danger (Traffic Safety Research Center, Report No. VK–79 –1). State University, Groningen, The Netherlands. Michon, J. A. (1985). A critical review of driver behavior models: What we do know, what should we do? In L. Evans & R. C. Schwing (Eds.), Human behavior and traffic safety. New York: Plenum. Müller, C., Gro�mann-Hutter, B., Jameson, A., Rummer, R., & Wittig, F. (2001). Recognizing time pressure and cognitive load on the basis of speech: An experimental study. In M. Bauer, P. J. Gmytrasiewicz, & J. Vassileva (Eds.). User modelling (pp. 24 –33). Berlin, Germany:
  • 54. Springer. Redelmeier, D. A., & Tibshirani, R. J. (1997). Association between cellular-telephone calls and motor vehicle collisions. The New England Journal of Medicine, 336, 453– 458. Reuda-Domingo, T., Lardelli-Claret, P., Luna-del-Castillo Jde, D., Jiménez-Moleón, J. J., Garcı́a-Martı́n, M., & Bueno-Cavanillas, A. (2004). The influence of passengers on the risk of the driver causing a car collision in Spain: Analysis of collisions from 1990 to 1999. Acci- dent Analysis & Prevention, 36, 481– 489. Richardson, D. C., Dale, R., & Kirkham, N. Z. (2007). The art of conver- sation is coordination. Psychological Science, 18, 407– 413. Sirevaag, E. J., Kramer, A. F., Coles, M. G., & Donchin, E. (1989). Resource reciprocity: An event-related brain potentials analysis. Acta Psychologica, 70, 77–97. Stein, A. C., Parseghian, Z., & Allen, R. W. (1987). A simulator study of the safety implications of cellular mobile phone use. In Proceedings of the 31st Annual Conference of the Association for the Advancement of Automotive Medicine (p. 181). Des Plaines, IL.
  • 55. Strayer, D. L., & Drews, F. A. (2006). Multi-tasking in the automobile. In A. Kramer, D. Wiegmann, & A. Kirlik (Eds.), Applied attention: From theory to practice (pp. 121–133). New York: Oxford University Press. Strayer, D. L., & Drews, F. A. (2007). Cell phone induced driver distrac- tion. Current Directions in Psychological Science, 16, 128 –131. Strayer, D. L., Drews, F. A., & Crouch, D. (2006). A comparison of the cell-phone driver and the drunk driver. Human Factors, 48, 381– 391. Strayer, D. L., Drews, F. A., & Johnston, W. A. (2003). Cell phone induced failures of visual attention during simulated driving. Journal of Exper- imental Psychology: Applied, 9, 23–32. Strayer, D. L., & Johnston, W. A. (2001). Driven to distraction: Dual-task studies of simulated driving and conversing on a cellular phone. Psy- chological Science, 12, 462– 466. Svenson, O., & Patten, C. J. D. (2005). Mobile phones and driving: Review of contemporary research. Cognition, Technology and Work, 7, 182–197. Treffner, P. J., & Barrett, R. (2004). Hands-free mobile phone speech while
  • 56. driving degrades coordination and control. Transportation Research Part F, 7, 229 –246. Vollrath, M., Meilinger, T., & Krüger, H. P. (2002). How the presence of passengers influences the risk of a collision with another vehicle. Acci- dent Analysis and Prevention, 34, 649 – 654. Received January 26, 2007 Revision received June 5, 2008 Accepted June 9, 2008 � Call for Nominations The Publications and Communications (P&C) Board of the American Psychological Association has opened nominations for the editorships of Developmental Psychology, Journal of Consulting and Clinical Psychology, and Psychological Review for the years 2011–2016. Cynthia Garcı́a Coll, PhD, Annette M. La Greca, PhD, and Keith Rayner, PhD, respectively, are the incumbent editors. Candidates should be members of APA and should be available to start receiving manuscripts in early 2010 to prepare for issues published in 2011. Please note that the P&C Board encourages participation by members of underrepresented groups in the publication process and would partic- ularly welcome such nominees. Self-nominations are also encouraged.
  • 57. Search chairs have been appointed as follows: ● Developmental Psychology, Peter A. Ornstein, PhD, and Valerie Reyna, PhD ● Journal of Consulting and Clinical Psychology, Norman Abeles, PhD ● Psychological Review, David C. Funder, PhD, and Leah L. Light, PhD Candidates should be nominated by accessing APA’s EditorQuest site on the Web. Using your Web browser, go to http://editorquest.apa.org. On the Home menu on the left, find “Guests.” Next, click on the link “Submit a Nomination,” enter your nominee’s information, and click “Submit.” Prepared statements of one page or less in support of a nominee can also be submitted by e-mail to Emnet Tesfaye, P&C Board Search Liaison, at [email protected] Deadline for accepting nominations is January 10, 2009, when reviews will begin. 400 DREWS, PASUPATHI, AND STRAYER