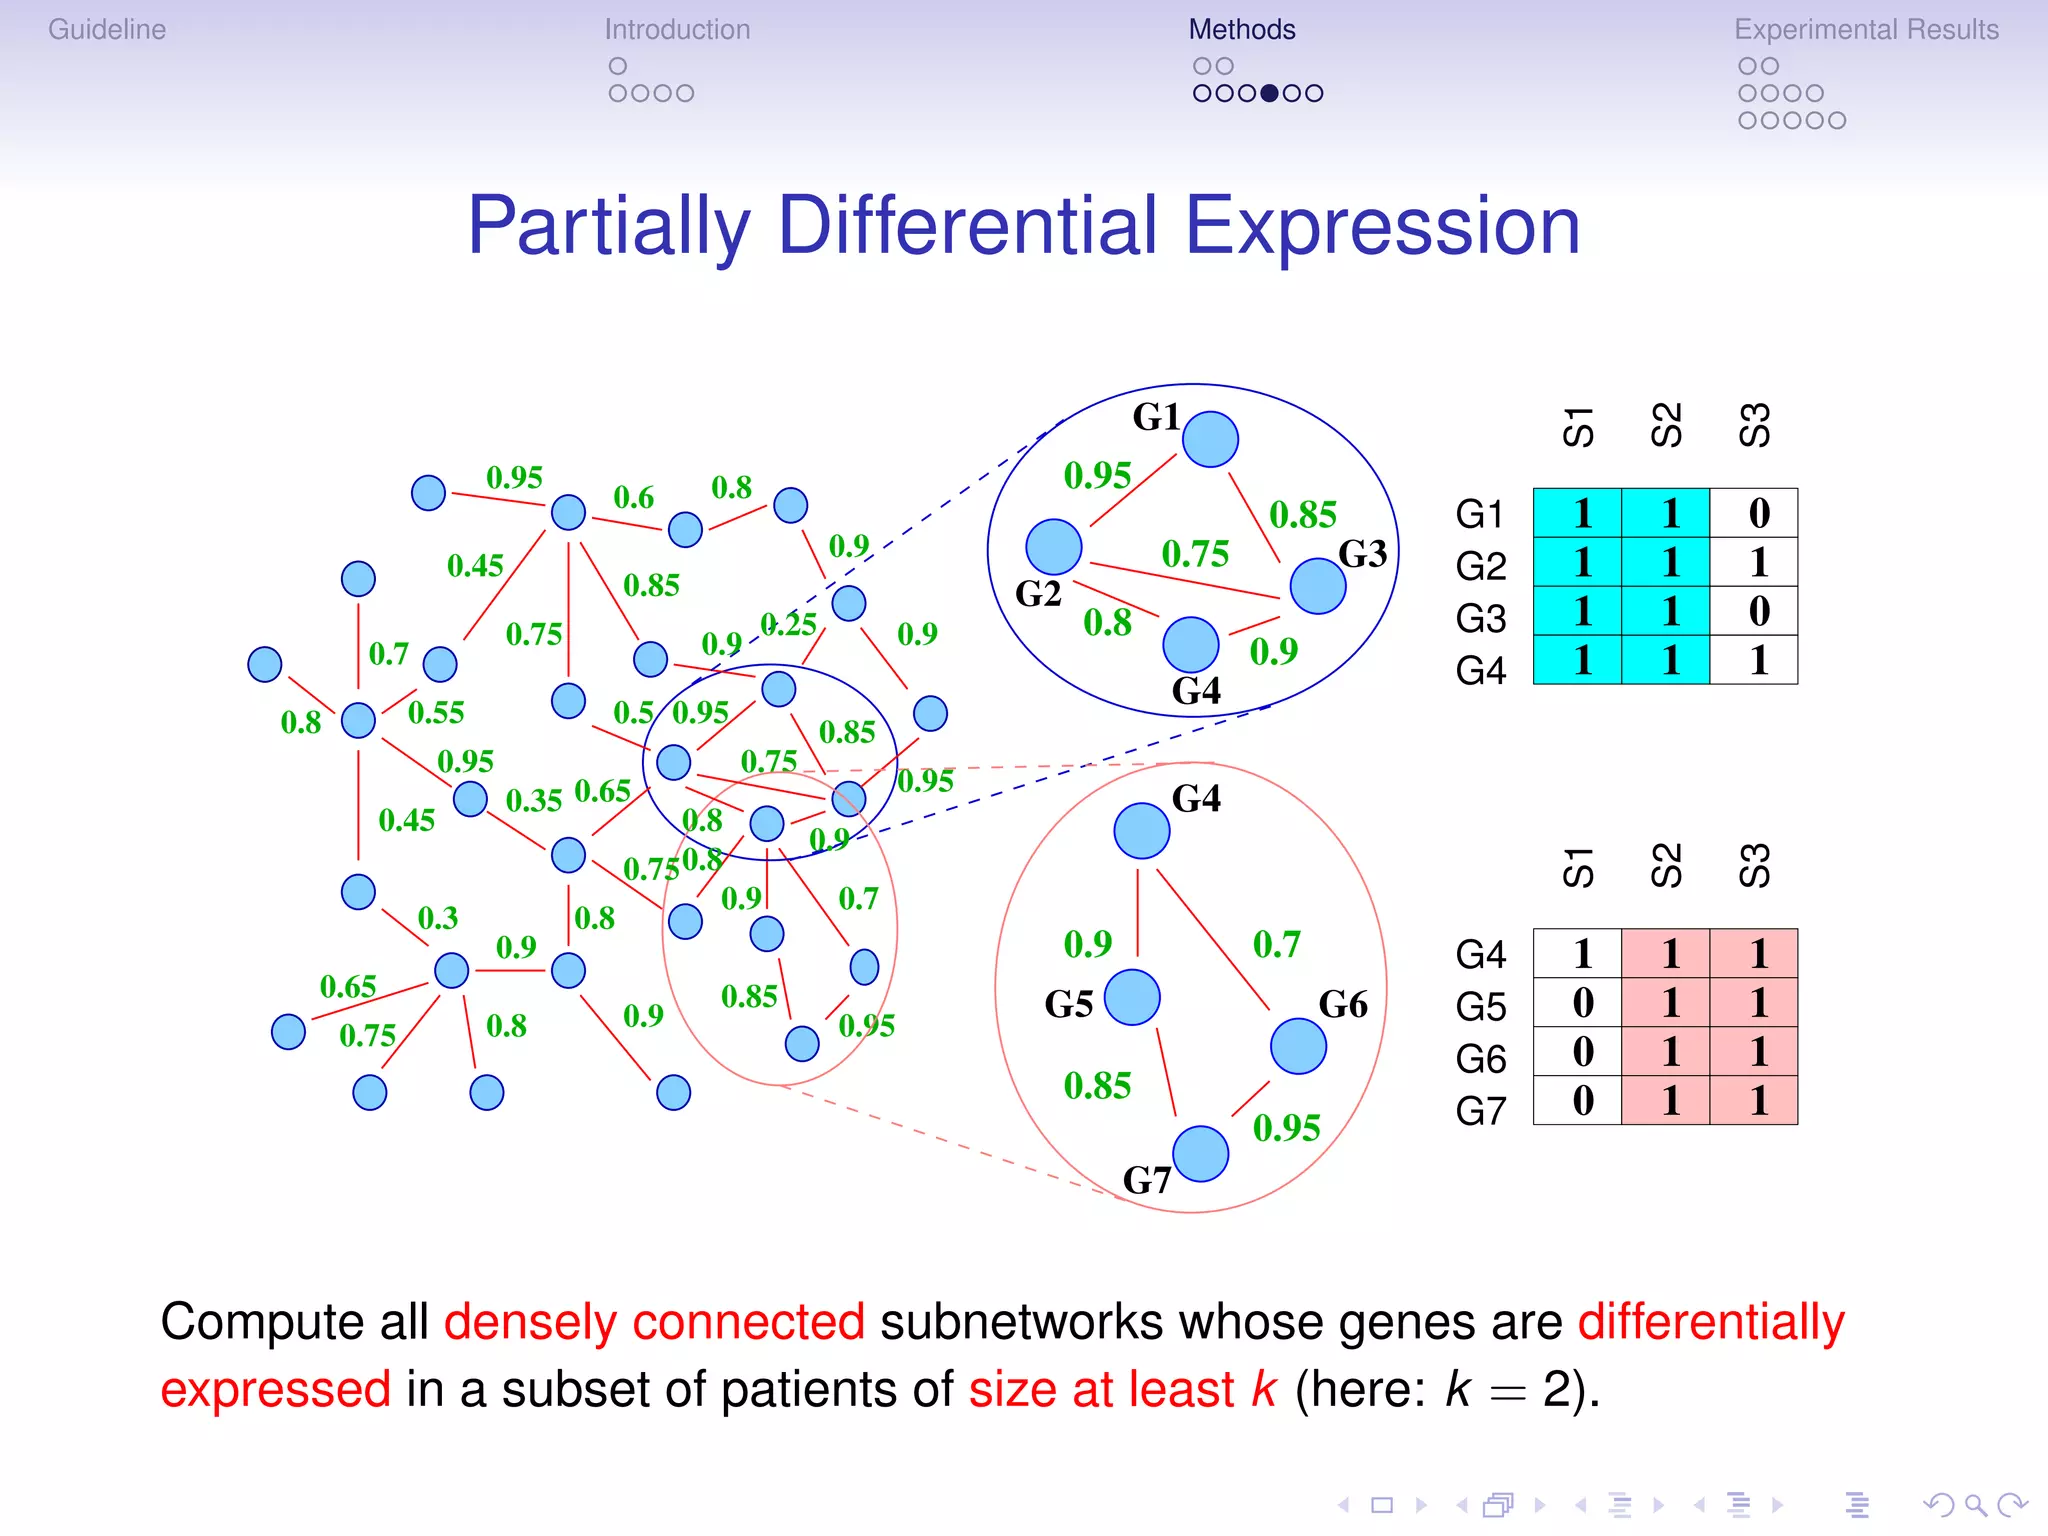
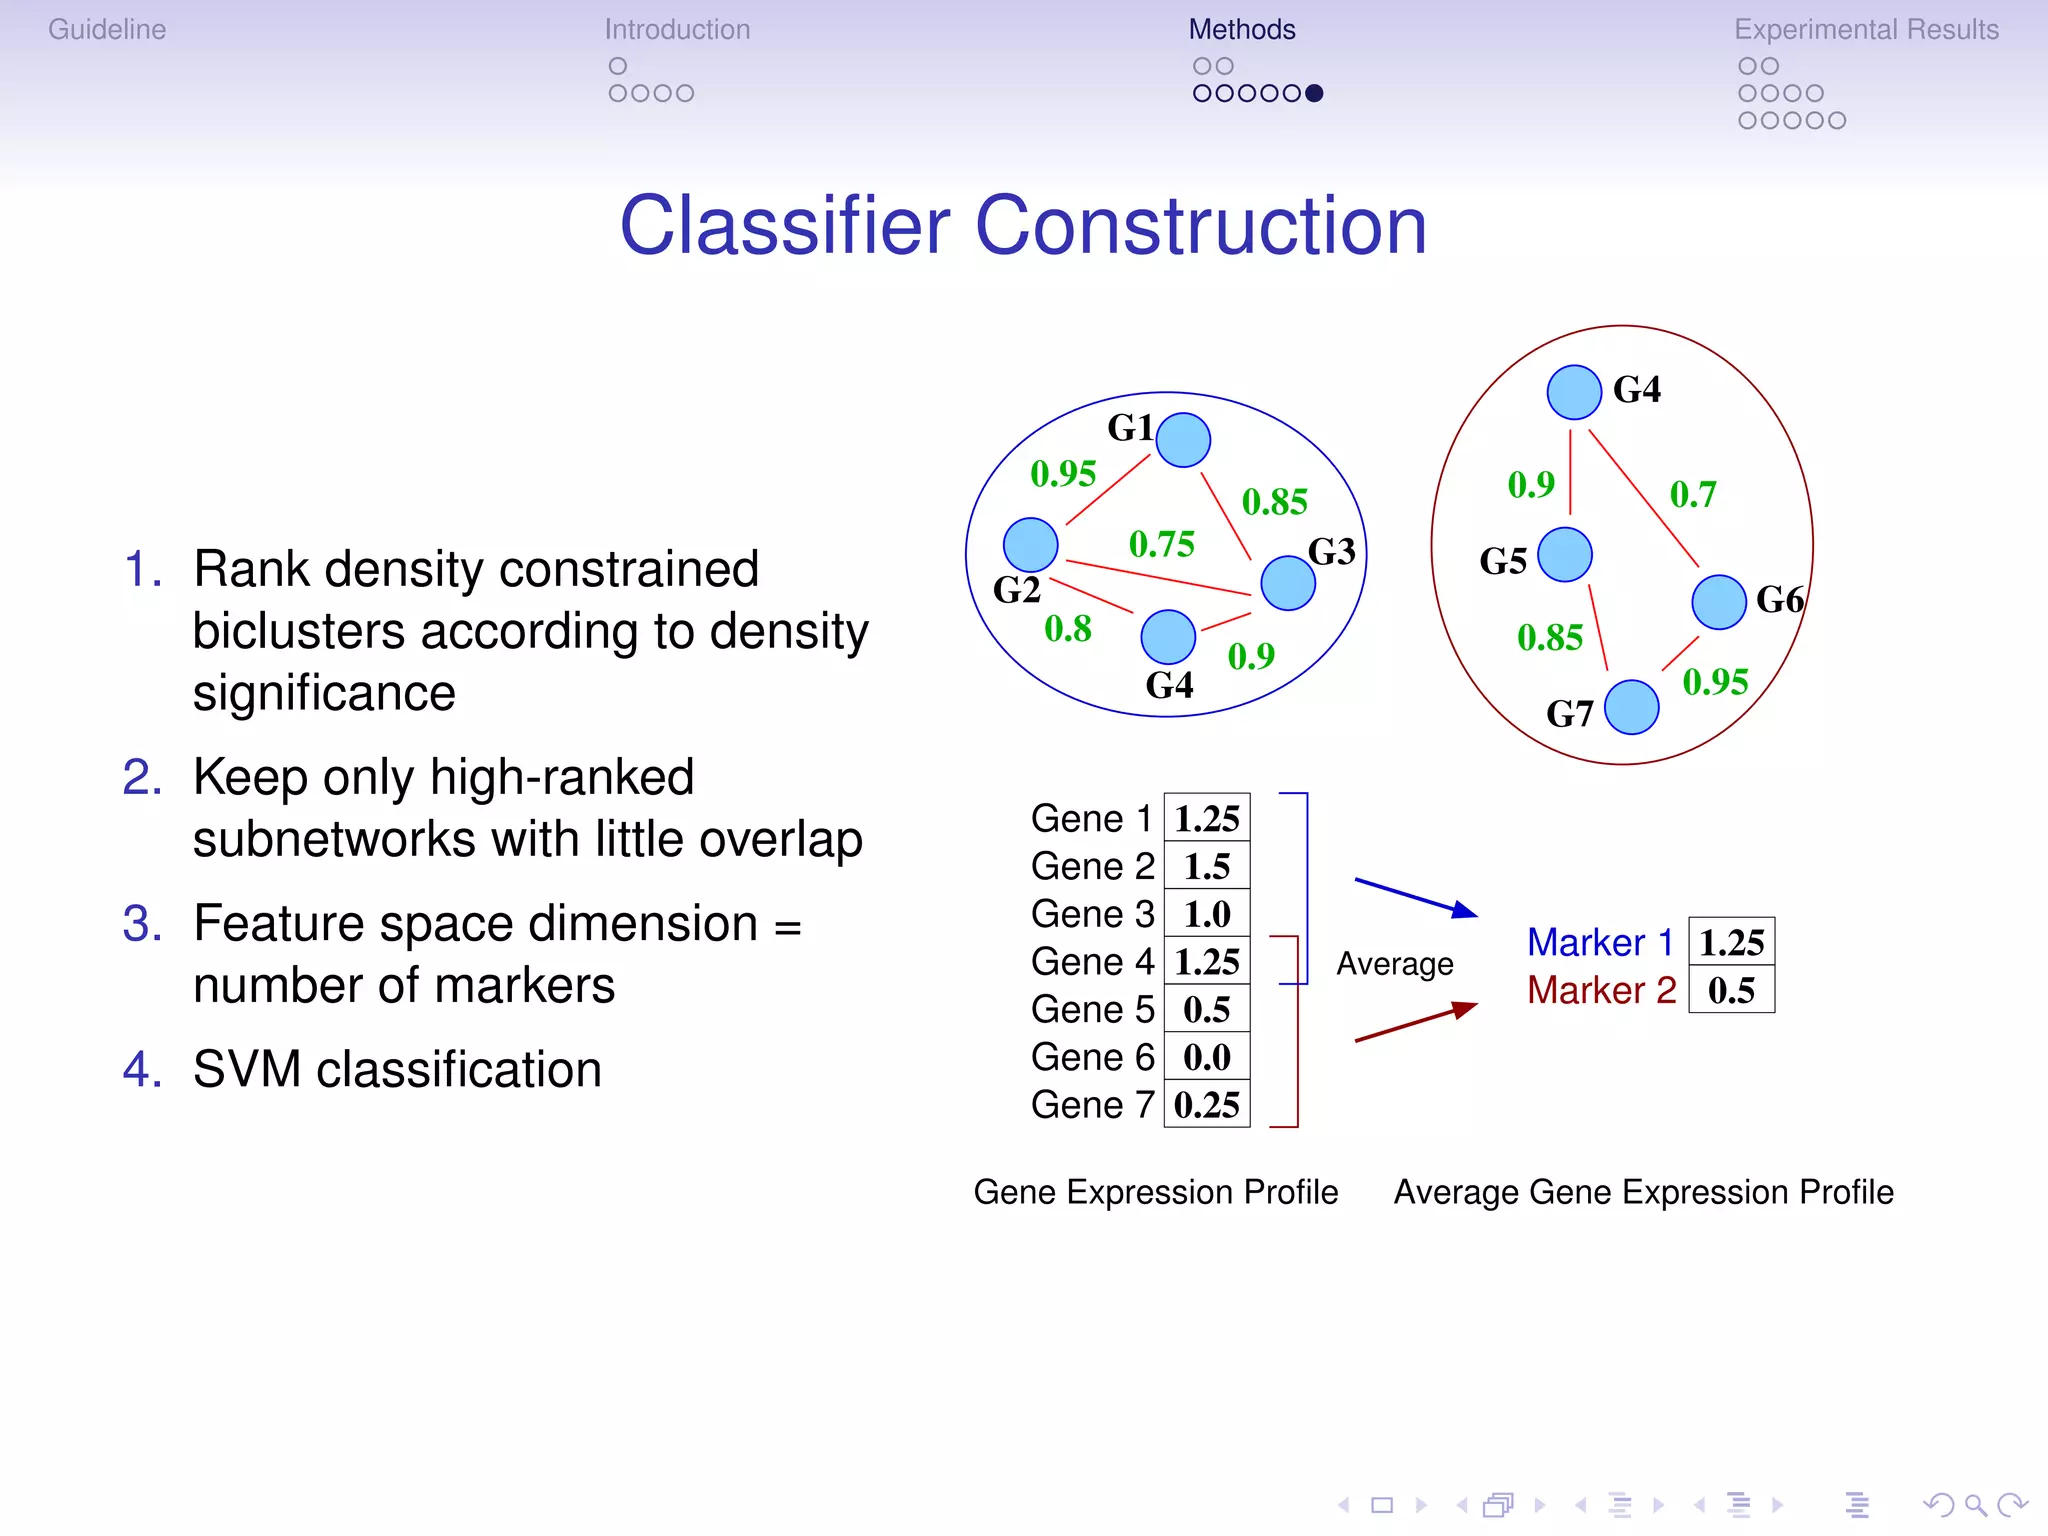
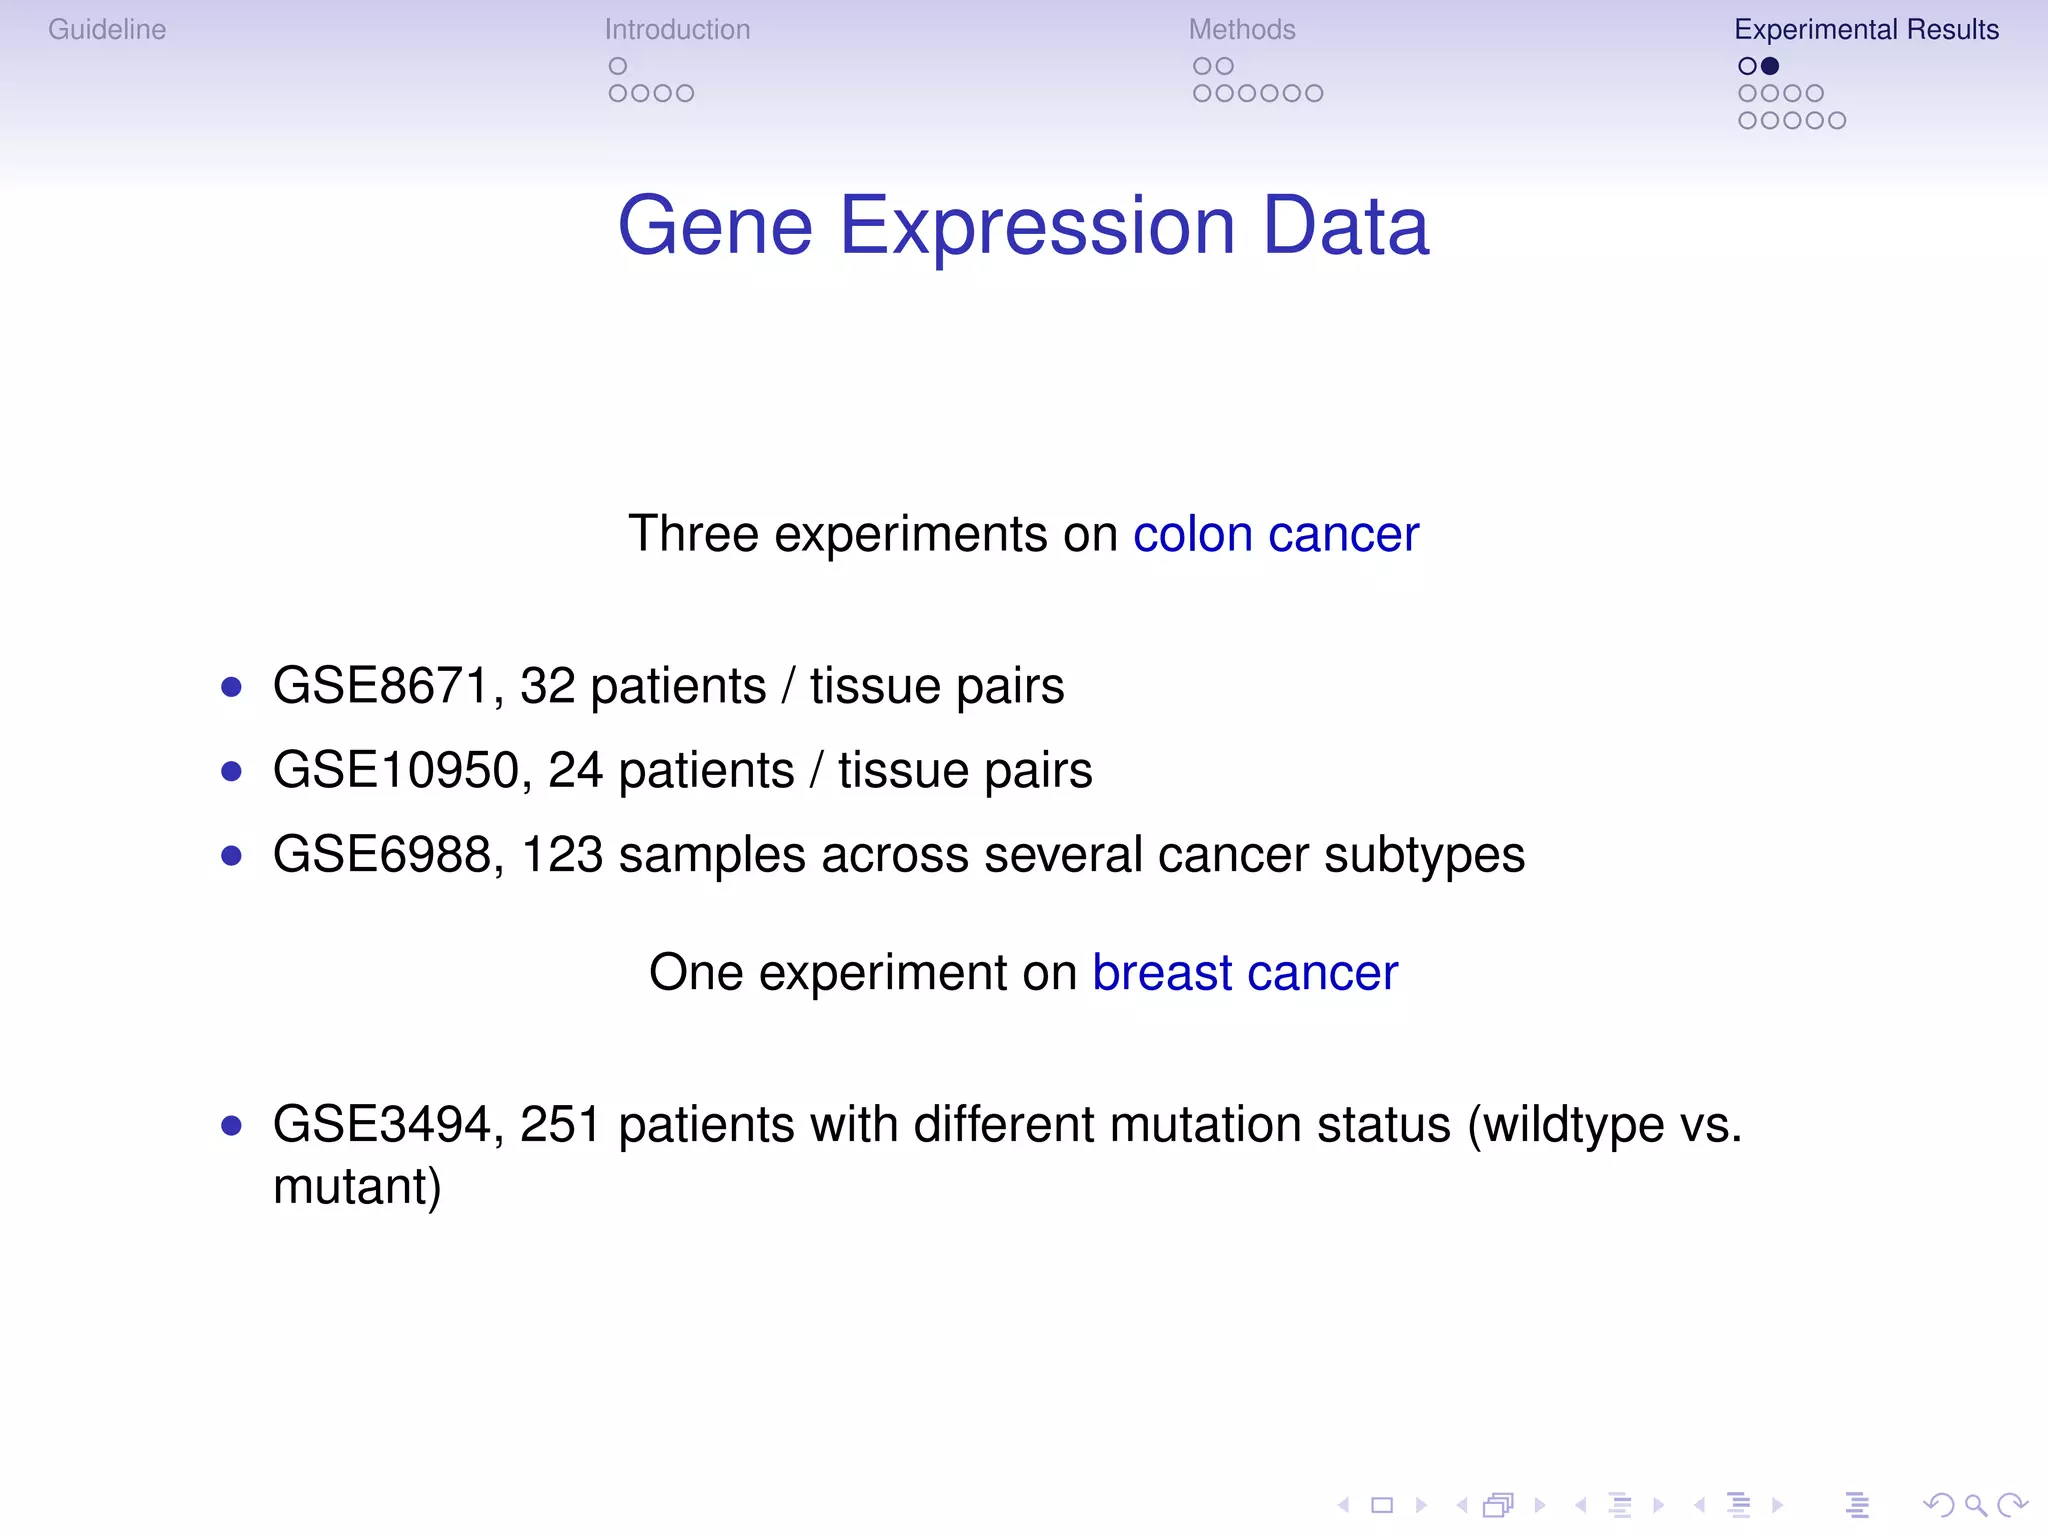
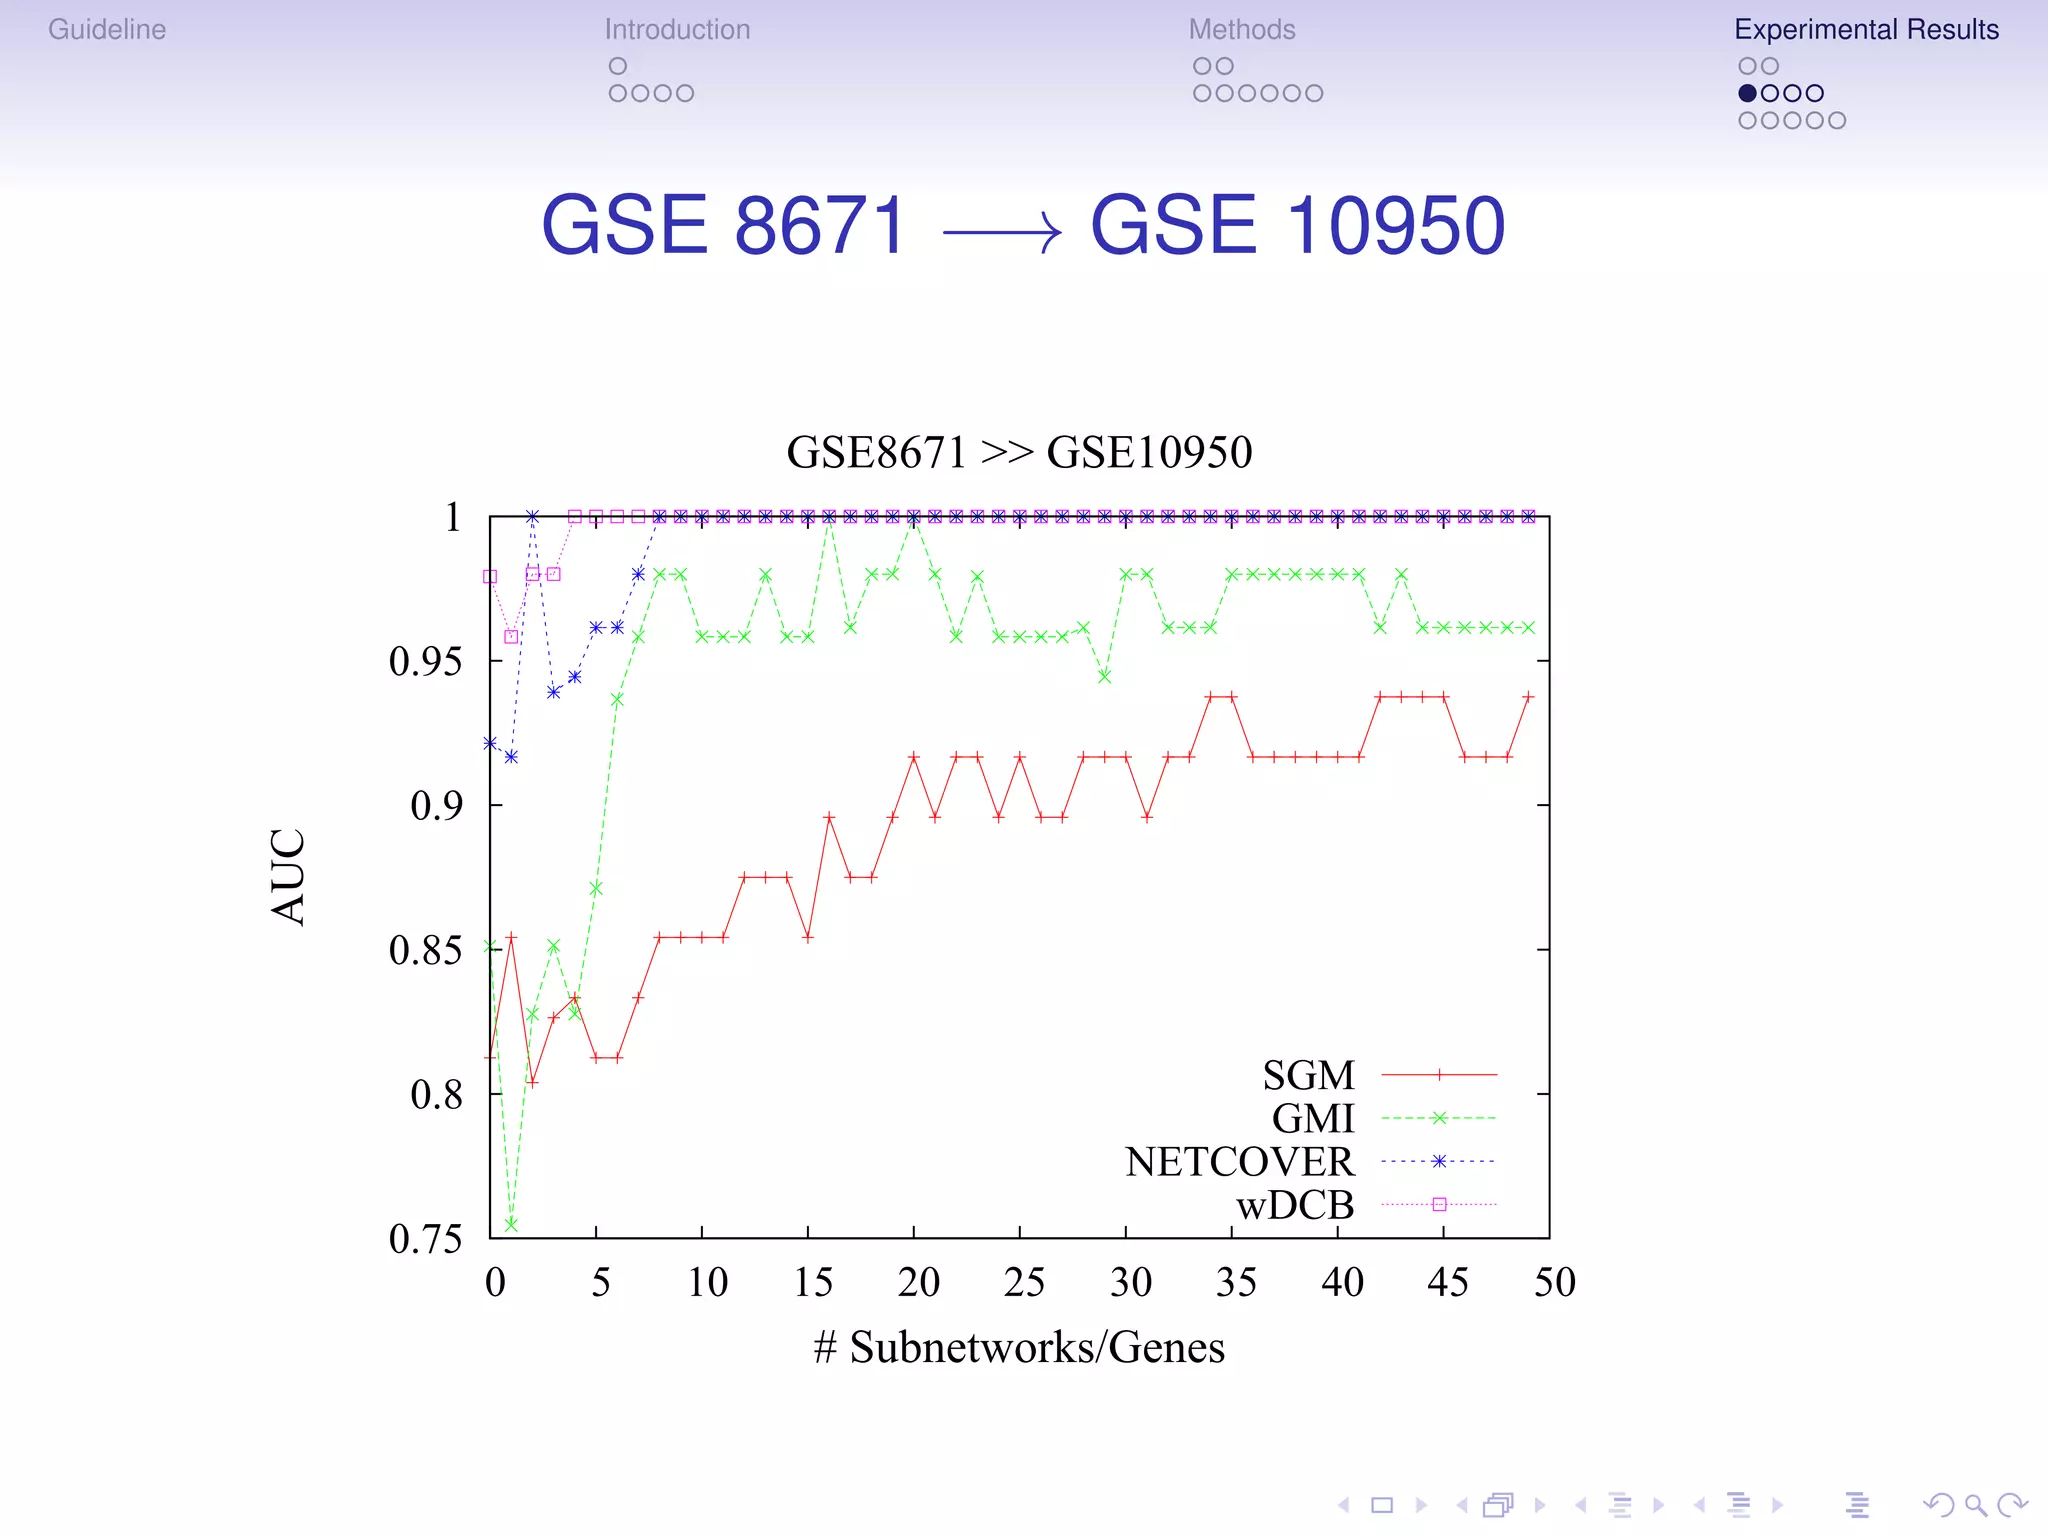
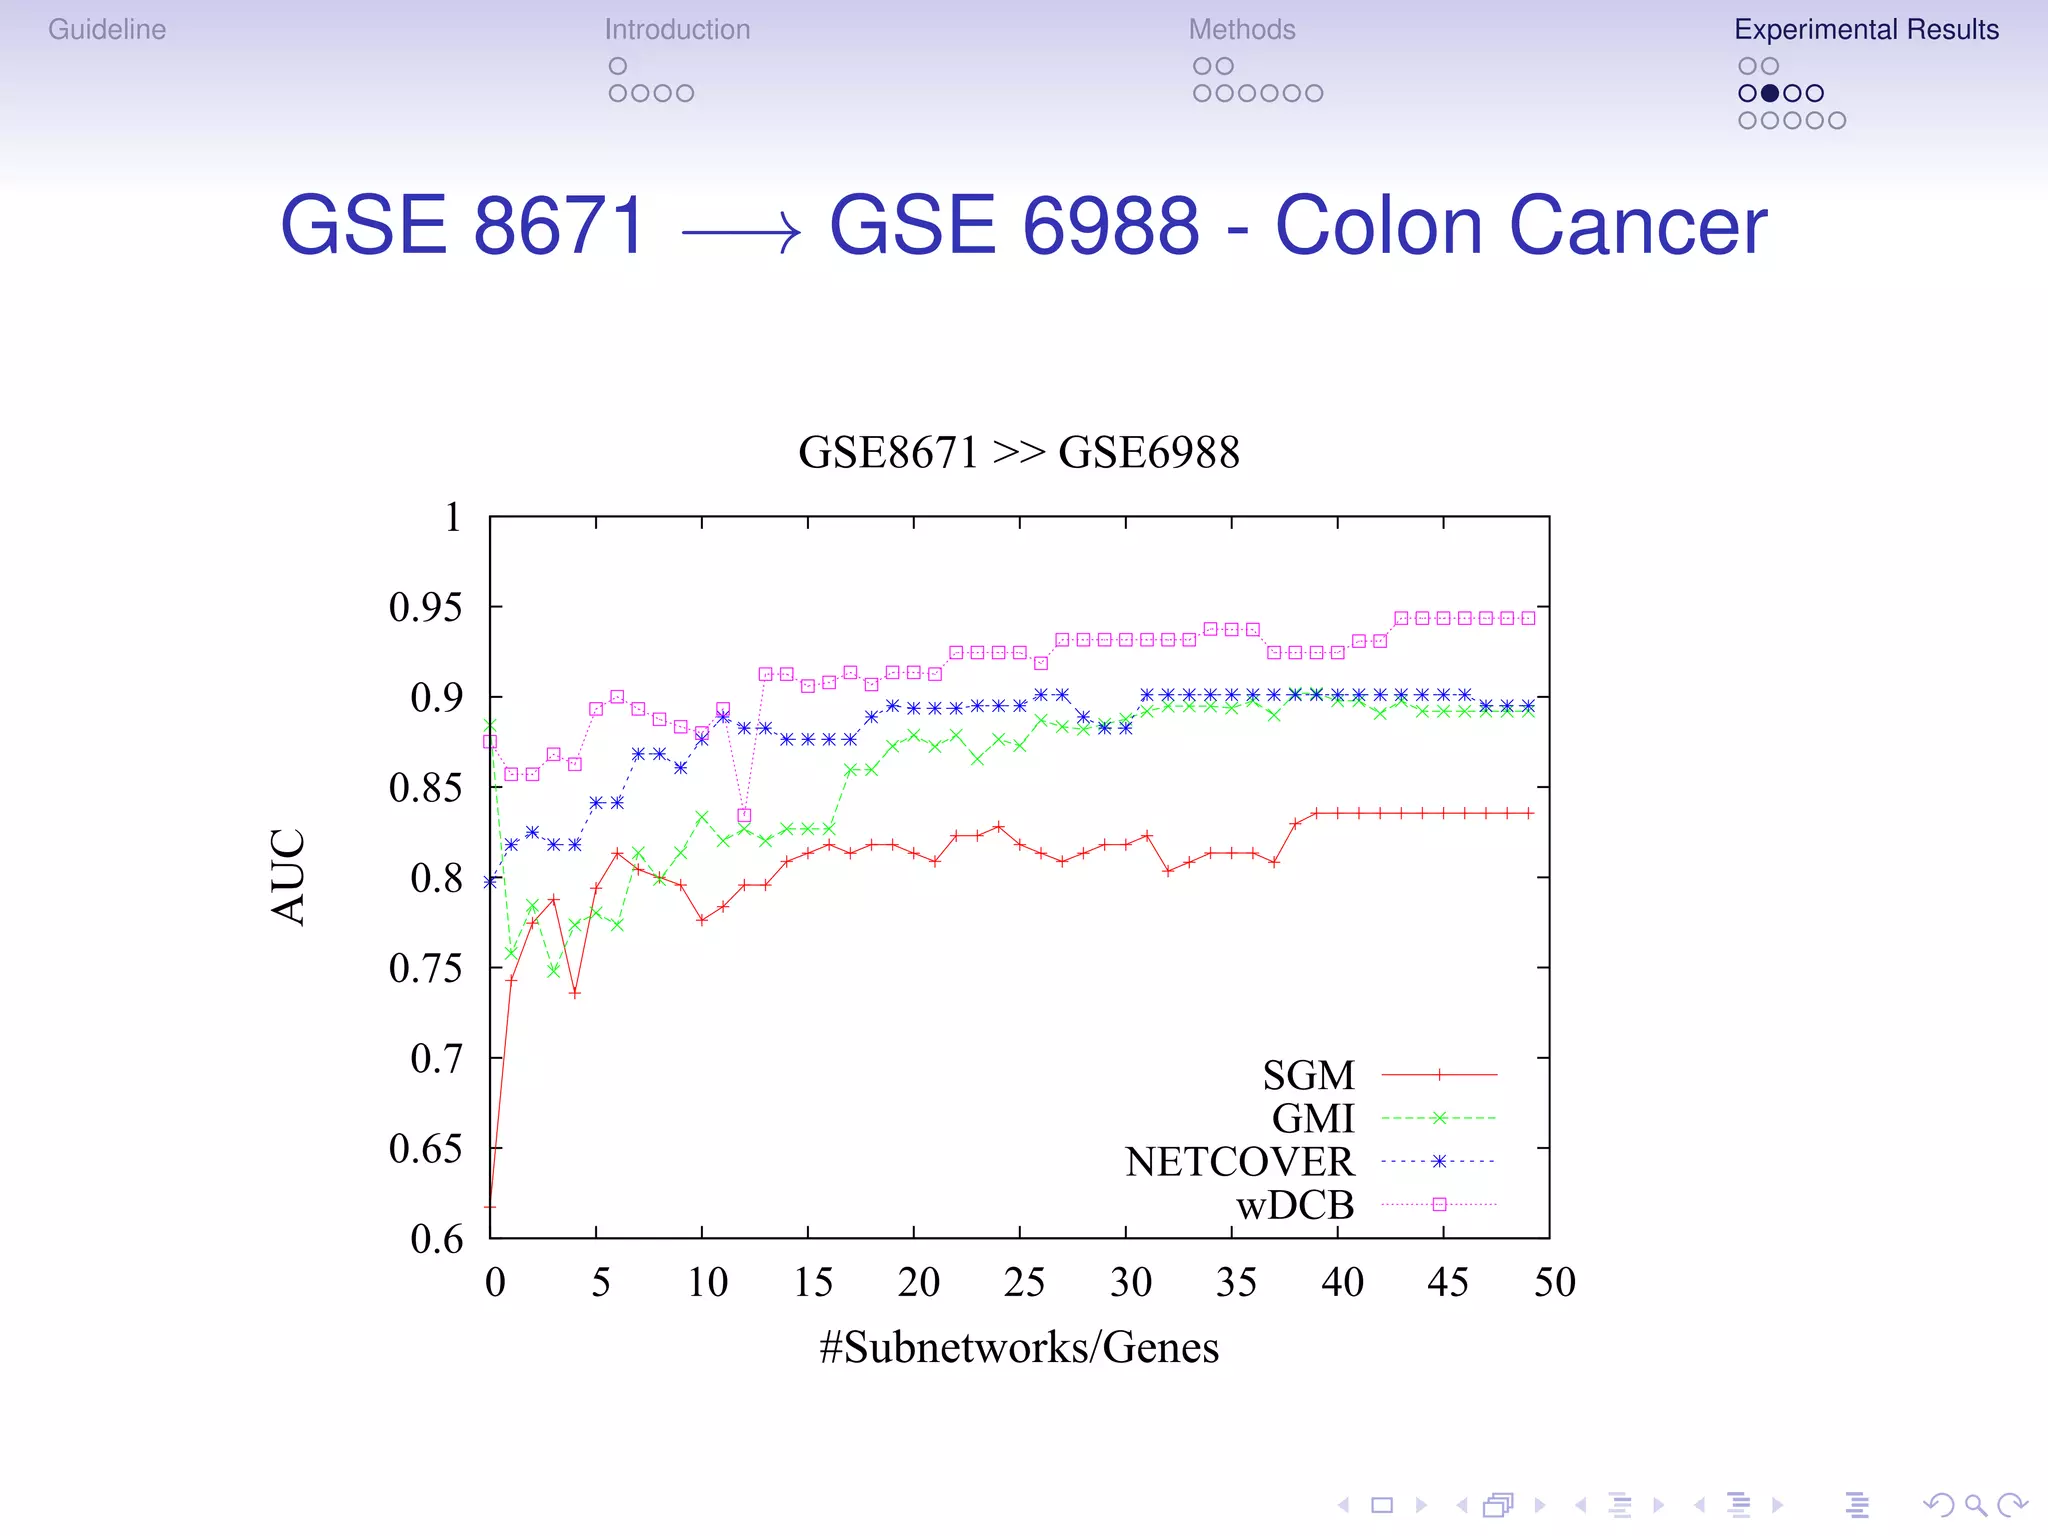
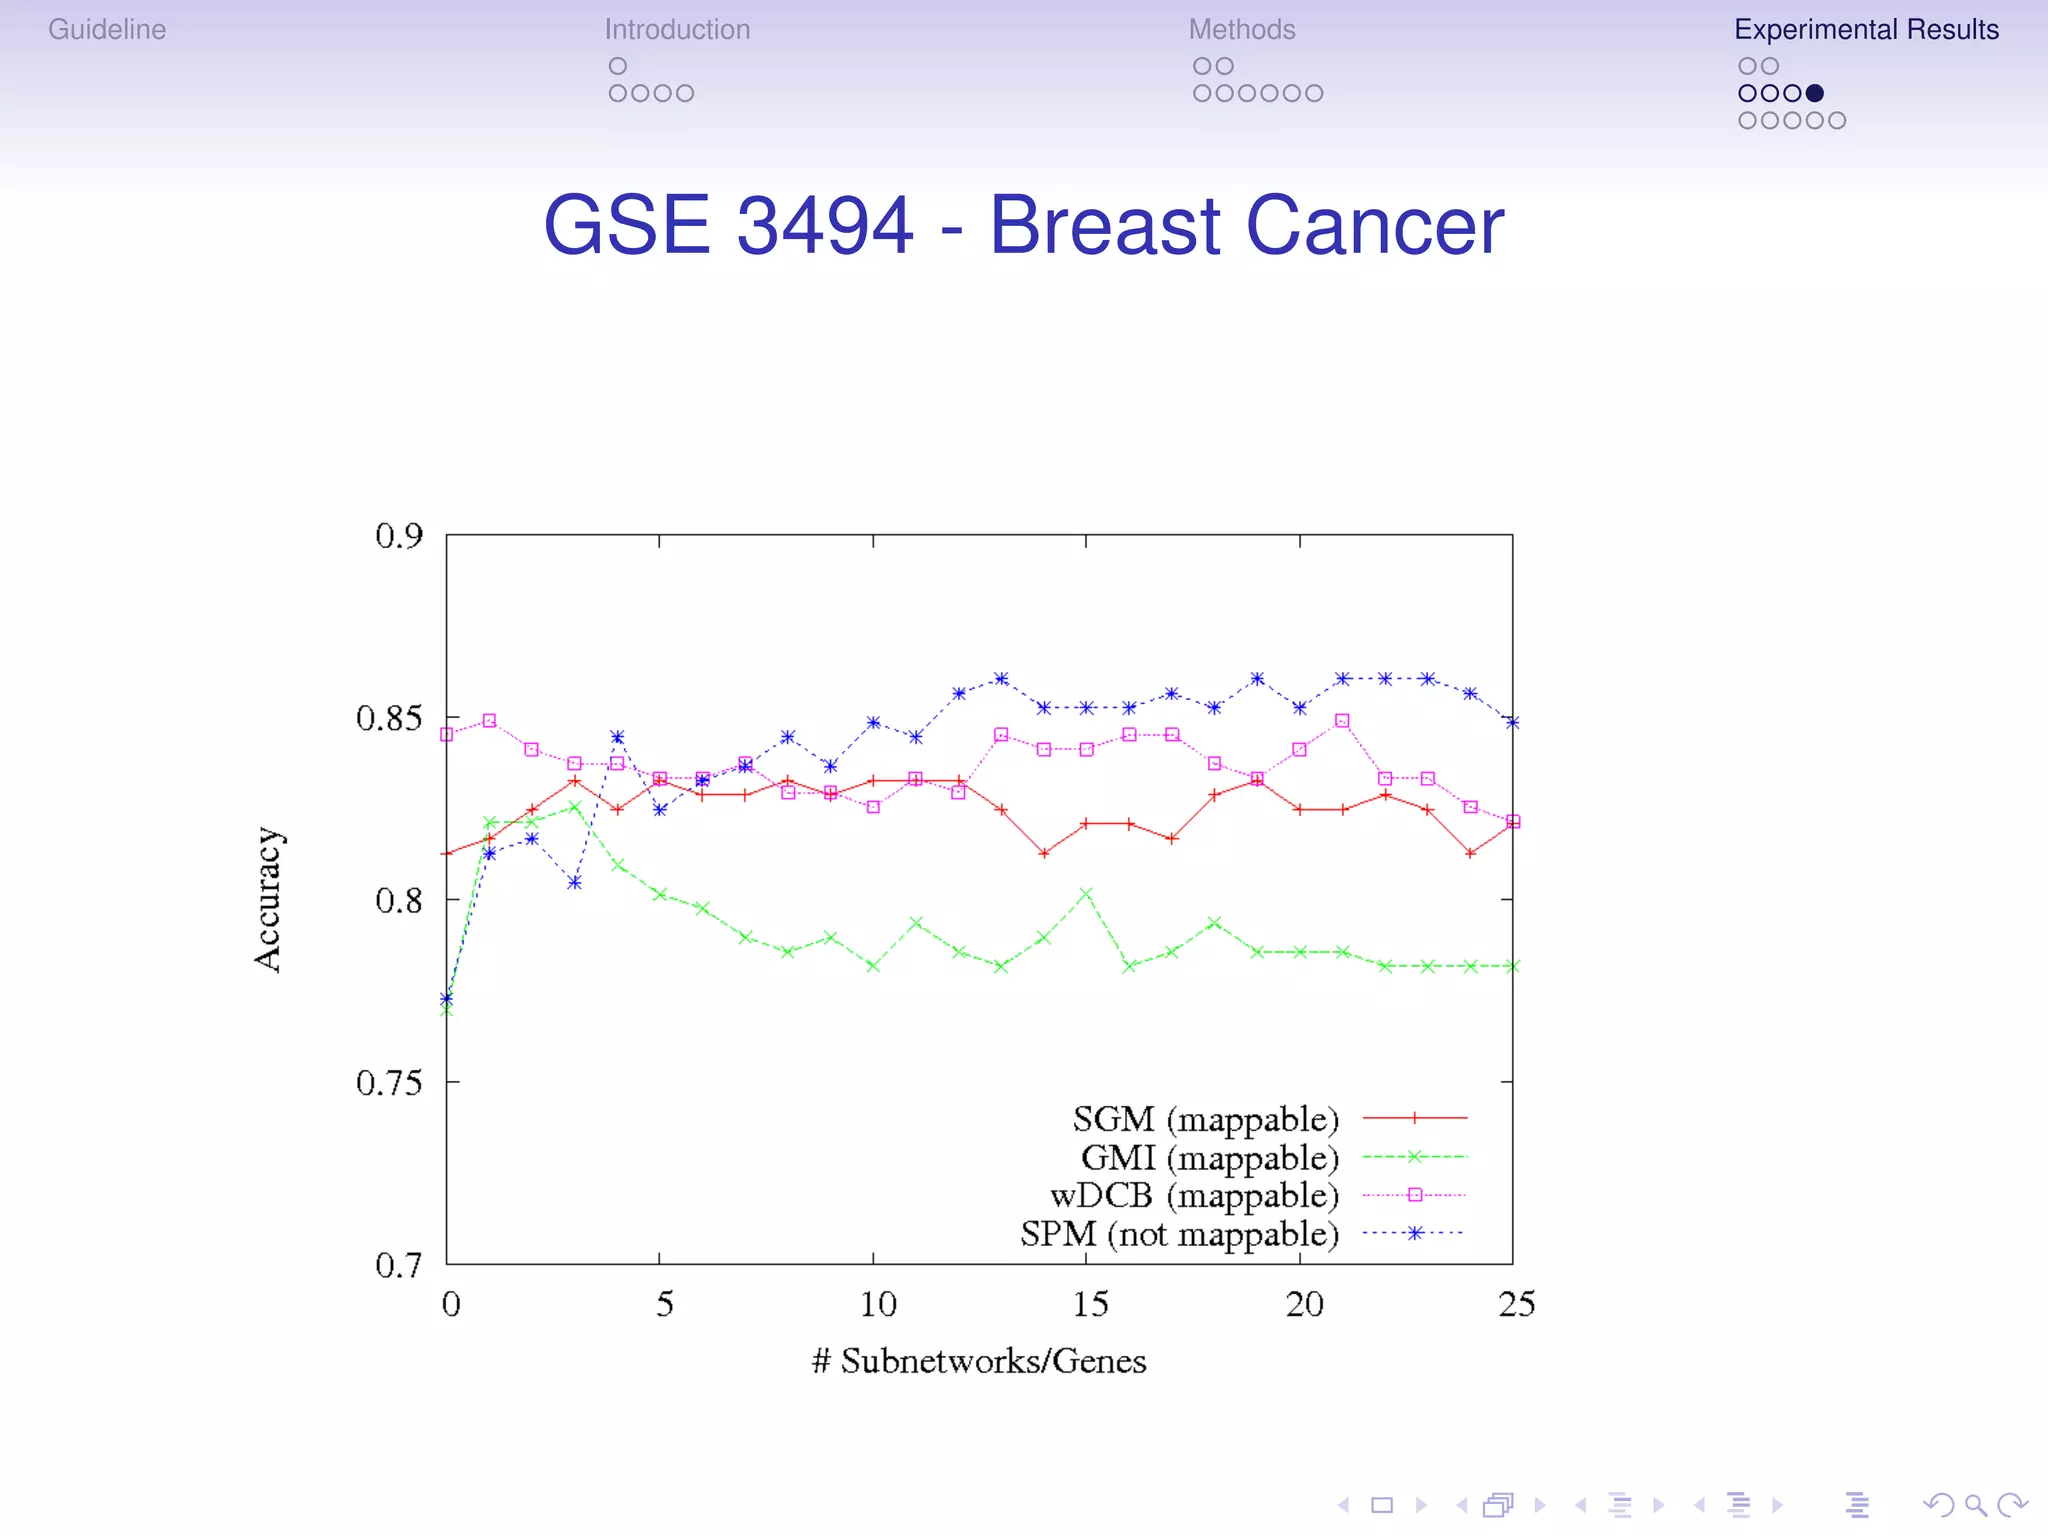
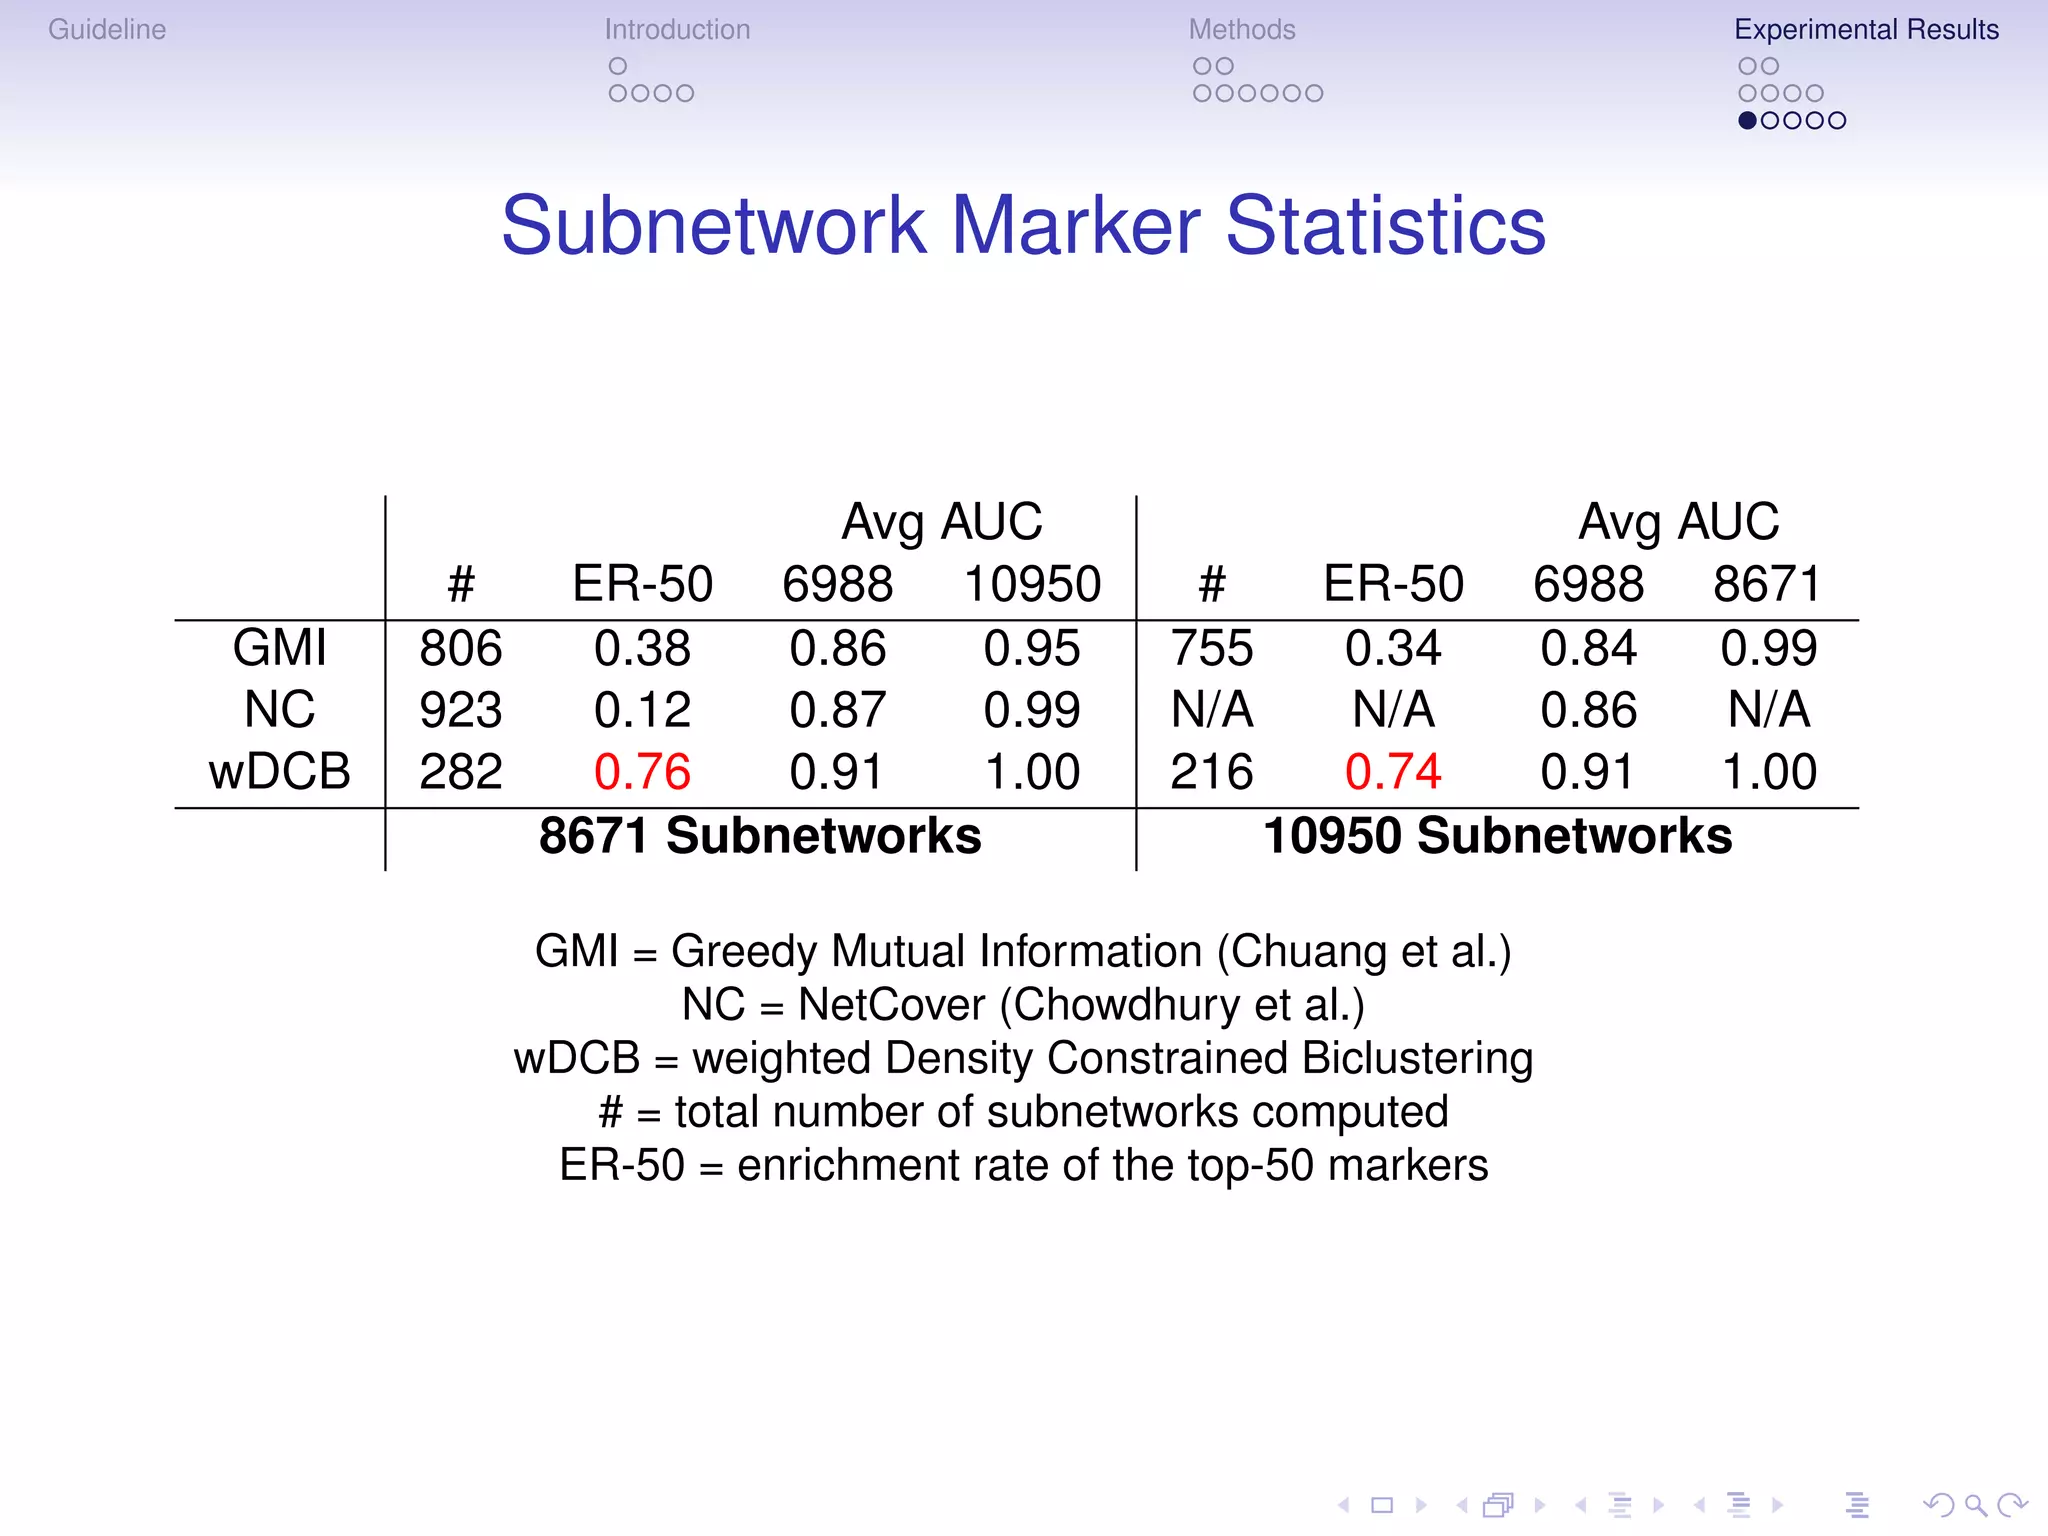
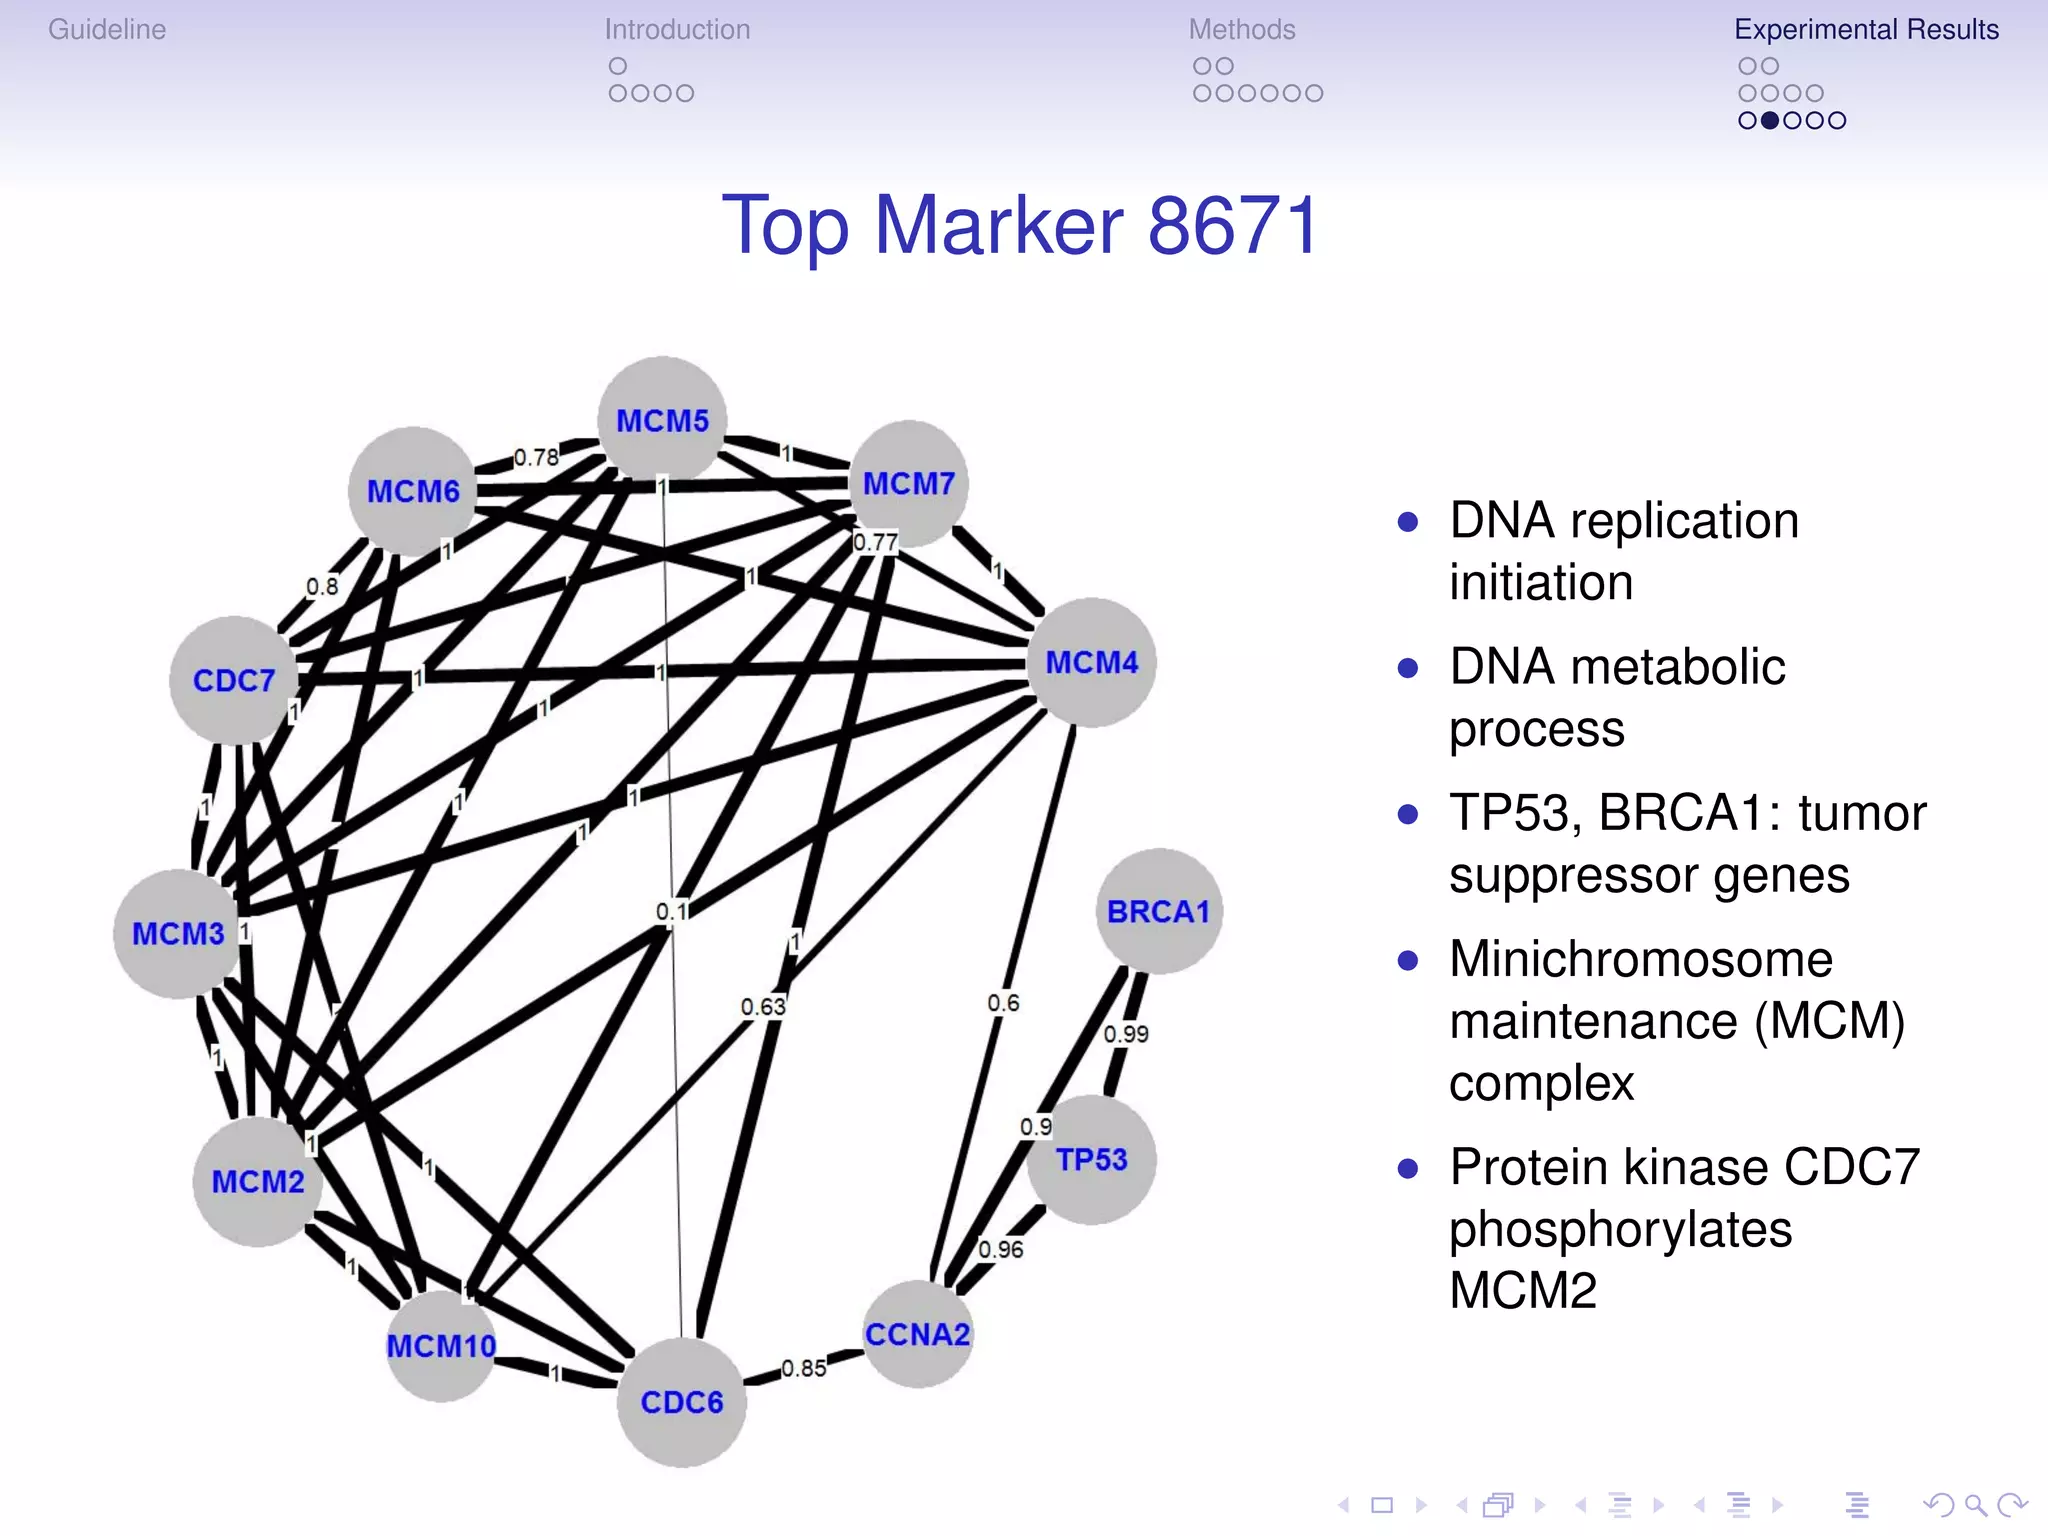
The document describes a method for inferring cancer subnetwork markers using density-constrained biclustering. It begins with an introduction on personalized medicine and biomarker discovery. The methods section explains that the approach finds densely connected subnetworks that are partially differentially expressed. Experimental results on colon and breast cancer gene expression data show that the method achieves high classification performance. The top inferred subnetwork markers are enriched for processes involved in DNA replication, damage repair, and tumor suppression. Future work is proposed to compare signatures across cancers and integrate additional interaction data.
![Guideline Introduction Methods Experimental Results
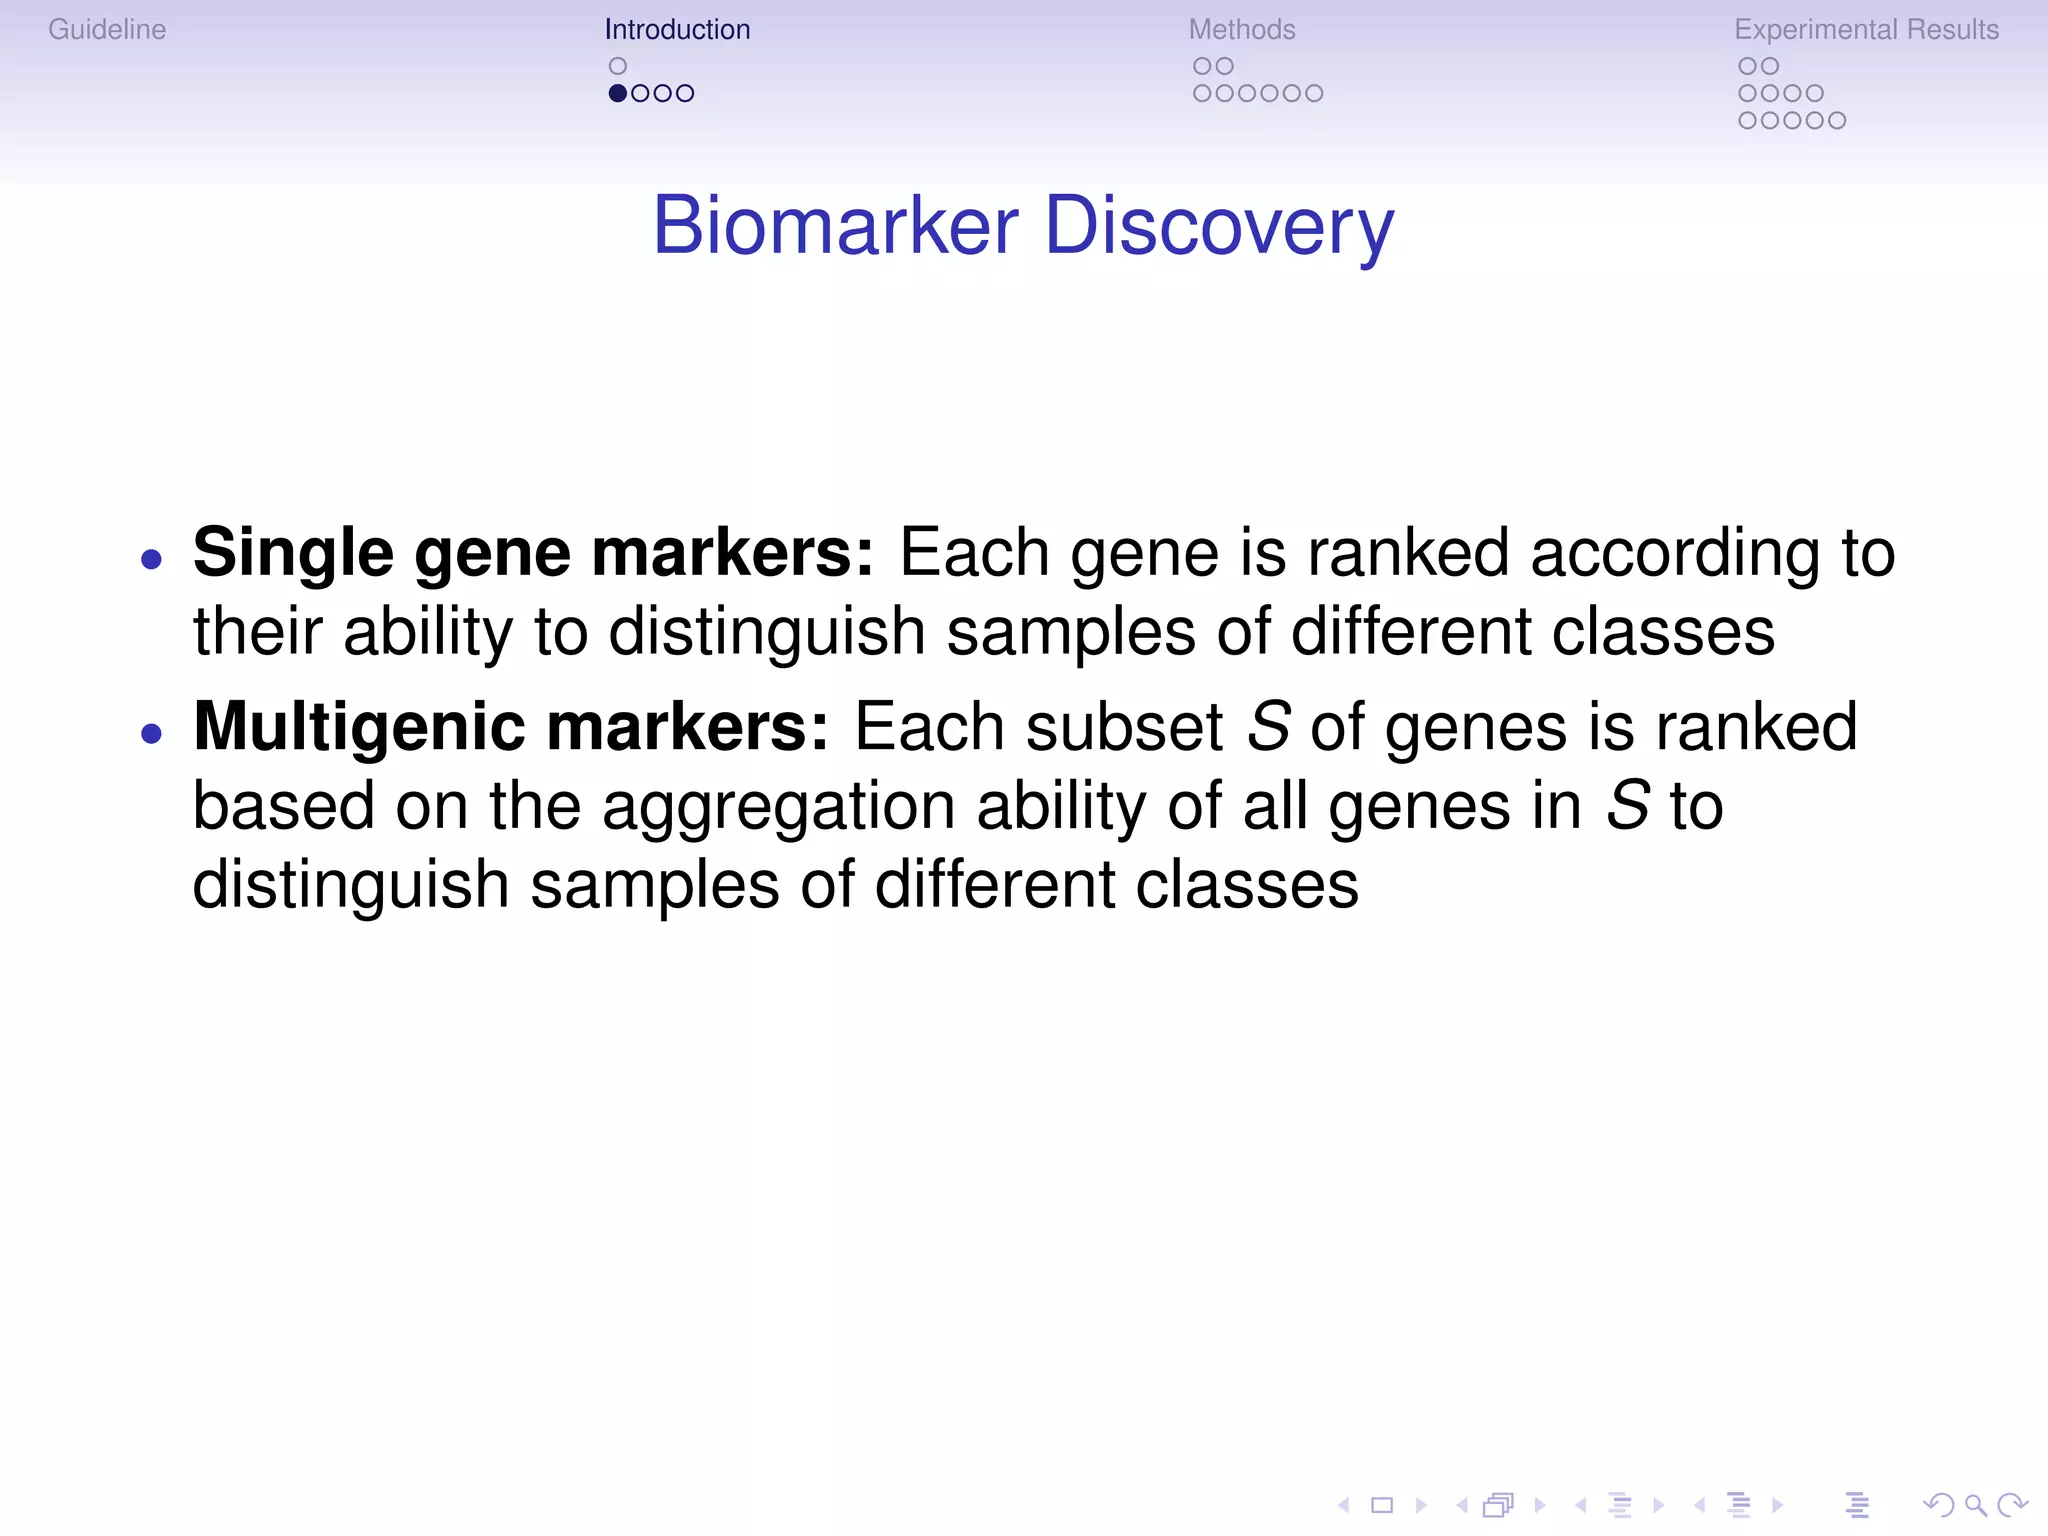
Multigenic Markers
Subnetwork Markers
[Chuang et al., Mol.Sys.Biol. (2007)]:
• Predicting progression of breast
cancer
• Subnetwork markers are
connected subnetworks with
aggregate expression profiles
correlates the most with the labels
of the samples
• Greedy heuristics for searching
for optimal subnetwork markers](https://image.slidesharecdn.com/eccb-110122160716-phpapp02/75/Eccb-7-2048.jpg)
![Guideline Introduction Methods Experimental Results
Multigenic Markers
Subnetwork Markers
[Chowdhury et al., PSB 2010]:
• Predicting colon cancer subtypes
• Each marker is a small connected subnetwork N such that genes
in N cover all disease samples (gene g covers sample s if g is
differentially expressed in s)
• Greedy heuristics for searching for the smallest subnetwork
markers](https://image.slidesharecdn.com/eccb-110122160716-phpapp02/75/Eccb-8-2048.jpg)
![Guideline Introduction Methods Experimental Results
Motivations
Heterogeneity of Cancer Genomes
• Cancer genomes evolve
(many cells in one
patient have different
genomes)
• No two cancer cells of
two different patients
are the same
[Hampton et al., Genome Research (2009)]](https://image.slidesharecdn.com/eccb-110122160716-phpapp02/75/Eccb-9-2048.jpg)
![Guideline Introduction Methods Experimental Results
Motivations
Proximity of Disease Related Genes in PPI Network
[Goh et al., PNAS (2007)]:
• The protein products of genes related to the same disease tend to
interact with one another
• Genes related to a disease have coherent functions with respect to the
Gene Ontology hierarchy](https://image.slidesharecdn.com/eccb-110122160716-phpapp02/75/Eccb-10-2048.jpg)

![Guideline Introduction Methods Experimental Results
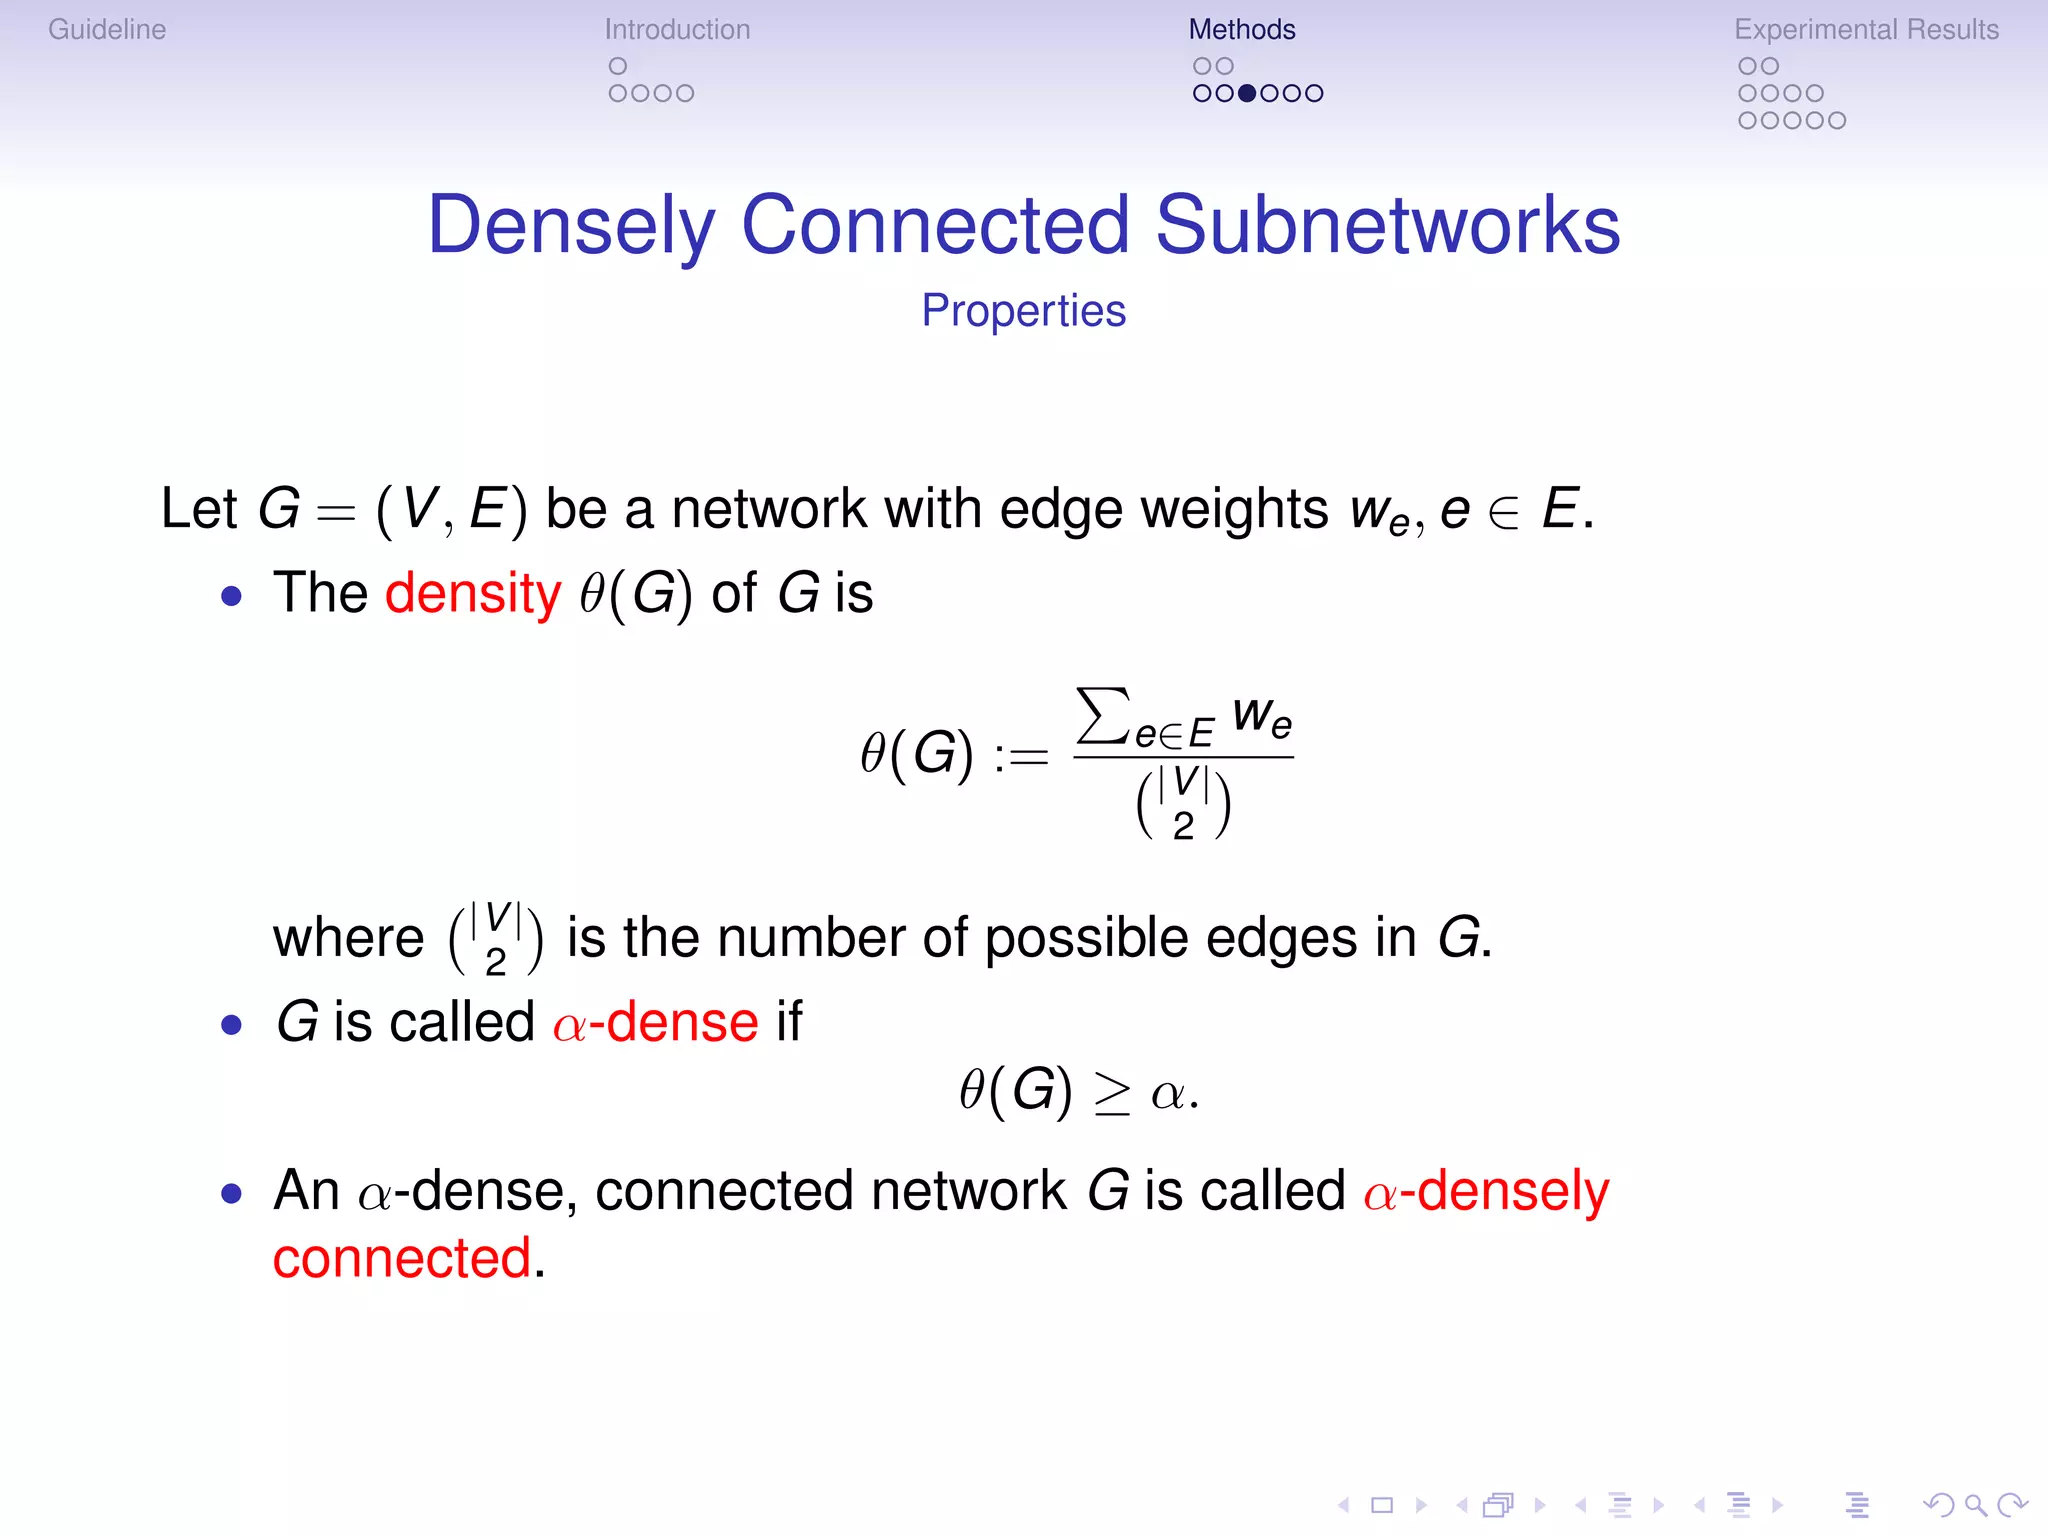
Density Constrained Biclustering
Search Strategy
Theorem: Let α ≥ 0.5. Every α-densely connected network of size n
contains an α-densely connected subnetwork of size n − 1.
0.4 A 0.6 A 0.9 A C 0.8 D C
B C D B B D
C
0.6 A 0.6 A 0.9 A 0.8 D
0.4 0.6
B A C 0.4 C 0.9 D 0.4 B
0.9 B D 0.8 B C
0.8
D
Density: 0.45
= [(0.8 + 0.9 + 0.6 + 0.4) / 6] C
Not Dense wDCB
0.4 0.6
B A
0.9
0.8
Not Connected D maximal wDCB
Figure: Toy example for computation of densely connected subnetworks,
density threshold θ = 0.5.](https://image.slidesharecdn.com/eccb-110122160716-phpapp02/75/Eccb-15-2048.jpg)

![Guideline Introduction Methods Experimental Results
Network Data
Confidence-scored PPI network
[STRING, von Mering et al., NAR 2009]
• Edges reflect physical
protein-protein interactions
• Confidence scores reflect the
probability that the interaction is 0.95
0.6 0.8
0.9
associated with a cellular 0.45
0.75
0.85
0.9
0.25 0.9
0.7
phenomenon (and not an 0.8 0.55
0.95
0.5 0.95
0.75
0.85
0.95
experimental artifact) 0.45
0.35 0.65
0.8
0.75 0.8
0.9
0.9 0.7
0.3 0.8
• Scoring system based on KEGG 0.65
0.75 0.8
0.9
0.9
0.85
0.95
pathways](https://image.slidesharecdn.com/eccb-110122160716-phpapp02/75/Eccb-18-2048.jpg)


![Dancey Clinical Trials Vancouver Dancey 20110302 Final.Ppt [Compatibility Mode]](https://cdn.slidesharecdn.com/ss_thumbnails/danceyclinicaltrialsvancouverdancey20110302finalpptcompatibilitymode-13018535926617-phpapp02-thumbnail.jpg?width=640&height=640&fit=bounds)


