SlideShare a Scribd company logo
Towards a Novel Model for the Prognosis of Acute Myeloid Leukemia Patients: An Evaluation
of Cancer Modeling Techniques
Executive Summary
In recent years, as the incidence of cancer continues to climb, much research attention has
been devoted to alternative methods of cancer management, among them computational
modeling. While computational modeling offers many promises to cancer researchers, it faces
several challenges as well, including the lack of a robust, clinically applicable cancer model.
This study aims to develop an accurate, comprehensive predictive model for patients of Acute
Myeloid Leukemia, one of the most devastating cancers. This paper presents the initial
development of this model with the evaluation of the predictive potential of two widely used
computational models, the Artificial Neural Network (ANN) and Logistic Regression (LR). Both
the ANN and LR were developed in Python using protein expression data from 191 AML
patients so that, given a patient’s profile at the time of diagnosis, the model could predict
whether the patient would go into remission or exhibit resistance to current therapies for AML.
The predictive potential of these models was measured using five criteria: sensitivity, specificity,
positive predictive value, negative predictive value, and overall accuracy. The ANN exhibited
excellent recognition of patients likely to go into remission, which would be greatly valuable in
the clinic. While the LR did not perform as well, it did yield important statistical information that
set it up as a likely supplement as part of a larger, robust model. Our results indicate that an
integration of the ANN and LR will likely yield the most effective predictive tool, as the two
together compensate for the flaws they exhibit individually. This research is the first step in the
creation of a novel tool that doctors can use to predict a patient’s prognosis at the time of
diagnosis, contributing to a more individualized, effective approach to cancer therapy.
 
Towards a Novel Model for the Prognosis of Acute Myeloid Leukemia Patients: An Evaluation
of Cancer Modeling Techniques
Abstract
This paper presents the initial stages of the development of a predictive model for Acute Myeloid
Leukemia (AML) patients. This study assessed the respective advantages and disadvantages of
two widely used computational models, the Artificial Neural Network (ANN) and Logistic
Regression (LR), in order to firstly, evaluate their potential to predict, given a patient’s profile at
diagnosis, whether the patient will enter remission or exhibit primary resistance, and secondly, to
offer a broader understanding of the current necessities of cancer modeling. The ANN and LR
were both developed in Python using proteomic data (231 proteins) obtained from 191 AML
patients. Predictive potential of models was measured using sensitivity, specificity, positive
predictive value, negative predictive value, and overall accuracy. The ANN exhibited an
excellent specificity and positive predictive value, indicating its potential clinical applications;
however, it did exhibit a tendency to overfit to data, confirming one hypothesis of this research.
While the LR was a relatively poor performer, it did yield important statistical information that
set it up as a likely supplement as part of a larger, robust model. Thus, our results point us to
integration of the two modeling techniques to create the novel predictive tool for physicians we
envision.
1
1. Introduction
Cancer persists today as one of the leading causes of mortality worldwide, threatening to
claim almost 600,000 lives in the United States alone this year (ACS et al. 2014). As the
incidence of cancer continues to climb, researchers are prompted to go beyond traditional
techniques of treatment to explore alternative methods of cancer management. Among the
various methods gaining popularity, mathematical and computational modeling has become an
especially promising new avenue for cancer research.
Medical society has mastered the art of data collection with regards to cancer: today,
gathering and storing data about a patient’s clinical and genetic correlates is no longer the
challenge. Instead, extracting valuable information from this wealth of “big data” proves to be
the next large obstacle for cancer researchers to surmount (Quaranta et al. 2005). Here is how
computational modeling, or a “top-down” approach to medicine, offers great potential; by
providing researchers with the tools able to perform large-scale analysis, computational
modeling, with enormous predictive capacity, may yield the tools necessary to improve the
management of cancer starting from diagnosis. As the focus on cancer prediction models has
grown, interest in ensuring their proper development and use is of the utmost importance
(Durrett et al. 2013).
However, cancer modeling faces challenges that currently prevent it from becoming
widely adapted in clinics—as the type and number of cancer models continues to rise, the
relative lack of assessment on the specific strengths and weakness of individual cancer models
has resulted in a plethora of models that are functional but severely limited in scope, rendering
these models useless in the clinic (Freedman et al. 2005). There is a need for a better
2
fundamental understanding of cancer modeling techniques in order to identify the best strategies
to apply when modeling a specific type of cancer.
This study focuses on Acute Myeloid Leukemia (AML), a cancer originating in bone
marrow and the bone’s soft tissue. A heterogeneous clonal disorder in which hematopoietic
precursors are restricted in early stages, AML has garnered much research attention in recent
years; however, understanding the pathophysiology of AML has not greatly improved the five-
year survival rate, which barely scrapes 24% (Stone et al. 2004). Several reasons account for the
low rate of survival, including the rapid progression of the disease (as denoted by the term
“acute”), but more important in limiting instances of recovery is the ineffective use of current
AML therapies. Current therapies, which initially concentrate on chemotherapy coupled with
allogenic hematopoietic stem cell transplantation, often induce relapse in AML patients. Thus,
chemotherapy doses must be consistently augmented depending on the specific patient’s
reaction, and this process eventually destroys bone marrow and results in the high mortality rate
(Stone et al. 2004). The resistance to chemotherapy noted has in turn contributed to a hypothesis
that the stem cells causing AML are particularly resistant to chemotherapy, eliminating one
heavily used avenue in cancer treatment and highlighting the need for a tool capable of
identifying the best treatment strategy for a given patient.
3
Thus, the ultimate goal of our research is to address this need for the betterment of AML
treatment by developing the best prediction model that, given a patient’s profile, can predict
whether he will be primary resistant (exhibiting a resistance to current therapies should they be
applied) or whether he will reach complete remission (becoming cancer-free for a given amount
of time). Developing this model as a predictive tool able to be used at the time of diagnosis
would enable doctors to use the prediction of the model—either remission or resistant—to decide
what treatment strategy would be best for the patient under consideration, and thus physicians
would be able to deliver an optimal combination of therapies to the patient, in essence creating a
more effective, individualized approach to cancer therapy.
This paper presents the primary stages of this enterprise. Given the current challenges in
the computational modeling of cancer, we sought to specifically evaluate the predictive potential
of highly used modeling techniques and assess their value in order to facilitate the development
of the comprehensive, optimal diagnostic tool we envision.
Figure 1: This figure depicts the dismally low survival rate for AML patients (both male and female) in the U.S.,
highlighting the need for a better treatment strategy for AML. Data collected between 1988 and 2007. Figure
obtained from http://www.medinfographics.com/ and data corroborated from the American Cancer Society
(http://www.cancer.org).
4
After much theoretical evaluation, we chose to work with two currently used modeling
techniques—the Artificial Neural Network (ANN) and Logistic Regression (LR) to assess their
predictive potential. Research reveals that the ANN, a type of machine learning algorithm, is
excellent for dealing with a nonlinear, dichotomous outcome, the type of outcome expected for
our models, and it learns easily, rendering highly accurate output. However, it is expected to
exhibit a tendency to overfit data, given the extensive emphasis it places on “learning” the
training dataset completely (Burke et al. 1997). On the other hand, the LR, a standard model used
in probabilistic statistics, can take in several features and is easy to set up, although it has been
widely recognized by the modeling community to exhibit a tendency to underfit data, given its
relative simplicity (Smith et al. 1982). Thus, we hypothesized that, by assessing the tendency of
the ANN to overfit and the LR to underfit simultaneously, we would gain a better understanding
of how to potentially use the two modeling techniques to complement each other and produce a
more accurate, comprehensive model.
2. Methods
2.1 Overview of Methods
The process of developing and evaluating the code for the cancer models selected can be
divided into two main steps: data and models. The first large body of work this paper presents
regards organizing, visualizing, and sorting the data to prepare a dataset ready for input into the
modeling code. The second body of work, the process of coding the models, used the dataset
prepared by Step 1 for developing and evaluating model performance.
2.2 Organization and Visualization of Data
Data were collected by Dr. Steven M. Kornblau over the course of eight years from 191
patients at the M. D. Anderson Cancer Center in Texas. Each patient’s data consisted of clinical
5
correlates, including patient demographics, mutation status, and cytogenetic category, and
proteomic measurements from 231 antibodies indicating the level of total or phosphorylated
proteins on a scale of -5 to 5 for each given protein. For the purposes of this study, only protein
data was considered in developing prediction models; it was hypothesized that, as proteins play
an important role in the regulation of apoptosis, protein expression could significantly affect
cancer prognosis. A schematic representation of the format of the original protein data is
depicted in the following table:
ACTB AIFM AKTI1_2_3.pS473 …FN1 …ZNF346
1 0.185844713 -0.21783783 -0.097350442 -0.97929751 -0.15678498
2 0.24250154 0.770726524 0.277496831 -0.34302295 1.260718032
3 0.555895971 0.331599622 -1.614156048 1.626415093 0.147560248
…191 1.220082392 0.233040465 1.548540573 -0.80614041 -0.30311939
Additional visualization techniques were used to better understand protein expression
level for each patient, especially through heatmaps. The heatmap is interactive and can be
segmented as different groups of proteins are selected, allowing patients to be categorized by
their relative expression levels. While not of critical relevance to the development of the
prediction models, the heat maps were an important preliminary tool that allowed us to better
understand the format of the data provided more clearly and clarify the development of a data-
sorting algorithm (discussed in section 2.3).
Table 1: This table is a schematic representation of the type of data in the protein dataset. For each of the 231
named proteins, each of the 191 patients had a value between -5 and 5; this value, although initially inconsistent
between patients, corresponds to the level expression of the protein under consideration. Data obtained from M. D.
Anderson Cancer Center.
6
2.3 Sorting of Data
After understanding the data, we wanted to eliminate all present outliers to essentially
have a “clean” dataset. As we were working with human data, no established standard for
comparison for proteomic data existed. In order to account for this lack of a control, we started
by confirming the dataset was well-modeled by a normal distribution using the Shapiro Wilk
Normality Test. This test utilizes the null hypothesis principle to check if the sample is from a
normally distributed population with the following standard equation:
(Eq. 1)
After determining that our dataset was indeed a normally distributed population, we began the
elimination of outliers. A script to remove outliers beyond a 3.5 σ threshold was written in
Python. The following standard formula was utilized to calculate standard deviation values:
Figure 2: This figure depicts one of the primary forms of data visualization used in this study: the protein
heatmaps. Each ring in the heatmap represents a selected protein; in this heatmap, red corresponds to a higher
relative expression level, and blue corresponds to a lower expression level. Heatmap visualization technique
obtained from Sage Synapse: Dream 9 Challenge.
7
(Eq. 2)
Using this equation, which only includes values within a limited threshold, it was confirmed that
none of our data points were far from the median values. The script was run in iterations to
remove all detectable outliers to ensure that the data describe the majority of patients, critical to
producing an accurate model. All data points not in the 3.5 σ range for each individual protein
were eliminated. Eliminating those patients from the training data gave us a cleaner and more
statistically sound dataset with which to develop the models. Although clinical data was not used
extensively in this stage of the study, we subdivided the patients by their individual clinical
covariates and noticed that patients with certain clinical characteristics and protein expression
levels tend to exhibit similar trends when comparing remission rates, an interesting finding for
future considerations.
2.4 Model Development
Following the preparation of a cleaned dataset, this dataset was used as the training set to
develop prediction models, both with an Artificial Neural Network and Logistic Regression.
Both models were coded in Python to output a binary value: either 1 to indicate a patient going
into remission, or 0 to indicate primary resistance. Furthermore, both were developed with a
split-sample technique, using 75% of the training dataset for development and 25% for testing
and redesign. The Artificial Neural Network and Logistic Regression were each evaluated
separately to determine the possibility of integration.
2.4.1 Artificial Neural Networks (ANN)
To reiterate, an Artificial Neural Network, or ANN, is a type of machine learning that
seeks to mimic the human brain; specifically it models neurons and their connections. Each
8
neuron is referred to as a node, and these various nodes connect to form a network that mimics
the biological nervous system. Much like a human child, an ANN learns by practice and thus
needs to be trained on a given dataset once created. During the training process, the ANN learns
to recognize patters and complexities inherently present in the data before computing an output.
As shown in this oversimplified diagram, an ANN consists of input nodes, or neurons,
which make up the input layer. These inputs are fed to one or more hidden layers, which use the
ANN’s inbuilt algorithms to process the inputs and link them to an output layer, where the
answer is output:
The ANN used in this study was developed with 231 input notes, 128 hidden nodes, and 1 output
node. The tanh squashing function was chosen as the activation function of the hidden layer, as it
limits complexities in the learning algorithm. The ANN was trained using supervised learning
via the PyBrain library’s backpropagation algorithm, which calculates the gradient of a loss
function with respect to all weights already present in the network, goes backward through the
network, and updates all parameters so as to minimize error. An arbitrary threshold was set—the
Figure 3: This figure is an oversimplified representation of the architecture of a neural network. Input (protein
data) is fed in through the input nodes, after which the network uses the inbuilt algorithms in its hidden layer to
form connections between the input data points, strengthen connections through backpropagation, and output a
binary outcome.
9
ANN was trained on the dataset until its error was less than 1e^-15. In addition, in order to find
the optimal weights for a given network, networks were created and evaluated 1000 times—an
arbitrary number set through experimental observation—and the network that yielded the highest
overall accuracy was saved and used for further evaluation.
2.4.2 Logistic Regression (LR)
The LR, a standard probabilistic model used in statistics, uses the logistic function
(Eq. 3)
to take in the input dataset; it then assigns coefficients, or weights, to the data points, in order to
output a probability value between 0 and 1. For the purposes of this study, 0 would mean the
patient is primary resistant, and 1 would indicate his going into remission. To reiterate, a LR
does have several advantages: it is much more robust than a linear regression, does not tend to
overfit data, and can take in many input features. However, as previous discussed, theoretically it
may be hampered by its assumption of linearity and consequent tendency to underfit. We
hypothesized that this drawback were indeed revealed in the course of this research as well, it
would likely need to be accounted for in order to produce a robust model.
The LR in this study was developed using modules from the scikit-learn library in
Python. An L1-norm (Least Absolute Deviations) was chosen; although an L1-norm does not
always yield a stable solution, it is robust and has a built-in feature selection method, factors we
considered important when working with protein data of a diverse nature. The regularization
parameter C was experimentally set to 1.0. Following evaluation of the model’s output, the
capacity of the LR to output probability values, a confidence interval, and decision scores for
each of the patient’s in the test set was explored.
10
2.5 Model Evaluation
Both the ANN and LR models were evaluated following the calculation of True Positive
(TP), True Negative (TN), False Positive (FP), and False Negative (FN) rates using a module we
developed to output a confusion matrix:
Positive (actual) Negative (actual)
Positive (predicted) True Positive False Positive
Negative (predicted) False Negative True Negative
Calculating the TP, TN, FP, and FN allowed us to extract a wealth of analysis; we specifically
focused on the following five criteria, as research reveals them to be the most clinically relevant:
1. Sensitivity: the likelihood of the test to correctly identify a patient who will not go into
remission
2. Specificity: the likelihood of the test to correctly evaluate a patient who will go into
remission
3. Positive Predictive Value (PPV): the probability that a patient who tests positive will
actually go into remission
4. Negative Predictive Value (NPV): the probability that a patient who tests negative will
not go into remission and exhibit resistance
5. Accuracy: the overall accuracy of the model, as computed by the sum of the number of
correctly classified positives and number of correctly classified negatives divided by the
total number of data points in the dataset.
Following the evaluation of the models with the abovementioned criteria, additional avenues for
research were explored, including the ability of the LR to produce information such as a
confidence interval.
Table 2: This table depicts the structure of the confusion matrix used to evaluate results.
11
3. Results
This study presents the beginning stages of a long-term effort to establish a thorough
basis for researchers in the pursuit of developing a comprehensive model for AML patients.
However, it is hoped that this study and similar ones in the future simultaneously contribute to a
broader understanding of cancer modeling techniques as a whole. During this project, we
evaluated two widely used modeling techniques—the ANN and LR—in view of this long-term
goal; thus, our results are presented in line with their potential implications.
3.1 ANN Results
The following table summarizes the results obtained from the ANN:
Sensitivity 0.82
Specificity 0.93
PPV 0.96
NPV 0.72
Accuracy 0.86
Significant features in these results include the high specificity and PPV values, which indicate
to us that the ANN developed succeeds in correctly identifying patients who will indeed go into
remission. Thus, the ANN specifically exhibits the capacity to recognize protein profiles of
patients almost certain to go into remission, a predictive capacity that would be of high clinical
value. However, the ANN exhibits difficulty in recognizing profiles of patients likely to be
resistant—an avenue that would need to be improved upon to create a fully comprehensive
model for clinical use.
To evaluate the nature of the ANN to overfit to data, we additionally tested it with its
own training dataset, for which the results are summarized below:
Table 3: ANN results with the test dataset with respect to the 5 criteria
12
Sensitivity 1.0
Specificity 1.0
PPV 1.0
NPV 1.0
Accuracy 1.0
These results confirm the ANN’s tendency to overfit, as revealed by the perfect scores output
when tested on the training data, indicating that, while the ANN is excellent at learning the
trends and patterns inherent in a dataset, it would likely need either a larger dataset or integration
with another, more simplified model to increase its accuracy with unknown data. Nevertheless,
this result is significant, as it confirms both the ANN’s major successes and its drawback and
thus highlights the path needed to use an ANN most effectively.
3.2 LR Results
The following table summarizes the results obtained from the LR:
Sensitivity 0.71
Specificity 0.43
PPV 0.71
NPV 0.43
Accuracy 0.62
As displayed by the LR’s relatively poor performance, especially in determining
specificity and NPV, it became evident to us that the LR, which likely does underfit as
hypothesized, is unreliable when used as the sole predictive model. Thus, we explored other
means of exploiting the LR’s capacities to use it as a supplementary, or confirmatory, model in
the future. We developed modules to successfully extract probability scores and a confidence
interval for each patient’s profile, a development that is significant, as it allows us to individually
identify the model’s confidence regarding a given patient. This information, when integrated into
Table 4: ANN results with the training dataset with respect to the 5 criteria
Table 5: LR results with the test dataset with respect to the 5 criteria
13
another model, would establish in essence a system of “checks and balances” where a potentially
incorrect output may be reevaluated and corrected with the additional input of probability and
confidence scores.
4. Application
We believe that this study, which is unique in its exploration of different avenues with the
goal of developing the optimal model, has several implications for cancer research, both
immediately and in the long-term. The current results of both models point us towards an
integration of the ANN and LR, a little-investigated approach to cancer modeling that may yield
the most promising results: the ANN, an otherwise powerful predictive tool, can compensate for
its one drawback, its nature to overfit, by incorporating models such as the LR, which are
unreliable when used alone but provide essential information as input as part of a greater,
comprehensive model. Perhaps more importantly, in the long term, the models we are continuing
to research and develop are the fundamental steps in creating a novel tool for physicians. This
tool will allow doctors to view an AML patient’s profile at the time of diagnosis and
immediately determine the likelihood of the patient to respond to current therapies. Recognizing
either remission or resistance, the doctor can use the model’s prediction to identify the best
possible treatment path for the patient, creating a much-needed accurate, individualized approach
to cancer therapy.
5. Conclusions and Future Work
Our study provides the first set of code modules and the first evaluation that our mentors’
research group will be using for years to come as part of a larger effort to improve cancer
modeling. This research, which points us to the necessity of integration of more than one
modeling technique, opens up a new path for other researchers to create a more effective model.
14
We continue to explore additional avenues to improve the process of cancer modeling,
many of which will continue under other researchers. Future steps include devising an algorithm
to quantify clinical correlates so they can corroborate with proteomic data once incorporated into
a computational model. Furthermore, we look to construct a dynamical system for our data—a
model that is different from the traditional computational approach to modeling by closely
emulating human cognition, which happens continuously and linearly rather than cyclically. The
development of these improved models as well as of a website for doctors to use these models
will continue through 2015 into future years.
Works Cited
ACS Home. (2014). Viewed 8 August 2014. Web. http://www.cancer.org/
Burke, Harry B. and Philip H. Goodman, David B. Rosen, Donald E. Henson, John N.
Weinstein, Frank E. Harrell, Jr., Jeffrey R. Marks, David P. Winchester, and David G.
Bostwick. 1997. “Artificial Neural Networks Improve the Accuracy of Cancer Survival
Prediction.” American Cancer Society 79(4): 857-862.
Durrett, Rick. 2013. “Cancer Modeling: A Personal Perspective.” Notices of the AMS 60(3): 304-
309.
Freedman, Andrew N., and Daniela Seminara, Mitchell H. Gail, Patricia Hartge, Graham A.
Colditz, Rachel Ballard-Barbash, and Ruth M. Pfeiffer. “Cancer Risk Prediction Models:
A Workshop on Development, Evaluation, and Application.” Journal of the National
Cancer Institute 97(10): 715-723.
Quaranta, Vito and Alissa M. Weaver, Peter T. Cummings, and Alexandra R. A. Anderson.
2005. “Mathematical Modeling of Cancer: The Future of Prognosis and Treatment.”
Clinica Chimica Acta 357(2): 173-179.
Smith, Terry L., and Edmund A. Gehan, Michael J. Keating, and Emil J. Freireich. 1982.
“Prediction of Remission in Adult Acute Leukemia.” Cancer 50: 466-472.
Stone, Richard M., and Margaret R. O’Donnell, and Mikkael A. Sekeres. 2004. “Acute Myeloid
Leukemia.” Hematology 1: 98-117.
Works Consulted
Delen, Dursun, and Glenn Walker, and Amit Kadam. 2004. “Predicting Breast Cancer
Survivability: A Comparison of Three Data Mining Methods.” Artificial Intelligence in
Medicine 34: 113-127.
Herst, Patries M., and Rebecca A. Howman, Paul J. Neeson, Michael V. Berridge, and David S.
Ritchie. 2010. “The Level of Glycolytic Metabolism in Acute Myeloid Leukemia Blasts
at Diagnosis is Prognostic for Clinical Outcome.” Journal of Leukocyte Biology 89: 51-
55.
Li, Lihua, and Hong Tang, Zuobao Wu, Jianli Gong, Michael Gruidl, Jun Zou, Melvyn
Tockman, and Robert A. Clark. 2004. “Data Mining Techniques for Cancer Detection
Using Serum Proteomic Profiling.” Artificial Intelligence in Medicine 32: 71-83.

More Related Content

What's hot

Breast cancer diagnosis and recurrence prediction using machine learning tech...
Breast cancer diagnosis and recurrence prediction using machine learning tech...Breast cancer diagnosis and recurrence prediction using machine learning tech...
Breast cancer diagnosis and recurrence prediction using machine learning tech...
eSAT Journals
 
1. appl. statist. (2015)
1. appl. statist. (2015)1. appl. statist. (2015)
1. appl. statist. (2015)
Gitanambiar
 
International Journal of Biometrics and Bioinformatics(IJBB) Volume (3) Issue...
International Journal of Biometrics and Bioinformatics(IJBB) Volume (3) Issue...International Journal of Biometrics and Bioinformatics(IJBB) Volume (3) Issue...
International Journal of Biometrics and Bioinformatics(IJBB) Volume (3) Issue...CSCJournals
 
A Comparative Study on the Methods Used for the Detection of Breast Cancer
A Comparative Study on the Methods Used for the Detection of Breast CancerA Comparative Study on the Methods Used for the Detection of Breast Cancer
A Comparative Study on the Methods Used for the Detection of Breast Cancer
rahulmonikasharma
 
Survival Analysis of Determinants of Breast Cancer Patients at Hossana Queen ...
Survival Analysis of Determinants of Breast Cancer Patients at Hossana Queen ...Survival Analysis of Determinants of Breast Cancer Patients at Hossana Queen ...
Survival Analysis of Determinants of Breast Cancer Patients at Hossana Queen ...
Premier Publishers
 
research poster - karishma patel
research poster - karishma patelresearch poster - karishma patel
research poster - karishma patelkarishma patel
 
Medical Statistics used in Oncology
Medical Statistics used in OncologyMedical Statistics used in Oncology
Medical Statistics used in Oncology
Namrata Das
 
On Predicting and Analyzing Breast Cancer using Data Mining Approach
On Predicting and Analyzing Breast Cancer using Data Mining ApproachOn Predicting and Analyzing Breast Cancer using Data Mining Approach
On Predicting and Analyzing Breast Cancer using Data Mining Approach
Masud Rana Basunia
 
Breast cancer classification
Breast cancer classificationBreast cancer classification
Breast cancer classification
Ashwan Abdulmunem
 
Policy Implications of Methods Used for Analyzing Intensive Care Costs of Acu...
Policy Implications of Methods Used for Analyzing Intensive Care Costs of Acu...Policy Implications of Methods Used for Analyzing Intensive Care Costs of Acu...
Policy Implications of Methods Used for Analyzing Intensive Care Costs of Acu...
Leonard Davis Institute of Health Economics
 
MINING OF IMPORTANT INFORMATIVE GENES AND CLASSIFIER CONSTRUCTION FOR CANCER ...
MINING OF IMPORTANT INFORMATIVE GENES AND CLASSIFIER CONSTRUCTION FOR CANCER ...MINING OF IMPORTANT INFORMATIVE GENES AND CLASSIFIER CONSTRUCTION FOR CANCER ...
MINING OF IMPORTANT INFORMATIVE GENES AND CLASSIFIER CONSTRUCTION FOR CANCER ...
ijsc
 
Digital Pathology, FDA Approval and Precision Medicine
Digital Pathology, FDA Approval and Precision MedicineDigital Pathology, FDA Approval and Precision Medicine
Digital Pathology, FDA Approval and Precision Medicine
Joel Saltz
 
Ensemble Classifier Approach in Breast Cancer Detection and Malignancy Gradin...
Ensemble Classifier Approach in Breast Cancer Detection and Malignancy Gradin...Ensemble Classifier Approach in Breast Cancer Detection and Malignancy Gradin...
Ensemble Classifier Approach in Breast Cancer Detection and Malignancy Gradin...
ijmpict
 
Innovative Technique for Gene Selection in Microarray Based on Recursive Clus...
Innovative Technique for Gene Selection in Microarray Based on Recursive Clus...Innovative Technique for Gene Selection in Microarray Based on Recursive Clus...
Innovative Technique for Gene Selection in Microarray Based on Recursive Clus...
AM Publications
 
Outlier Modification and Gene Selection for Binary Cancer Classification usin...
Outlier Modification and Gene Selection for Binary Cancer Classification usin...Outlier Modification and Gene Selection for Binary Cancer Classification usin...
Outlier Modification and Gene Selection for Binary Cancer Classification usin...
CSCJournals
 
Digital Pathology: Precision Medicine, Deep Learning and Computer Aided Inter...
Digital Pathology: Precision Medicine, Deep Learning and Computer Aided Inter...Digital Pathology: Precision Medicine, Deep Learning and Computer Aided Inter...
Digital Pathology: Precision Medicine, Deep Learning and Computer Aided Inter...
Joel Saltz
 
Association between delayed initiation of adjuvant CMF or anthracycline-based...
Association between delayed initiation of adjuvant CMF or anthracycline-based...Association between delayed initiation of adjuvant CMF or anthracycline-based...
Association between delayed initiation of adjuvant CMF or anthracycline-based...
Enrique Moreno Gonzalez
 
Senology Newsletter - April 10, 2013
Senology Newsletter - April 10, 2013Senology Newsletter - April 10, 2013
Senology Newsletter - April 10, 2013
Senology.org
 

What's hot (20)

Breast cancer diagnosis and recurrence prediction using machine learning tech...
Breast cancer diagnosis and recurrence prediction using machine learning tech...Breast cancer diagnosis and recurrence prediction using machine learning tech...
Breast cancer diagnosis and recurrence prediction using machine learning tech...
 
1. appl. statist. (2015)
1. appl. statist. (2015)1. appl. statist. (2015)
1. appl. statist. (2015)
 
International Journal of Biometrics and Bioinformatics(IJBB) Volume (3) Issue...
International Journal of Biometrics and Bioinformatics(IJBB) Volume (3) Issue...International Journal of Biometrics and Bioinformatics(IJBB) Volume (3) Issue...
International Journal of Biometrics and Bioinformatics(IJBB) Volume (3) Issue...
 
A Comparative Study on the Methods Used for the Detection of Breast Cancer
A Comparative Study on the Methods Used for the Detection of Breast CancerA Comparative Study on the Methods Used for the Detection of Breast Cancer
A Comparative Study on the Methods Used for the Detection of Breast Cancer
 
Survival Analysis of Determinants of Breast Cancer Patients at Hossana Queen ...
Survival Analysis of Determinants of Breast Cancer Patients at Hossana Queen ...Survival Analysis of Determinants of Breast Cancer Patients at Hossana Queen ...
Survival Analysis of Determinants of Breast Cancer Patients at Hossana Queen ...
 
research poster - karishma patel
research poster - karishma patelresearch poster - karishma patel
research poster - karishma patel
 
Medical Statistics used in Oncology
Medical Statistics used in OncologyMedical Statistics used in Oncology
Medical Statistics used in Oncology
 
On Predicting and Analyzing Breast Cancer using Data Mining Approach
On Predicting and Analyzing Breast Cancer using Data Mining ApproachOn Predicting and Analyzing Breast Cancer using Data Mining Approach
On Predicting and Analyzing Breast Cancer using Data Mining Approach
 
Breast cancer classification
Breast cancer classificationBreast cancer classification
Breast cancer classification
 
Policy Implications of Methods Used for Analyzing Intensive Care Costs of Acu...
Policy Implications of Methods Used for Analyzing Intensive Care Costs of Acu...Policy Implications of Methods Used for Analyzing Intensive Care Costs of Acu...
Policy Implications of Methods Used for Analyzing Intensive Care Costs of Acu...
 
MINING OF IMPORTANT INFORMATIVE GENES AND CLASSIFIER CONSTRUCTION FOR CANCER ...
MINING OF IMPORTANT INFORMATIVE GENES AND CLASSIFIER CONSTRUCTION FOR CANCER ...MINING OF IMPORTANT INFORMATIVE GENES AND CLASSIFIER CONSTRUCTION FOR CANCER ...
MINING OF IMPORTANT INFORMATIVE GENES AND CLASSIFIER CONSTRUCTION FOR CANCER ...
 
Digital Pathology, FDA Approval and Precision Medicine
Digital Pathology, FDA Approval and Precision MedicineDigital Pathology, FDA Approval and Precision Medicine
Digital Pathology, FDA Approval and Precision Medicine
 
Ensemble Classifier Approach in Breast Cancer Detection and Malignancy Gradin...
Ensemble Classifier Approach in Breast Cancer Detection and Malignancy Gradin...Ensemble Classifier Approach in Breast Cancer Detection and Malignancy Gradin...
Ensemble Classifier Approach in Breast Cancer Detection and Malignancy Gradin...
 
Innovative Technique for Gene Selection in Microarray Based on Recursive Clus...
Innovative Technique for Gene Selection in Microarray Based on Recursive Clus...Innovative Technique for Gene Selection in Microarray Based on Recursive Clus...
Innovative Technique for Gene Selection in Microarray Based on Recursive Clus...
 
Outlier Modification and Gene Selection for Binary Cancer Classification usin...
Outlier Modification and Gene Selection for Binary Cancer Classification usin...Outlier Modification and Gene Selection for Binary Cancer Classification usin...
Outlier Modification and Gene Selection for Binary Cancer Classification usin...
 
Campbell stewardship report 2011
Campbell stewardship report 2011Campbell stewardship report 2011
Campbell stewardship report 2011
 
Digital Pathology: Precision Medicine, Deep Learning and Computer Aided Inter...
Digital Pathology: Precision Medicine, Deep Learning and Computer Aided Inter...Digital Pathology: Precision Medicine, Deep Learning and Computer Aided Inter...
Digital Pathology: Precision Medicine, Deep Learning and Computer Aided Inter...
 
Cga
CgaCga
Cga
 
Association between delayed initiation of adjuvant CMF or anthracycline-based...
Association between delayed initiation of adjuvant CMF or anthracycline-based...Association between delayed initiation of adjuvant CMF or anthracycline-based...
Association between delayed initiation of adjuvant CMF or anthracycline-based...
 
Senology Newsletter - April 10, 2013
Senology Newsletter - April 10, 2013Senology Newsletter - April 10, 2013
Senology Newsletter - April 10, 2013
 

Similar to Anjali_Ganguly_Siemens_2014

USING DATA MINING TECHNIQUES FOR DIAGNOSIS AND PROGNOSIS OF CANCER DISEASE
USING DATA MINING TECHNIQUES FOR DIAGNOSIS AND PROGNOSIS OF CANCER DISEASEUSING DATA MINING TECHNIQUES FOR DIAGNOSIS AND PROGNOSIS OF CANCER DISEASE
USING DATA MINING TECHNIQUES FOR DIAGNOSIS AND PROGNOSIS OF CANCER DISEASE
IJCSEIT Journal
 
E-book Thesis Sara Carvalho
E-book Thesis  Sara CarvalhoE-book Thesis  Sara Carvalho
E-book Thesis Sara CarvalhoSara Carvalho
 
PREDICTION OF BREAST CANCER,COMPARATIVE REVIEW OF MACHINE LEARNING TECHNIQUES...
PREDICTION OF BREAST CANCER,COMPARATIVE REVIEW OF MACHINE LEARNING TECHNIQUES...PREDICTION OF BREAST CANCER,COMPARATIVE REVIEW OF MACHINE LEARNING TECHNIQUES...
PREDICTION OF BREAST CANCER,COMPARATIVE REVIEW OF MACHINE LEARNING TECHNIQUES...
IRJET Journal
 
1streview_cancer_1.pptx
1streview_cancer_1.pptx1streview_cancer_1.pptx
1streview_cancer_1.pptx
JeyamGv
 
PREDICTION OF BREAST CANCER USING DATA MINING TECHNIQUES
PREDICTION OF BREAST CANCER USING DATA MINING TECHNIQUESPREDICTION OF BREAST CANCER USING DATA MINING TECHNIQUES
PREDICTION OF BREAST CANCER USING DATA MINING TECHNIQUES
IAEME Publication
 
Annotation Editorial
Annotation EditorialAnnotation Editorial
Annotation Editorial
AbhishekPuri27
 
A Review on Data Mining Techniques for Prediction of Breast Cancer Recurrence
A Review on Data Mining Techniques for Prediction of Breast Cancer RecurrenceA Review on Data Mining Techniques for Prediction of Breast Cancer Recurrence
A Review on Data Mining Techniques for Prediction of Breast Cancer Recurrence
Dr. Amarjeet Singh
 
Evaluation of Logistic Regression and Neural Network Model With Sensitivity A...
Evaluation of Logistic Regression and Neural Network Model With Sensitivity A...Evaluation of Logistic Regression and Neural Network Model With Sensitivity A...
Evaluation of Logistic Regression and Neural Network Model With Sensitivity A...
CSCJournals
 
[ASGO 2019] Artificial Intelligence in Medicine
[ASGO 2019] Artificial Intelligence in Medicine[ASGO 2019] Artificial Intelligence in Medicine
[ASGO 2019] Artificial Intelligence in Medicine
Yoon Sup Choi
 
REVIEW OF MACHINE LEARNING APPLICATIONS AND DATASETS IN CLASSIFICATION OF ACU...
REVIEW OF MACHINE LEARNING APPLICATIONS AND DATASETS IN CLASSIFICATION OF ACU...REVIEW OF MACHINE LEARNING APPLICATIONS AND DATASETS IN CLASSIFICATION OF ACU...
REVIEW OF MACHINE LEARNING APPLICATIONS AND DATASETS IN CLASSIFICATION OF ACU...
IJDKP
 
Development and Validation of a Nomogram for Predicting Response to Neoadjuva...
Development and Validation of a Nomogram for Predicting Response to Neoadjuva...Development and Validation of a Nomogram for Predicting Response to Neoadjuva...
Development and Validation of a Nomogram for Predicting Response to Neoadjuva...
semualkaira
 
Development and Validation of a Nomogram for Predicting Response to Neoadjuva...
Development and Validation of a Nomogram for Predicting Response to Neoadjuva...Development and Validation of a Nomogram for Predicting Response to Neoadjuva...
Development and Validation of a Nomogram for Predicting Response to Neoadjuva...
semualkaira
 
Comparison of breast cancer classification models on Wisconsin dataset
Comparison of breast cancer classification models on Wisconsin  datasetComparison of breast cancer classification models on Wisconsin  dataset
Comparison of breast cancer classification models on Wisconsin dataset
International Journal of Reconfigurable and Embedded Systems
 
i.a.Preoperative ovarian cancer diagnosis using neuro fuzzy approach
i.a.Preoperative ovarian cancer diagnosis using neuro fuzzy approachi.a.Preoperative ovarian cancer diagnosis using neuro fuzzy approach
i.a.Preoperative ovarian cancer diagnosis using neuro fuzzy approach
Jonathan Josue Cid Galiot
 
INTEGRATING MACHINE LEARNING IN CLINICAL DECISION SUPPORT SYSTEMS
INTEGRATING MACHINE LEARNING IN CLINICAL DECISION SUPPORT SYSTEMSINTEGRATING MACHINE LEARNING IN CLINICAL DECISION SUPPORT SYSTEMS
INTEGRATING MACHINE LEARNING IN CLINICAL DECISION SUPPORT SYSTEMS
hiij
 
INTEGRATING MACHINE LEARNING IN CLINICAL DECISION SUPPORT SYSTEMS
INTEGRATING MACHINE LEARNING IN CLINICAL DECISION SUPPORT SYSTEMSINTEGRATING MACHINE LEARNING IN CLINICAL DECISION SUPPORT SYSTEMS
INTEGRATING MACHINE LEARNING IN CLINICAL DECISION SUPPORT SYSTEMS
hiij
 
PancreaticCancerFinalPaper
PancreaticCancerFinalPaperPancreaticCancerFinalPaper
PancreaticCancerFinalPaperVikram Babu
 
Breast Tumor Detection Using Efficient Machine Learning and Deep Learning Tec...
Breast Tumor Detection Using Efficient Machine Learning and Deep Learning Tec...Breast Tumor Detection Using Efficient Machine Learning and Deep Learning Tec...
Breast Tumor Detection Using Efficient Machine Learning and Deep Learning Tec...
mlaij
 
BREAST TUMOR DETECTION USING EFFICIENT MACHINE LEARNING AND DEEP LEARNING TEC...
BREAST TUMOR DETECTION USING EFFICIENT MACHINE LEARNING AND DEEP LEARNING TEC...BREAST TUMOR DETECTION USING EFFICIENT MACHINE LEARNING AND DEEP LEARNING TEC...
BREAST TUMOR DETECTION USING EFFICIENT MACHINE LEARNING AND DEEP LEARNING TEC...
mlaij
 

Similar to Anjali_Ganguly_Siemens_2014 (20)

JCO_Editorial_Nov2011
JCO_Editorial_Nov2011JCO_Editorial_Nov2011
JCO_Editorial_Nov2011
 
USING DATA MINING TECHNIQUES FOR DIAGNOSIS AND PROGNOSIS OF CANCER DISEASE
USING DATA MINING TECHNIQUES FOR DIAGNOSIS AND PROGNOSIS OF CANCER DISEASEUSING DATA MINING TECHNIQUES FOR DIAGNOSIS AND PROGNOSIS OF CANCER DISEASE
USING DATA MINING TECHNIQUES FOR DIAGNOSIS AND PROGNOSIS OF CANCER DISEASE
 
E-book Thesis Sara Carvalho
E-book Thesis  Sara CarvalhoE-book Thesis  Sara Carvalho
E-book Thesis Sara Carvalho
 
PREDICTION OF BREAST CANCER,COMPARATIVE REVIEW OF MACHINE LEARNING TECHNIQUES...
PREDICTION OF BREAST CANCER,COMPARATIVE REVIEW OF MACHINE LEARNING TECHNIQUES...PREDICTION OF BREAST CANCER,COMPARATIVE REVIEW OF MACHINE LEARNING TECHNIQUES...
PREDICTION OF BREAST CANCER,COMPARATIVE REVIEW OF MACHINE LEARNING TECHNIQUES...
 
1streview_cancer_1.pptx
1streview_cancer_1.pptx1streview_cancer_1.pptx
1streview_cancer_1.pptx
 
PREDICTION OF BREAST CANCER USING DATA MINING TECHNIQUES
PREDICTION OF BREAST CANCER USING DATA MINING TECHNIQUESPREDICTION OF BREAST CANCER USING DATA MINING TECHNIQUES
PREDICTION OF BREAST CANCER USING DATA MINING TECHNIQUES
 
Annotation Editorial
Annotation EditorialAnnotation Editorial
Annotation Editorial
 
A Review on Data Mining Techniques for Prediction of Breast Cancer Recurrence
A Review on Data Mining Techniques for Prediction of Breast Cancer RecurrenceA Review on Data Mining Techniques for Prediction of Breast Cancer Recurrence
A Review on Data Mining Techniques for Prediction of Breast Cancer Recurrence
 
Evaluation of Logistic Regression and Neural Network Model With Sensitivity A...
Evaluation of Logistic Regression and Neural Network Model With Sensitivity A...Evaluation of Logistic Regression and Neural Network Model With Sensitivity A...
Evaluation of Logistic Regression and Neural Network Model With Sensitivity A...
 
[ASGO 2019] Artificial Intelligence in Medicine
[ASGO 2019] Artificial Intelligence in Medicine[ASGO 2019] Artificial Intelligence in Medicine
[ASGO 2019] Artificial Intelligence in Medicine
 
REVIEW OF MACHINE LEARNING APPLICATIONS AND DATASETS IN CLASSIFICATION OF ACU...
REVIEW OF MACHINE LEARNING APPLICATIONS AND DATASETS IN CLASSIFICATION OF ACU...REVIEW OF MACHINE LEARNING APPLICATIONS AND DATASETS IN CLASSIFICATION OF ACU...
REVIEW OF MACHINE LEARNING APPLICATIONS AND DATASETS IN CLASSIFICATION OF ACU...
 
Development and Validation of a Nomogram for Predicting Response to Neoadjuva...
Development and Validation of a Nomogram for Predicting Response to Neoadjuva...Development and Validation of a Nomogram for Predicting Response to Neoadjuva...
Development and Validation of a Nomogram for Predicting Response to Neoadjuva...
 
Development and Validation of a Nomogram for Predicting Response to Neoadjuva...
Development and Validation of a Nomogram for Predicting Response to Neoadjuva...Development and Validation of a Nomogram for Predicting Response to Neoadjuva...
Development and Validation of a Nomogram for Predicting Response to Neoadjuva...
 
Comparison of breast cancer classification models on Wisconsin dataset
Comparison of breast cancer classification models on Wisconsin  datasetComparison of breast cancer classification models on Wisconsin  dataset
Comparison of breast cancer classification models on Wisconsin dataset
 
i.a.Preoperative ovarian cancer diagnosis using neuro fuzzy approach
i.a.Preoperative ovarian cancer diagnosis using neuro fuzzy approachi.a.Preoperative ovarian cancer diagnosis using neuro fuzzy approach
i.a.Preoperative ovarian cancer diagnosis using neuro fuzzy approach
 
INTEGRATING MACHINE LEARNING IN CLINICAL DECISION SUPPORT SYSTEMS
INTEGRATING MACHINE LEARNING IN CLINICAL DECISION SUPPORT SYSTEMSINTEGRATING MACHINE LEARNING IN CLINICAL DECISION SUPPORT SYSTEMS
INTEGRATING MACHINE LEARNING IN CLINICAL DECISION SUPPORT SYSTEMS
 
INTEGRATING MACHINE LEARNING IN CLINICAL DECISION SUPPORT SYSTEMS
INTEGRATING MACHINE LEARNING IN CLINICAL DECISION SUPPORT SYSTEMSINTEGRATING MACHINE LEARNING IN CLINICAL DECISION SUPPORT SYSTEMS
INTEGRATING MACHINE LEARNING IN CLINICAL DECISION SUPPORT SYSTEMS
 
PancreaticCancerFinalPaper
PancreaticCancerFinalPaperPancreaticCancerFinalPaper
PancreaticCancerFinalPaper
 
Breast Tumor Detection Using Efficient Machine Learning and Deep Learning Tec...
Breast Tumor Detection Using Efficient Machine Learning and Deep Learning Tec...Breast Tumor Detection Using Efficient Machine Learning and Deep Learning Tec...
Breast Tumor Detection Using Efficient Machine Learning and Deep Learning Tec...
 
BREAST TUMOR DETECTION USING EFFICIENT MACHINE LEARNING AND DEEP LEARNING TEC...
BREAST TUMOR DETECTION USING EFFICIENT MACHINE LEARNING AND DEEP LEARNING TEC...BREAST TUMOR DETECTION USING EFFICIENT MACHINE LEARNING AND DEEP LEARNING TEC...
BREAST TUMOR DETECTION USING EFFICIENT MACHINE LEARNING AND DEEP LEARNING TEC...
 

Anjali_Ganguly_Siemens_2014

  • 1. Towards a Novel Model for the Prognosis of Acute Myeloid Leukemia Patients: An Evaluation of Cancer Modeling Techniques Executive Summary In recent years, as the incidence of cancer continues to climb, much research attention has been devoted to alternative methods of cancer management, among them computational modeling. While computational modeling offers many promises to cancer researchers, it faces several challenges as well, including the lack of a robust, clinically applicable cancer model. This study aims to develop an accurate, comprehensive predictive model for patients of Acute Myeloid Leukemia, one of the most devastating cancers. This paper presents the initial development of this model with the evaluation of the predictive potential of two widely used computational models, the Artificial Neural Network (ANN) and Logistic Regression (LR). Both the ANN and LR were developed in Python using protein expression data from 191 AML patients so that, given a patient’s profile at the time of diagnosis, the model could predict whether the patient would go into remission or exhibit resistance to current therapies for AML. The predictive potential of these models was measured using five criteria: sensitivity, specificity, positive predictive value, negative predictive value, and overall accuracy. The ANN exhibited excellent recognition of patients likely to go into remission, which would be greatly valuable in the clinic. While the LR did not perform as well, it did yield important statistical information that set it up as a likely supplement as part of a larger, robust model. Our results indicate that an integration of the ANN and LR will likely yield the most effective predictive tool, as the two together compensate for the flaws they exhibit individually. This research is the first step in the creation of a novel tool that doctors can use to predict a patient’s prognosis at the time of diagnosis, contributing to a more individualized, effective approach to cancer therapy.
  • 2.  
  • 3. Towards a Novel Model for the Prognosis of Acute Myeloid Leukemia Patients: An Evaluation of Cancer Modeling Techniques Abstract This paper presents the initial stages of the development of a predictive model for Acute Myeloid Leukemia (AML) patients. This study assessed the respective advantages and disadvantages of two widely used computational models, the Artificial Neural Network (ANN) and Logistic Regression (LR), in order to firstly, evaluate their potential to predict, given a patient’s profile at diagnosis, whether the patient will enter remission or exhibit primary resistance, and secondly, to offer a broader understanding of the current necessities of cancer modeling. The ANN and LR were both developed in Python using proteomic data (231 proteins) obtained from 191 AML patients. Predictive potential of models was measured using sensitivity, specificity, positive predictive value, negative predictive value, and overall accuracy. The ANN exhibited an excellent specificity and positive predictive value, indicating its potential clinical applications; however, it did exhibit a tendency to overfit to data, confirming one hypothesis of this research. While the LR was a relatively poor performer, it did yield important statistical information that set it up as a likely supplement as part of a larger, robust model. Thus, our results point us to integration of the two modeling techniques to create the novel predictive tool for physicians we envision.
  • 4. 1 1. Introduction Cancer persists today as one of the leading causes of mortality worldwide, threatening to claim almost 600,000 lives in the United States alone this year (ACS et al. 2014). As the incidence of cancer continues to climb, researchers are prompted to go beyond traditional techniques of treatment to explore alternative methods of cancer management. Among the various methods gaining popularity, mathematical and computational modeling has become an especially promising new avenue for cancer research. Medical society has mastered the art of data collection with regards to cancer: today, gathering and storing data about a patient’s clinical and genetic correlates is no longer the challenge. Instead, extracting valuable information from this wealth of “big data” proves to be the next large obstacle for cancer researchers to surmount (Quaranta et al. 2005). Here is how computational modeling, or a “top-down” approach to medicine, offers great potential; by providing researchers with the tools able to perform large-scale analysis, computational modeling, with enormous predictive capacity, may yield the tools necessary to improve the management of cancer starting from diagnosis. As the focus on cancer prediction models has grown, interest in ensuring their proper development and use is of the utmost importance (Durrett et al. 2013). However, cancer modeling faces challenges that currently prevent it from becoming widely adapted in clinics—as the type and number of cancer models continues to rise, the relative lack of assessment on the specific strengths and weakness of individual cancer models has resulted in a plethora of models that are functional but severely limited in scope, rendering these models useless in the clinic (Freedman et al. 2005). There is a need for a better
  • 5. 2 fundamental understanding of cancer modeling techniques in order to identify the best strategies to apply when modeling a specific type of cancer. This study focuses on Acute Myeloid Leukemia (AML), a cancer originating in bone marrow and the bone’s soft tissue. A heterogeneous clonal disorder in which hematopoietic precursors are restricted in early stages, AML has garnered much research attention in recent years; however, understanding the pathophysiology of AML has not greatly improved the five- year survival rate, which barely scrapes 24% (Stone et al. 2004). Several reasons account for the low rate of survival, including the rapid progression of the disease (as denoted by the term “acute”), but more important in limiting instances of recovery is the ineffective use of current AML therapies. Current therapies, which initially concentrate on chemotherapy coupled with allogenic hematopoietic stem cell transplantation, often induce relapse in AML patients. Thus, chemotherapy doses must be consistently augmented depending on the specific patient’s reaction, and this process eventually destroys bone marrow and results in the high mortality rate (Stone et al. 2004). The resistance to chemotherapy noted has in turn contributed to a hypothesis that the stem cells causing AML are particularly resistant to chemotherapy, eliminating one heavily used avenue in cancer treatment and highlighting the need for a tool capable of identifying the best treatment strategy for a given patient.
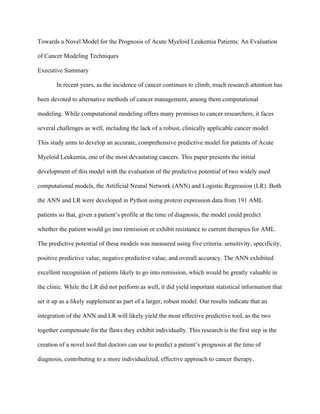
  • 6. 3 Thus, the ultimate goal of our research is to address this need for the betterment of AML treatment by developing the best prediction model that, given a patient’s profile, can predict whether he will be primary resistant (exhibiting a resistance to current therapies should they be applied) or whether he will reach complete remission (becoming cancer-free for a given amount of time). Developing this model as a predictive tool able to be used at the time of diagnosis would enable doctors to use the prediction of the model—either remission or resistant—to decide what treatment strategy would be best for the patient under consideration, and thus physicians would be able to deliver an optimal combination of therapies to the patient, in essence creating a more effective, individualized approach to cancer therapy. This paper presents the primary stages of this enterprise. Given the current challenges in the computational modeling of cancer, we sought to specifically evaluate the predictive potential of highly used modeling techniques and assess their value in order to facilitate the development of the comprehensive, optimal diagnostic tool we envision. Figure 1: This figure depicts the dismally low survival rate for AML patients (both male and female) in the U.S., highlighting the need for a better treatment strategy for AML. Data collected between 1988 and 2007. Figure obtained from http://www.medinfographics.com/ and data corroborated from the American Cancer Society (http://www.cancer.org).
  • 7. 4 After much theoretical evaluation, we chose to work with two currently used modeling techniques—the Artificial Neural Network (ANN) and Logistic Regression (LR) to assess their predictive potential. Research reveals that the ANN, a type of machine learning algorithm, is excellent for dealing with a nonlinear, dichotomous outcome, the type of outcome expected for our models, and it learns easily, rendering highly accurate output. However, it is expected to exhibit a tendency to overfit data, given the extensive emphasis it places on “learning” the training dataset completely (Burke et al. 1997). On the other hand, the LR, a standard model used in probabilistic statistics, can take in several features and is easy to set up, although it has been widely recognized by the modeling community to exhibit a tendency to underfit data, given its relative simplicity (Smith et al. 1982). Thus, we hypothesized that, by assessing the tendency of the ANN to overfit and the LR to underfit simultaneously, we would gain a better understanding of how to potentially use the two modeling techniques to complement each other and produce a more accurate, comprehensive model. 2. Methods 2.1 Overview of Methods The process of developing and evaluating the code for the cancer models selected can be divided into two main steps: data and models. The first large body of work this paper presents regards organizing, visualizing, and sorting the data to prepare a dataset ready for input into the modeling code. The second body of work, the process of coding the models, used the dataset prepared by Step 1 for developing and evaluating model performance. 2.2 Organization and Visualization of Data Data were collected by Dr. Steven M. Kornblau over the course of eight years from 191 patients at the M. D. Anderson Cancer Center in Texas. Each patient’s data consisted of clinical
  • 8. 5 correlates, including patient demographics, mutation status, and cytogenetic category, and proteomic measurements from 231 antibodies indicating the level of total or phosphorylated proteins on a scale of -5 to 5 for each given protein. For the purposes of this study, only protein data was considered in developing prediction models; it was hypothesized that, as proteins play an important role in the regulation of apoptosis, protein expression could significantly affect cancer prognosis. A schematic representation of the format of the original protein data is depicted in the following table: ACTB AIFM AKTI1_2_3.pS473 …FN1 …ZNF346 1 0.185844713 -0.21783783 -0.097350442 -0.97929751 -0.15678498 2 0.24250154 0.770726524 0.277496831 -0.34302295 1.260718032 3 0.555895971 0.331599622 -1.614156048 1.626415093 0.147560248 …191 1.220082392 0.233040465 1.548540573 -0.80614041 -0.30311939 Additional visualization techniques were used to better understand protein expression level for each patient, especially through heatmaps. The heatmap is interactive and can be segmented as different groups of proteins are selected, allowing patients to be categorized by their relative expression levels. While not of critical relevance to the development of the prediction models, the heat maps were an important preliminary tool that allowed us to better understand the format of the data provided more clearly and clarify the development of a data- sorting algorithm (discussed in section 2.3). Table 1: This table is a schematic representation of the type of data in the protein dataset. For each of the 231 named proteins, each of the 191 patients had a value between -5 and 5; this value, although initially inconsistent between patients, corresponds to the level expression of the protein under consideration. Data obtained from M. D. Anderson Cancer Center.
  • 9. 6 2.3 Sorting of Data After understanding the data, we wanted to eliminate all present outliers to essentially have a “clean” dataset. As we were working with human data, no established standard for comparison for proteomic data existed. In order to account for this lack of a control, we started by confirming the dataset was well-modeled by a normal distribution using the Shapiro Wilk Normality Test. This test utilizes the null hypothesis principle to check if the sample is from a normally distributed population with the following standard equation: (Eq. 1) After determining that our dataset was indeed a normally distributed population, we began the elimination of outliers. A script to remove outliers beyond a 3.5 σ threshold was written in Python. The following standard formula was utilized to calculate standard deviation values: Figure 2: This figure depicts one of the primary forms of data visualization used in this study: the protein heatmaps. Each ring in the heatmap represents a selected protein; in this heatmap, red corresponds to a higher relative expression level, and blue corresponds to a lower expression level. Heatmap visualization technique obtained from Sage Synapse: Dream 9 Challenge.
  • 10. 7 (Eq. 2) Using this equation, which only includes values within a limited threshold, it was confirmed that none of our data points were far from the median values. The script was run in iterations to remove all detectable outliers to ensure that the data describe the majority of patients, critical to producing an accurate model. All data points not in the 3.5 σ range for each individual protein were eliminated. Eliminating those patients from the training data gave us a cleaner and more statistically sound dataset with which to develop the models. Although clinical data was not used extensively in this stage of the study, we subdivided the patients by their individual clinical covariates and noticed that patients with certain clinical characteristics and protein expression levels tend to exhibit similar trends when comparing remission rates, an interesting finding for future considerations. 2.4 Model Development Following the preparation of a cleaned dataset, this dataset was used as the training set to develop prediction models, both with an Artificial Neural Network and Logistic Regression. Both models were coded in Python to output a binary value: either 1 to indicate a patient going into remission, or 0 to indicate primary resistance. Furthermore, both were developed with a split-sample technique, using 75% of the training dataset for development and 25% for testing and redesign. The Artificial Neural Network and Logistic Regression were each evaluated separately to determine the possibility of integration. 2.4.1 Artificial Neural Networks (ANN) To reiterate, an Artificial Neural Network, or ANN, is a type of machine learning that seeks to mimic the human brain; specifically it models neurons and their connections. Each
  • 11. 8 neuron is referred to as a node, and these various nodes connect to form a network that mimics the biological nervous system. Much like a human child, an ANN learns by practice and thus needs to be trained on a given dataset once created. During the training process, the ANN learns to recognize patters and complexities inherently present in the data before computing an output. As shown in this oversimplified diagram, an ANN consists of input nodes, or neurons, which make up the input layer. These inputs are fed to one or more hidden layers, which use the ANN’s inbuilt algorithms to process the inputs and link them to an output layer, where the answer is output: The ANN used in this study was developed with 231 input notes, 128 hidden nodes, and 1 output node. The tanh squashing function was chosen as the activation function of the hidden layer, as it limits complexities in the learning algorithm. The ANN was trained using supervised learning via the PyBrain library’s backpropagation algorithm, which calculates the gradient of a loss function with respect to all weights already present in the network, goes backward through the network, and updates all parameters so as to minimize error. An arbitrary threshold was set—the Figure 3: This figure is an oversimplified representation of the architecture of a neural network. Input (protein data) is fed in through the input nodes, after which the network uses the inbuilt algorithms in its hidden layer to form connections between the input data points, strengthen connections through backpropagation, and output a binary outcome.
  • 12. 9 ANN was trained on the dataset until its error was less than 1e^-15. In addition, in order to find the optimal weights for a given network, networks were created and evaluated 1000 times—an arbitrary number set through experimental observation—and the network that yielded the highest overall accuracy was saved and used for further evaluation. 2.4.2 Logistic Regression (LR) The LR, a standard probabilistic model used in statistics, uses the logistic function (Eq. 3) to take in the input dataset; it then assigns coefficients, or weights, to the data points, in order to output a probability value between 0 and 1. For the purposes of this study, 0 would mean the patient is primary resistant, and 1 would indicate his going into remission. To reiterate, a LR does have several advantages: it is much more robust than a linear regression, does not tend to overfit data, and can take in many input features. However, as previous discussed, theoretically it may be hampered by its assumption of linearity and consequent tendency to underfit. We hypothesized that this drawback were indeed revealed in the course of this research as well, it would likely need to be accounted for in order to produce a robust model. The LR in this study was developed using modules from the scikit-learn library in Python. An L1-norm (Least Absolute Deviations) was chosen; although an L1-norm does not always yield a stable solution, it is robust and has a built-in feature selection method, factors we considered important when working with protein data of a diverse nature. The regularization parameter C was experimentally set to 1.0. Following evaluation of the model’s output, the capacity of the LR to output probability values, a confidence interval, and decision scores for each of the patient’s in the test set was explored.
  • 13. 10 2.5 Model Evaluation Both the ANN and LR models were evaluated following the calculation of True Positive (TP), True Negative (TN), False Positive (FP), and False Negative (FN) rates using a module we developed to output a confusion matrix: Positive (actual) Negative (actual) Positive (predicted) True Positive False Positive Negative (predicted) False Negative True Negative Calculating the TP, TN, FP, and FN allowed us to extract a wealth of analysis; we specifically focused on the following five criteria, as research reveals them to be the most clinically relevant: 1. Sensitivity: the likelihood of the test to correctly identify a patient who will not go into remission 2. Specificity: the likelihood of the test to correctly evaluate a patient who will go into remission 3. Positive Predictive Value (PPV): the probability that a patient who tests positive will actually go into remission 4. Negative Predictive Value (NPV): the probability that a patient who tests negative will not go into remission and exhibit resistance 5. Accuracy: the overall accuracy of the model, as computed by the sum of the number of correctly classified positives and number of correctly classified negatives divided by the total number of data points in the dataset. Following the evaluation of the models with the abovementioned criteria, additional avenues for research were explored, including the ability of the LR to produce information such as a confidence interval. Table 2: This table depicts the structure of the confusion matrix used to evaluate results.
  • 14. 11 3. Results This study presents the beginning stages of a long-term effort to establish a thorough basis for researchers in the pursuit of developing a comprehensive model for AML patients. However, it is hoped that this study and similar ones in the future simultaneously contribute to a broader understanding of cancer modeling techniques as a whole. During this project, we evaluated two widely used modeling techniques—the ANN and LR—in view of this long-term goal; thus, our results are presented in line with their potential implications. 3.1 ANN Results The following table summarizes the results obtained from the ANN: Sensitivity 0.82 Specificity 0.93 PPV 0.96 NPV 0.72 Accuracy 0.86 Significant features in these results include the high specificity and PPV values, which indicate to us that the ANN developed succeeds in correctly identifying patients who will indeed go into remission. Thus, the ANN specifically exhibits the capacity to recognize protein profiles of patients almost certain to go into remission, a predictive capacity that would be of high clinical value. However, the ANN exhibits difficulty in recognizing profiles of patients likely to be resistant—an avenue that would need to be improved upon to create a fully comprehensive model for clinical use. To evaluate the nature of the ANN to overfit to data, we additionally tested it with its own training dataset, for which the results are summarized below: Table 3: ANN results with the test dataset with respect to the 5 criteria
  • 15. 12 Sensitivity 1.0 Specificity 1.0 PPV 1.0 NPV 1.0 Accuracy 1.0 These results confirm the ANN’s tendency to overfit, as revealed by the perfect scores output when tested on the training data, indicating that, while the ANN is excellent at learning the trends and patterns inherent in a dataset, it would likely need either a larger dataset or integration with another, more simplified model to increase its accuracy with unknown data. Nevertheless, this result is significant, as it confirms both the ANN’s major successes and its drawback and thus highlights the path needed to use an ANN most effectively. 3.2 LR Results The following table summarizes the results obtained from the LR: Sensitivity 0.71 Specificity 0.43 PPV 0.71 NPV 0.43 Accuracy 0.62 As displayed by the LR’s relatively poor performance, especially in determining specificity and NPV, it became evident to us that the LR, which likely does underfit as hypothesized, is unreliable when used as the sole predictive model. Thus, we explored other means of exploiting the LR’s capacities to use it as a supplementary, or confirmatory, model in the future. We developed modules to successfully extract probability scores and a confidence interval for each patient’s profile, a development that is significant, as it allows us to individually identify the model’s confidence regarding a given patient. This information, when integrated into Table 4: ANN results with the training dataset with respect to the 5 criteria Table 5: LR results with the test dataset with respect to the 5 criteria
  • 16. 13 another model, would establish in essence a system of “checks and balances” where a potentially incorrect output may be reevaluated and corrected with the additional input of probability and confidence scores. 4. Application We believe that this study, which is unique in its exploration of different avenues with the goal of developing the optimal model, has several implications for cancer research, both immediately and in the long-term. The current results of both models point us towards an integration of the ANN and LR, a little-investigated approach to cancer modeling that may yield the most promising results: the ANN, an otherwise powerful predictive tool, can compensate for its one drawback, its nature to overfit, by incorporating models such as the LR, which are unreliable when used alone but provide essential information as input as part of a greater, comprehensive model. Perhaps more importantly, in the long term, the models we are continuing to research and develop are the fundamental steps in creating a novel tool for physicians. This tool will allow doctors to view an AML patient’s profile at the time of diagnosis and immediately determine the likelihood of the patient to respond to current therapies. Recognizing either remission or resistance, the doctor can use the model’s prediction to identify the best possible treatment path for the patient, creating a much-needed accurate, individualized approach to cancer therapy. 5. Conclusions and Future Work Our study provides the first set of code modules and the first evaluation that our mentors’ research group will be using for years to come as part of a larger effort to improve cancer modeling. This research, which points us to the necessity of integration of more than one modeling technique, opens up a new path for other researchers to create a more effective model.
  • 17. 14 We continue to explore additional avenues to improve the process of cancer modeling, many of which will continue under other researchers. Future steps include devising an algorithm to quantify clinical correlates so they can corroborate with proteomic data once incorporated into a computational model. Furthermore, we look to construct a dynamical system for our data—a model that is different from the traditional computational approach to modeling by closely emulating human cognition, which happens continuously and linearly rather than cyclically. The development of these improved models as well as of a website for doctors to use these models will continue through 2015 into future years.
  • 18. Works Cited ACS Home. (2014). Viewed 8 August 2014. Web. http://www.cancer.org/ Burke, Harry B. and Philip H. Goodman, David B. Rosen, Donald E. Henson, John N. Weinstein, Frank E. Harrell, Jr., Jeffrey R. Marks, David P. Winchester, and David G. Bostwick. 1997. “Artificial Neural Networks Improve the Accuracy of Cancer Survival Prediction.” American Cancer Society 79(4): 857-862. Durrett, Rick. 2013. “Cancer Modeling: A Personal Perspective.” Notices of the AMS 60(3): 304- 309. Freedman, Andrew N., and Daniela Seminara, Mitchell H. Gail, Patricia Hartge, Graham A. Colditz, Rachel Ballard-Barbash, and Ruth M. Pfeiffer. “Cancer Risk Prediction Models: A Workshop on Development, Evaluation, and Application.” Journal of the National Cancer Institute 97(10): 715-723. Quaranta, Vito and Alissa M. Weaver, Peter T. Cummings, and Alexandra R. A. Anderson. 2005. “Mathematical Modeling of Cancer: The Future of Prognosis and Treatment.” Clinica Chimica Acta 357(2): 173-179. Smith, Terry L., and Edmund A. Gehan, Michael J. Keating, and Emil J. Freireich. 1982. “Prediction of Remission in Adult Acute Leukemia.” Cancer 50: 466-472. Stone, Richard M., and Margaret R. O’Donnell, and Mikkael A. Sekeres. 2004. “Acute Myeloid Leukemia.” Hematology 1: 98-117. Works Consulted Delen, Dursun, and Glenn Walker, and Amit Kadam. 2004. “Predicting Breast Cancer Survivability: A Comparison of Three Data Mining Methods.” Artificial Intelligence in Medicine 34: 113-127. Herst, Patries M., and Rebecca A. Howman, Paul J. Neeson, Michael V. Berridge, and David S. Ritchie. 2010. “The Level of Glycolytic Metabolism in Acute Myeloid Leukemia Blasts at Diagnosis is Prognostic for Clinical Outcome.” Journal of Leukocyte Biology 89: 51- 55. Li, Lihua, and Hong Tang, Zuobao Wu, Jianli Gong, Michael Gruidl, Jun Zou, Melvyn Tockman, and Robert A. Clark. 2004. “Data Mining Techniques for Cancer Detection Using Serum Proteomic Profiling.” Artificial Intelligence in Medicine 32: 71-83.