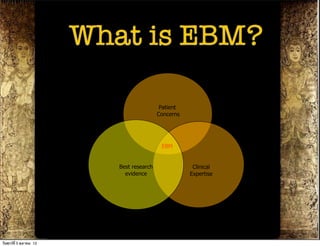
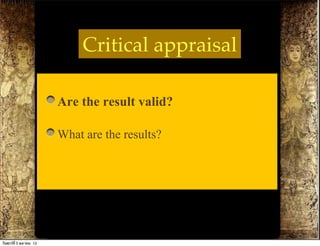
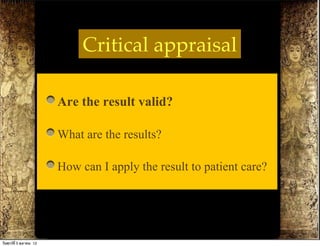
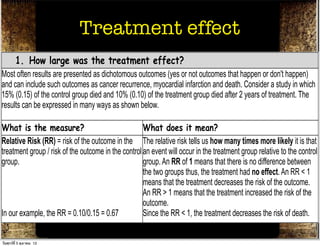
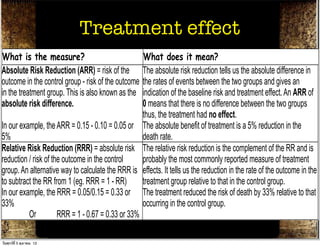
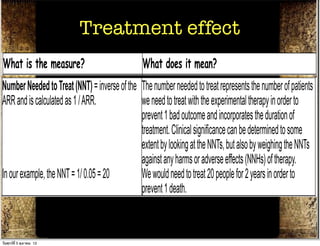
HOW TO APPRAISE
                          MEDICAL JOURNAL
                             (THERAPY)

                            นพ.บริบูรณ์ เชนธนากิจ
                                  หน่วยเวชศาสตร์ฉุกเฉิน
                                ภาควิชาเวชศาสตร์ครอบครัว
                            คณะแพทยศาสตร์มหาวิทยาลัยเชียงใหม่


วันศุกร์ท่ี 5 ตุลาคม 12
What is EBM?

                                              Patient
                                             Concerns


                                              EBM


                             Best research               Clinical
                               evidence                 Expertise


วันศุกร์ท่ี 5 ตุลาคม 12
Critical appraisal


วันศุกร์ท่ี 5 ตุลาคม 12
Critical appraisal

                          Are the result valid?


วันศุกร์ท่ี 5 ตุลาคม 12
Critical appraisal

                          Are the result valid?
                          What are the results?


วันศุกร์ท่ี 5 ตุลาคม 12
Critical appraisal

                          Are the result valid?
                          What are the results?
                          How can I apply the result to patient care?


วันศุกร์ท่ี 5 ตุลาคม 12
Are the result valid?
                          ประเด็นที่ต้องประเมินว่า RCT นั้นน่าจะมี BIAS
                          หรือไม่

                          1. Did Intervention & Control groups
                          start with same prognosis?

                          2. Was prognostic balanced maintained
                          as the study progressed?

                          3. Were the groups prognostically
                          balanced at the study’s complettion?

วันศุกร์ท่ี 5 ตุลาคม 12
Are the result valid?

                          1. Did Intervention & Control groups
                          start with same prognosis?
                            •Were patients randomized?
                            •Was randomization concealed?
                            •were patients similar in respect to
                              known prognostic factor

                          2. Was prognostic balanced maintained as the study progressed?


                          3. Were the groups prognostically balanced at the study’s
                          completion?


วันศุกร์ท่ี 5 ตุลาคม 12
THERAPY STUDY: Are the results of the trial valid? (Internal Validity)
What question did the study ask?
Patients –        Randomization
                 Intervention - Comparison -                                                Outcome(s) -
         1a. R- Was the assignment of patients to treatments randomised?
What is best?                                             Where do I find the information?
Centralised computer randomisation is ideal and often     The Methods should tell you how patients were allocated
used in multi-centred trials. Smaller trials may use an   to groups and whether or not randomisation was
independent person (e.g, the hospital pharmacy) to        concealed.
“police” the randomization.
This paper: Yes No Unclear
Comment:
         1b. R- Were the groups similar at the start of the trial?
What is best?                                          Where do I find the information?
If the randomisation process worked (that is, achieved The Results should have a table of "Baseline
วันศุกร์ท่ี 5 ตุลาคม 12
independent person (e.g, the hospital pharmacy) to       concealed.
“police” the randomization.
This paper: Yes No Unclear
Comment:
                               Randomization
        1b. R- Were the groups similar at the start of the trial?
What is best?                                                Where do I find the information?
If the randomisation process worked (that is, achieved The Results should have a table of "Baseline
comparable groups) the groups should be similar. The Characteristics" comparing the randomized groups on a
more similar the groups the better it is.                    number of variables that could affect the outcome (ie.
There should be some indication of whether differences age, risk factors etc). If not, there may be a description of
between groups are statistically significant (ie. p values). group similarity in the first paragraphs of the Results
                                                             section.
This paper: Yes No Unclear
Comment:
        2a. A – Aside from the allocated treatment, were groups treated
        equally?
วันศุกร์ท่ี 5 ตุลาคม 12
Are the result valid?

                          1. Did Intervention & Control groups start with same prognosis?


                          2. Was prognostic balanced maintained
                          as the study progressed?
                            •To what extent was the study blinded?
                          3. Were the groups prognostically balanced at the study’s
                          completion?


วันศุกร์ท่ี 5 ตุลาคม 12
results. Patients should also be analysed in the groups will need to read the results section to clarify the number
  to which they were randomised – ‘intention-to-treat     and reason for losses to follow-up.
  analysis’.
  This paper: Yes No Unclear                 Blindness
  Comment:
           3. M - Were measures objective or were the patients and clinicians kept
           “blind” to which treatment was being received?
  What is best?                                                   Where do I find the information?
  It is ideal if the study is ‘double-blinded’ – that is, both    First, look in the Methods section to see if there is some
  patients and investigators are unaware of treatment             mention of masking of treatments, eg., placebos with the
  allocation. If the outcome is objective (eg., death) then       same appearance or sham therapy. Second, the
  blinding is less critical. If the outcome is subjective (eg.,   Methods section should describe how the outcome was
  symptoms or function) then blinding of the outcome              assessed and whether the assessor/s were aware of the
  assessor is critical.                                           patients' treatment.
  This paper: Yes No Unclear
  Comment:


วันศุกร์ท่ี 5 ตุลาคม 12
There should be some indication of whether differences age, risk factors etc). If not, there may be a description of
between groups are statistically significant (ie. p values). group similarity in the first paragraphs of the Results
                                                             section.
This paper: Co-intervention/Confounders
              Yes No Unclear
Comment:
        2a. A – Aside from the allocated treatment, were groups treated
        equally?
What is best?                                               Where do I find the information?
Apart from the intervention the patients in the different   Look in the Methods section for the follow-up schedule,
groups should be treated the same, eg., additional          and permitted additional treatments, etc and in Results
treatments or tests.                                        for actual use.
This paper: Yes No Unclear
Comment:
        2b. A – Were all patients who entered the trial accounted for? – and
        were they analysed in the groups to which they were randomised?
What is best?                                               Where do I find the information?
วันศุกร์ท่ี 5 ตุลาคม 12
Are the result valid?

                          1. Did Intervention & Control groups start with same prognosis?


                          2. Was prognostic balanced maintained as the study progressed?


                          3. Were the groups prognostically
                          balanced at the study’s completion?
                            •Was follow up complete?
                            •Were patients analyzed in the group to
                            which they were randomized?


วันศุกร์ท่ี 5 ตุลาคม 12
Apart from the intervention the patients in the different Look in the Methods section for the follow-up schedule,
 groups should be treated the same, eg., additional        and permitted additional treatments, etc and in Results
 treatments or tests.                                      for actual use.
                     Intention to treat analysis
 This paper: Yes No Unclear
 Comment:
          2b. A – Were all patients who entered the trial accounted for? – and
          were they analysed in the groups to which they were randomised?
 What is best?                                              Where do I find the information?
 Losses to follow-up should be minimal – preferably less The Results section should say how many patients were
 than 20%. However, if few patients have the outcome of andomised (eg., Baseline Characteristics table) and how
 interest, then even small losses to follow-up can bias the many patients were actually included in the analysis. You
 results. Patients should also be analysed in the groups will need to read the results section to clarify the number
 to which they were randomised – ‘intention-to-treat and reason for losses to follow-up.
 analysis’.
 This paper: Yes No Unclear
 Comment:
          3. M - Were measures objective or were the patients and clinicians kept
          “blind” to which treatment was being received?
วันศุกร์ท่ี 5 ตุลาคม 12
Critical appraisal


วันศุกร์ท่ี 5 ตุลาคม 12
Critical appraisal

                          Are the result valid?


วันศุกร์ท่ี 5 ตุลาคม 12
Critical appraisal

                          Are the result valid?
                          What are the results?


วันศุกร์ท่ี 5 ตุลาคม 12
Critical appraisal

                          Are the result valid?
                          What are the results?
                          How can I apply the result to patient care?


วันศุกร์ท่ี 5 ตุลาคม 12
What are the result?


                          1. How large was the treatment effect?

                          2. How precise was the estimate of
                            treatment effect?


วันศุกร์ท่ี 5 ตุลาคม 12
Critical Appraisal for Therapy
Articles
                             Treatment effect
What were the results?
     1. How large was the treatment effect?
Most often results are presented as dichotomous outcomes (yes or not outcomes that happen or don't happen)
and can include such outcomes as cancer recurrence, myocardial infarction and death. Consider a study in which
15% (0.15) of the control group died and 10% (0.10) of the treatment group died after 2 years of treatment. The
results can be expressed in many ways as shown below.

What is the measure?                                 What does it mean?
Relative Risk (RR) = risk of the outcome in the The relative risk tells us how many times more likely it is that
treatment group / risk of the outcome in the control an event will occur in the treatment group relative to the control
group.                                               group. An RR of 1 means that there is no difference between
                                                     the two groups thus, the treatment had no effect. An RR < 1
                                                     means that the treatment decreases the risk of the outcome.
                                                     An RR > 1 means that the treatment increased the risk of the
                                                     outcome.
In our example, the RR = 0.10/0.15 = 0.67            Since the RR < 1, the treatment decreases the risk of death.
Absolute Risk Reduction (ARR) = risk of the The absolute risk reduction tells us the absolute difference in
outcomeาคม 12 control group - risk of the outcome the rates of events between the two groups and gives an
วันศุกร์ท่ี 5 ตุล
                  in the
group. results are presented as dichotomous outcomes (yes or 1 means that therehappen or don't happen)
Most often                                          group. An RR of not outcomes that is no difference between
and can include such outcomes as cancer recurrence, two groups thus, the treatment had no effect. An RR which
                                                    the myocardial infarction and death. Consider a study in < 1
15% (0.15) of the control group died and 10% (0.10) of thethat the treatmentdied after 2 the risk of the outcome.
                                                    means treatment group decreases years of treatment. The
                             Treatment effect
results can be expressed in many ways as shown below. > 1 means that the treatment increased the risk of the
                                                    An RR
                                                    outcome.
In our example, the RR = 0.10/0.15 = 0.67
What is the measure?                                Since the RR < it the treatment decreases the risk of death.
                                                    What does 1, mean?
AbsoluteRisk (RR) = risk of the outcome inthe The absoluterisk tells us how manythe absolute difference in
Relative Risk Reduction (ARR) = risk of the              relative risk reduction tells us times more likely it is that
outcome in the controlof the outcome thethe control the event of events between the twogroup relative to the control
treatment group / risk group - risk of in outcome an rates will occur in the treatment groups and gives an
in the treatment group. This is also known as the indication of the baseline risk and treatment effect. An ARR of
group.                                              group. An RR of 1 means that there is no difference between
absolute risk difference.                           0 meansgroups thus, the difference had no effect. Angroups1
                                                    the two that there is no treatment between the two RR <
                                                    thus, the treatment had nodecreases the risk of the outcome.
                                                    means that the treatment effect.
In our example, the ARR = 0.15 - 0.10 = 0.05 or TheRR > 1 means that the treatmentaincreased the riskthe the
                                                    An absolute benefit of treatment is 5% reduction in of
5%                                                  death rate.
                                                    outcome.
Relative Risk Reduction 0.10/0.15absolute risk The relative risk 1, the treatment complement ofrisk of death.is
In our example, the RR = (RRR) = = 0.67             Since the RR < reduction is the decreases the the RR and
reduction /Riskof the outcome in therisk of the probably the mostreduction tells us themeasure of treatment
Absolute    risk Reduction (ARR) = control          The absolute risk   commonly reported absolute difference in
group. Anin the control groupcalculatethe outcome effects. It of events between theintwo groups and outcome in the
outcome    alternative way to - risk of the RRR is the rates tells us the reduction the rate of the gives an
to subtract the RR from This is RRR known as the treatment group relative torisk and the controleffect. An ARR of
in the treatment group.  1 (eg. also = 1 - RR)      indication of the baseline  that in treatment group.
In our example, the RRR = 0.05/0.15 = 0.33 or The treatmentthere is no difference between the relative to that
absolute risk difference.                           0 means that reduced the risk of death by 33% two groups
33%                                                 occurring treatment hadgroup.
                                                    thus, the in the control no effect.
In our example, the RRR = 1 - 0.67 = 0.33 or 33% The absolute benefit of treatment is a 5% reduction in the
           Or        ARR = 0.15 - 0.10 = 0.05 or
Number Needed to Treat (NNT) = inverse of the The number needed to treat represents the number of patients
5%                                                  death rate.
ARR and Risk Reduction1(RRR) = absolute risk we need to treat reduction is the complement ofinthe RRto is
Relative is calculated as / ARR.
วันศุกร์ท่ี 5 ตุลาคม 12                             The relative risk with the experimental therapy order and
reductionincludeofsuchoutcome inas cancer recurrence, myocardial infarction and reported measurea of treatment
and can    / risk the outcomes the control probably the most commonly death. Consider study in which
group. An alternative way group died and 10% (0.10) of theIttreatmentthe reductionafterthe yearsofofthe outcomeThethe
15% (0.15) of the control  to calculate the RRR is effects. tells us group died in 2 rate treatment. in
to subtract the RR from 1 (eg. RRRways-as shown below. group effect control group.
                              Treatment relative to that in the
results can be expressed in many       = 1 RR) treatment
In our example, the RRR = 0.05/0.15 = 0.33 or The treatment reduced the risk of death by 33% relative to that
33%                                                   occurring in the control group.
What is the measure?                                  What does it mean?
           Or        RRR = 1 - 0.67 = 0.33 or 33%
Number Needed to = risk of the outcome inofthe The number risk tellsto treat represents themore likelypatients
Relative Risk (RR) Treat (NNT) = inverse the The relative needed us how many times number of it is that
ARR and isgroup / risk of the/ outcome in the control we event to treat with the experimental therapy in order tocontrol
treatment calculated as 1 ARR.                        an need will occur in the treatment group relative to the
group.                                                preventAnbad outcome and incorporates the durationbetween
                                                      group. 1 RR of 1 means that there is no difference of
                                                      treatment. Clinical significance can haddetermined Ansome 1
                                                      the two groups thus, the treatment be no effect. to RR <
                                                      extent by looking at the NNTs, but also byrisk of the outcome.
                                                      means that the treatment decreases the weighing the NNTs
                                                      against >anymeans thatadverse effectsincreased the risk of the
                                                      An RR 1 harms or the treatment (NNHs) of therapy.
In our example, the NNT = 1/ 0.05 = 20                outcome.
                                                      We would need to treat 20 people for 2 years in order to
In our example, the RR = 0.10/0.15 = 0.67             prevent 1 death.1, the treatment decreases the risk of death.
                                                      Since the RR <
AbsoluteHowReduction (ARR) =the of the The of therisk reduction tellseffect? difference in
     1. Risk precise was risk estimate absolute treatment us the absolute
outcomeriskthe the outcome in risk population is notthe ratesand events between the is estimate the true risk based
The true  in of control group - the of the outcome known of the best we can do two groups and gives an
in the treatment group. This thealso knownestimate is called the point estimate. We can gauge how closeARR of
on the sample of patients in
วันศุกร์ท่ี 5 ตุลาคม 12
                               is trial. This as the indication of the baseline risk and treatment effect. An this
Critical appraisal


วันศุกร์ท่ี 5 ตุลาคม 12
Critical appraisal

                          Are the result valid?


วันศุกร์ท่ี 5 ตุลาคม 12
Critical appraisal

                          Are the result valid?
                          What are the results?


วันศุกร์ท่ี 5 ตุลาคม 12
Critical appraisal

                          Are the result valid?
                          What are the results?
                          How can I apply the result to patient
                          care?


วันศุกร์ท่ี 5 ตุลาคม 12
Apply to patient care?


                          1.Were the study patients similar to
                            my patient?

                          2.Were all clinically important
                            outcomes considered?

                          3.Are the likely treatment benefits
                            worth the potential harm and costs?


วันศุกร์ท่ี 5 ตุลาคม 12
“ข้อซักถาม”


วันศุกร์ท่ี 5 ตุลาคม 12
สวัสดี


                                   23

วันศุกร์ท่ี 5 ตุลาคม 12

Ebm for staff (rct)

  • 1.
    HOW TO APPRAISE MEDICAL JOURNAL (THERAPY) นพ.บริบูรณ์ เชนธนากิจ หน่วยเวชศาสตร์ฉุกเฉิน ภาควิชาเวชศาสตร์ครอบครัว คณะแพทยศาสตร์มหาวิทยาลัยเชียงใหม่ วันศุกร์ท่ี 5 ตุลาคม 12
  • 2.
    What is EBM? Patient Concerns EBM Best research Clinical evidence Expertise วันศุกร์ท่ี 5 ตุลาคม 12
  • 3.
  • 4.
    Critical appraisal Are the result valid? วันศุกร์ท่ี 5 ตุลาคม 12
  • 5.
    Critical appraisal Are the result valid? What are the results? วันศุกร์ท่ี 5 ตุลาคม 12
  • 6.
    Critical appraisal Are the result valid? What are the results? How can I apply the result to patient care? วันศุกร์ท่ี 5 ตุลาคม 12
  • 7.
    Are the resultvalid? ประเด็นที่ต้องประเมินว่า RCT นั้นน่าจะมี BIAS หรือไม่ 1. Did Intervention & Control groups start with same prognosis? 2. Was prognostic balanced maintained as the study progressed? 3. Were the groups prognostically balanced at the study’s complettion? วันศุกร์ท่ี 5 ตุลาคม 12
  • 8.
  • 9.
    Are the resultvalid? 1. Did Intervention & Control groups start with same prognosis? •Were patients randomized? •Was randomization concealed? •were patients similar in respect to known prognostic factor 2. Was prognostic balanced maintained as the study progressed? 3. Were the groups prognostically balanced at the study’s completion? วันศุกร์ท่ี 5 ตุลาคม 12
  • 10.
    THERAPY STUDY: Arethe results of the trial valid? (Internal Validity) What question did the study ask? Patients – Randomization Intervention - Comparison - Outcome(s) - 1a. R- Was the assignment of patients to treatments randomised? What is best? Where do I find the information? Centralised computer randomisation is ideal and often The Methods should tell you how patients were allocated used in multi-centred trials. Smaller trials may use an to groups and whether or not randomisation was independent person (e.g, the hospital pharmacy) to concealed. “police” the randomization. This paper: Yes No Unclear Comment: 1b. R- Were the groups similar at the start of the trial? What is best? Where do I find the information? If the randomisation process worked (that is, achieved The Results should have a table of "Baseline วันศุกร์ท่ี 5 ตุลาคม 12
  • 11.
    independent person (e.g,the hospital pharmacy) to concealed. “police” the randomization. This paper: Yes No Unclear Comment: Randomization 1b. R- Were the groups similar at the start of the trial? What is best? Where do I find the information? If the randomisation process worked (that is, achieved The Results should have a table of "Baseline comparable groups) the groups should be similar. The Characteristics" comparing the randomized groups on a more similar the groups the better it is. number of variables that could affect the outcome (ie. There should be some indication of whether differences age, risk factors etc). If not, there may be a description of between groups are statistically significant (ie. p values). group similarity in the first paragraphs of the Results section. This paper: Yes No Unclear Comment: 2a. A – Aside from the allocated treatment, were groups treated equally? วันศุกร์ท่ี 5 ตุลาคม 12
  • 12.
    Are the resultvalid? 1. Did Intervention & Control groups start with same prognosis? 2. Was prognostic balanced maintained as the study progressed? •To what extent was the study blinded? 3. Were the groups prognostically balanced at the study’s completion? วันศุกร์ท่ี 5 ตุลาคม 12
  • 13.
    results. Patients shouldalso be analysed in the groups will need to read the results section to clarify the number to which they were randomised – ‘intention-to-treat and reason for losses to follow-up. analysis’. This paper: Yes No Unclear Blindness Comment: 3. M - Were measures objective or were the patients and clinicians kept “blind” to which treatment was being received? What is best? Where do I find the information? It is ideal if the study is ‘double-blinded’ – that is, both First, look in the Methods section to see if there is some patients and investigators are unaware of treatment mention of masking of treatments, eg., placebos with the allocation. If the outcome is objective (eg., death) then same appearance or sham therapy. Second, the blinding is less critical. If the outcome is subjective (eg., Methods section should describe how the outcome was symptoms or function) then blinding of the outcome assessed and whether the assessor/s were aware of the assessor is critical. patients' treatment. This paper: Yes No Unclear Comment: วันศุกร์ท่ี 5 ตุลาคม 12
  • 14.
    There should besome indication of whether differences age, risk factors etc). If not, there may be a description of between groups are statistically significant (ie. p values). group similarity in the first paragraphs of the Results section. This paper: Co-intervention/Confounders Yes No Unclear Comment: 2a. A – Aside from the allocated treatment, were groups treated equally? What is best? Where do I find the information? Apart from the intervention the patients in the different Look in the Methods section for the follow-up schedule, groups should be treated the same, eg., additional and permitted additional treatments, etc and in Results treatments or tests. for actual use. This paper: Yes No Unclear Comment: 2b. A – Were all patients who entered the trial accounted for? – and were they analysed in the groups to which they were randomised? What is best? Where do I find the information? วันศุกร์ท่ี 5 ตุลาคม 12
  • 15.
  • 16.
    Are the resultvalid? 1. Did Intervention & Control groups start with same prognosis? 2. Was prognostic balanced maintained as the study progressed? 3. Were the groups prognostically balanced at the study’s completion? •Was follow up complete? •Were patients analyzed in the group to which they were randomized? วันศุกร์ท่ี 5 ตุลาคม 12
  • 17.
    Apart from theintervention the patients in the different Look in the Methods section for the follow-up schedule, groups should be treated the same, eg., additional and permitted additional treatments, etc and in Results treatments or tests. for actual use. Intention to treat analysis This paper: Yes No Unclear Comment: 2b. A – Were all patients who entered the trial accounted for? – and were they analysed in the groups to which they were randomised? What is best? Where do I find the information? Losses to follow-up should be minimal – preferably less The Results section should say how many patients were than 20%. However, if few patients have the outcome of andomised (eg., Baseline Characteristics table) and how interest, then even small losses to follow-up can bias the many patients were actually included in the analysis. You results. Patients should also be analysed in the groups will need to read the results section to clarify the number to which they were randomised – ‘intention-to-treat and reason for losses to follow-up. analysis’. This paper: Yes No Unclear Comment: 3. M - Were measures objective or were the patients and clinicians kept “blind” to which treatment was being received? วันศุกร์ท่ี 5 ตุลาคม 12
  • 18.
  • 19.
    Critical appraisal Are the result valid? วันศุกร์ท่ี 5 ตุลาคม 12
  • 20.
    Critical appraisal Are the result valid? What are the results? วันศุกร์ท่ี 5 ตุลาคม 12
  • 21.
    Critical appraisal Are the result valid? What are the results? How can I apply the result to patient care? วันศุกร์ท่ี 5 ตุลาคม 12
  • 22.
    What are theresult? 1. How large was the treatment effect? 2. How precise was the estimate of treatment effect? วันศุกร์ท่ี 5 ตุลาคม 12
  • 23.
    Critical Appraisal forTherapy Articles Treatment effect What were the results? 1. How large was the treatment effect? Most often results are presented as dichotomous outcomes (yes or not outcomes that happen or don't happen) and can include such outcomes as cancer recurrence, myocardial infarction and death. Consider a study in which 15% (0.15) of the control group died and 10% (0.10) of the treatment group died after 2 years of treatment. The results can be expressed in many ways as shown below. What is the measure? What does it mean? Relative Risk (RR) = risk of the outcome in the The relative risk tells us how many times more likely it is that treatment group / risk of the outcome in the control an event will occur in the treatment group relative to the control group. group. An RR of 1 means that there is no difference between the two groups thus, the treatment had no effect. An RR < 1 means that the treatment decreases the risk of the outcome. An RR > 1 means that the treatment increased the risk of the outcome. In our example, the RR = 0.10/0.15 = 0.67 Since the RR < 1, the treatment decreases the risk of death. Absolute Risk Reduction (ARR) = risk of the The absolute risk reduction tells us the absolute difference in outcomeาคม 12 control group - risk of the outcome the rates of events between the two groups and gives an วันศุกร์ท่ี 5 ตุล in the
  • 24.
    group. results arepresented as dichotomous outcomes (yes or 1 means that therehappen or don't happen) Most often group. An RR of not outcomes that is no difference between and can include such outcomes as cancer recurrence, two groups thus, the treatment had no effect. An RR which the myocardial infarction and death. Consider a study in < 1 15% (0.15) of the control group died and 10% (0.10) of thethat the treatmentdied after 2 the risk of the outcome. means treatment group decreases years of treatment. The Treatment effect results can be expressed in many ways as shown below. > 1 means that the treatment increased the risk of the An RR outcome. In our example, the RR = 0.10/0.15 = 0.67 What is the measure? Since the RR < it the treatment decreases the risk of death. What does 1, mean? AbsoluteRisk (RR) = risk of the outcome inthe The absoluterisk tells us how manythe absolute difference in Relative Risk Reduction (ARR) = risk of the relative risk reduction tells us times more likely it is that outcome in the controlof the outcome thethe control the event of events between the twogroup relative to the control treatment group / risk group - risk of in outcome an rates will occur in the treatment groups and gives an in the treatment group. This is also known as the indication of the baseline risk and treatment effect. An ARR of group. group. An RR of 1 means that there is no difference between absolute risk difference. 0 meansgroups thus, the difference had no effect. Angroups1 the two that there is no treatment between the two RR < thus, the treatment had nodecreases the risk of the outcome. means that the treatment effect. In our example, the ARR = 0.15 - 0.10 = 0.05 or TheRR > 1 means that the treatmentaincreased the riskthe the An absolute benefit of treatment is 5% reduction in of 5% death rate. outcome. Relative Risk Reduction 0.10/0.15absolute risk The relative risk 1, the treatment complement ofrisk of death.is In our example, the RR = (RRR) = = 0.67 Since the RR < reduction is the decreases the the RR and reduction /Riskof the outcome in therisk of the probably the mostreduction tells us themeasure of treatment Absolute risk Reduction (ARR) = control The absolute risk commonly reported absolute difference in group. Anin the control groupcalculatethe outcome effects. It of events between theintwo groups and outcome in the outcome alternative way to - risk of the RRR is the rates tells us the reduction the rate of the gives an to subtract the RR from This is RRR known as the treatment group relative torisk and the controleffect. An ARR of in the treatment group. 1 (eg. also = 1 - RR) indication of the baseline that in treatment group. In our example, the RRR = 0.05/0.15 = 0.33 or The treatmentthere is no difference between the relative to that absolute risk difference. 0 means that reduced the risk of death by 33% two groups 33% occurring treatment hadgroup. thus, the in the control no effect. In our example, the RRR = 1 - 0.67 = 0.33 or 33% The absolute benefit of treatment is a 5% reduction in the Or ARR = 0.15 - 0.10 = 0.05 or Number Needed to Treat (NNT) = inverse of the The number needed to treat represents the number of patients 5% death rate. ARR and Risk Reduction1(RRR) = absolute risk we need to treat reduction is the complement ofinthe RRto is Relative is calculated as / ARR. วันศุกร์ท่ี 5 ตุลาคม 12 The relative risk with the experimental therapy order and
  • 25.
    reductionincludeofsuchoutcome inas cancerrecurrence, myocardial infarction and reported measurea of treatment and can / risk the outcomes the control probably the most commonly death. Consider study in which group. An alternative way group died and 10% (0.10) of theIttreatmentthe reductionafterthe yearsofofthe outcomeThethe 15% (0.15) of the control to calculate the RRR is effects. tells us group died in 2 rate treatment. in to subtract the RR from 1 (eg. RRRways-as shown below. group effect control group. Treatment relative to that in the results can be expressed in many = 1 RR) treatment In our example, the RRR = 0.05/0.15 = 0.33 or The treatment reduced the risk of death by 33% relative to that 33% occurring in the control group. What is the measure? What does it mean? Or RRR = 1 - 0.67 = 0.33 or 33% Number Needed to = risk of the outcome inofthe The number risk tellsto treat represents themore likelypatients Relative Risk (RR) Treat (NNT) = inverse the The relative needed us how many times number of it is that ARR and isgroup / risk of the/ outcome in the control we event to treat with the experimental therapy in order tocontrol treatment calculated as 1 ARR. an need will occur in the treatment group relative to the group. preventAnbad outcome and incorporates the durationbetween group. 1 RR of 1 means that there is no difference of treatment. Clinical significance can haddetermined Ansome 1 the two groups thus, the treatment be no effect. to RR < extent by looking at the NNTs, but also byrisk of the outcome. means that the treatment decreases the weighing the NNTs against >anymeans thatadverse effectsincreased the risk of the An RR 1 harms or the treatment (NNHs) of therapy. In our example, the NNT = 1/ 0.05 = 20 outcome. We would need to treat 20 people for 2 years in order to In our example, the RR = 0.10/0.15 = 0.67 prevent 1 death.1, the treatment decreases the risk of death. Since the RR < AbsoluteHowReduction (ARR) =the of the The of therisk reduction tellseffect? difference in 1. Risk precise was risk estimate absolute treatment us the absolute outcomeriskthe the outcome in risk population is notthe ratesand events between the is estimate the true risk based The true in of control group - the of the outcome known of the best we can do two groups and gives an in the treatment group. This thealso knownestimate is called the point estimate. We can gauge how closeARR of on the sample of patients in วันศุกร์ท่ี 5 ตุลาคม 12 is trial. This as the indication of the baseline risk and treatment effect. An this
  • 26.
  • 27.
    Critical appraisal Are the result valid? วันศุกร์ท่ี 5 ตุลาคม 12
  • 28.
    Critical appraisal Are the result valid? What are the results? วันศุกร์ท่ี 5 ตุลาคม 12
  • 29.
    Critical appraisal Are the result valid? What are the results? How can I apply the result to patient care? วันศุกร์ท่ี 5 ตุลาคม 12
  • 30.
    Apply to patientcare? 1.Were the study patients similar to my patient? 2.Were all clinically important outcomes considered? 3.Are the likely treatment benefits worth the potential harm and costs? วันศุกร์ท่ี 5 ตุลาคม 12
  • 31.
  • 32.
    สวัสดี 23 วันศุกร์ท่ี 5 ตุลาคม 12