Download to read offline
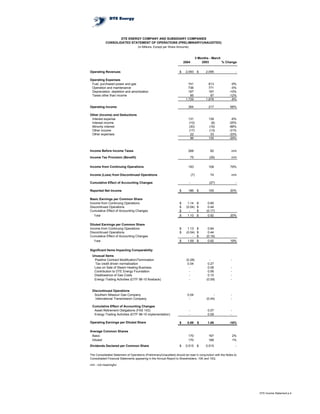


DTE Energy reported a 20% increase in net income for the first quarter of 2004 compared to the same period in 2003. Operating expenses decreased 8% due to lower fuel and operation and maintenance costs. Operating income increased 68% while income from continuing operations rose 79%. Earnings per share from continuing operations were $1.14 for Q1 2004 compared to $0.65 for Q1 2003, an increase of 75%. Significant special items impacting comparability between the periods included a $0.28 per share benefit from a pipeline contract termination in 2004.


